Nepse technical analysis july 20 july 25, 2014 (eng & nep)
•
0 likes•378 views

Technical analysis of Nepal Stock Exchange (Nepse) index for the week from July 20, 2014 to July 25, 2014. The technical analysis includes summary, RSI, MACD and Bollinger band analysis. The analysis is done by Kriti Capital & Investments Ltd.

Recommended
Recommended
More Related Content
Viewers also liked
Viewers also liked (10)
Similar to Nepse technical analysis july 20 july 25, 2014 (eng & nep)
Similar to Nepse technical analysis july 20 july 25, 2014 (eng & nep) (20)
More from Kriti Capital & Investments Ltd.
More from Kriti Capital & Investments Ltd. (20)
Recently uploaded
Recently uploaded (20)
Nepse technical analysis july 20 july 25, 2014 (eng & nep)
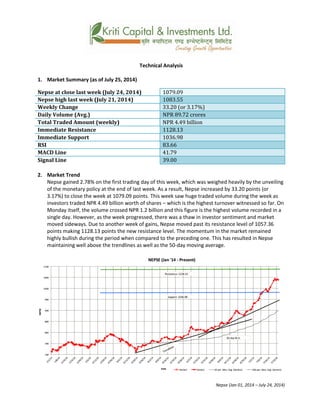
- 1. Technical Analysis 1. Market Summary (as of July 25, 2014) Nepse at close last week (July 24, 2014) 1079.09 Nepse high last week (July 21, 2014) 1083.55 Weekly Change 33.20 (or 3.17%) Daily Volume (Avg.) NPR 89.72 crores Total Traded Amount (weekly) NPR 4.49 billion Immediate Resistance 1128.13 Immediate Support 1036.98 RSI 83.66 MACD Line 41.79 Signal Line 39.00 2. Market Trend Nepse gained 2.78% on the first trading day of this week, which was weighed heavily by the unveiling of the monetary policy at the end of last week. As a result, Nepse increased by 33.20 points (or 3.17%) to close the week at 1079.09 points. This week saw huge traded volume during the week as investors traded NPR 4.49 billion worth of shares – which is the highest turnover witnessed so far. On Monday itself, the volume crossed NPR 1.2 billion and this figure is the highest volume recorded in a single day. However, as the week progressed, there was a thaw in investor sentiment and market moved sideways. Due to another week of gains, Nepse moved past its resistance level of 1057.36 points making 1128.13 points the new resistance level. The momentum in the market remained highly bullish during the period when compared to the preceding one. This has resulted in Nepse maintaining well above the trendlines as well as the 50-day moving average. Nepse (Jan 01, 2014 – July 24, 2014)
- 2. 3. RSI RSI is a form of leading indicator that is believed to be most effective during periods of sideways movement. Such indicators may create numerous buy and sell signals that are useful when the market is not clearly trending upwards or downwards. The first two days saw the RSI increase in line with Nepse as it reached as high as 89.04 on Monday. However, by the end of the trading week, the RSI closed at 83.66, which is lower by 0.94 points when compared to the previous week. This indicates that the market has been continuously trading in the overbought zone. RSI (Jan 01, 2013 – July 24, 2014) 4. MACD The MACD is a momentum oscillator formed by using two different types of moving averages, which provides specific buying or selling signals. When a MACD line crosses above the signal line, it is considered to be a positive sign and indicates a time to buy, and vice-versa. The MACD and Signal lines both increased this week to end at 41.79 and 39.00 points respectively. As a result, both these lines are gradually moving closer to their highest points due to high positive momentum in the market. MACD (Jan 01, 2013 – July 24, 2014) 5. Bollinger Bands The Bollinger Band is a technical indicator that consists of a moving average (21-day) along with two trading bands above (upper band) and below it (lower band). The bands are an indication of volatility, which are represented by calculating standard deviation. With Nepse’s rise this week, it slightly touched the upper band and began moving laterally. This still represents an overbought scenario in the market with relatively higher volatility in recent times.
- 3. Bollinger Bands (Nov 04, 2013 – July 24, 2014) Overview: This period witnessed the effects of the monetary policy report as Nepse saw a 2.78% increase on the first trading day. By the end of the week, Nepse saw an increase of 33.20 points (or 3.17%) to close at 1079.09 points. Nepse reached 1083.55 points on Monday, which also happens to be the highest point reached in about six years. The total weekly volume of NPR 4.49 billion and the volume of NPR 1.2 billion on Monday are the highest volumes recorded in a trading week and a single day respectively. The RSI indicator stands at 83.66 as the market is still trading in the overbought zone. The MACD indicator on the other hand, continues to show a bullish momentum in the market. The Bollinger Bands still represent an overbought scenario in the market with high volatility in the market. Overall, there has been no change in investor psychology, as investors remain highly bullish towards the stock market for the near term future.
- 4. k|fljlws ljZn]if0f ahf/ ;f/f+z ->fj0f $ b]vL >fj0f * ;Ddsf]_ aGb cªs ->fj0f *_ M !)&(=)( pRr cªs ->fj0f %_ M !)*#=%% ;fKtflxs kl/jt{g M ##=@) cªs -#=!& k|ltzt_ b}lgs cf};t Jofkf/ M ¿= *(=&@ s/f]8 s'n ;fKtflxs Jofkf/ M ¿= $ ca{ $( s/f]8 tTsflng 6]jf M !!@*=!# tTsflng k|lt/f]w M !)#^=(* cf/P;cfO{ M *#=^^ PdP;L8L M $!=&( l;Ugn nfO{g M #(=)) %) tyf @)) lbg] d'leª Pe/]h cl3Nnf] xKtfsf] cGTodf hf/L u/LPsf] df}lb«s gLltsf sf/0f, g]K;] ;ftfsf] klxnf] lbg @=&* k|ltztn] a9]sf] lyof] . kmn:j?k, g]K;] ##=@) cªs -#=!& k|ltzt_ n] a9]/ !)&(=)( cªsdf aGb ePsf] 5 . o; ;ftf Jofkf/ -ef]No"d_ klg a9]/ $=$( ca{ ?k}Fof k'u]sf] 5 h"g clxn] ;Ddsf] ;a} eGbf ljzfn Jofkf/ -ef]No"d_ xf] . ;f]daf/ dfq}, Jofkf/ -ef]No"d_ !=@ ca{ ?k}Fof gf3]sf] lyof] h"g Ps lbgdf ePsf] ;a} clxn] ;Ddsf eGbf 7"nf] sf/f]af/ xf] . t/, xKtfsf] k|ult ;+u}, nufgLstf{x?sf] efjgf lzltn x'b}F uPsf] lyof] h;sf sf/0f ahf/ t];f]{ /xof] . o; xKtfsf] nfesf sf/0f g]K;]n] cl3Nnf] xKtfsf] !)%&=## cªssf] k|lt/f]w tx sf6]sf] 5 / gofF k|lt/f]w cªs !!@*=!# cªs k'u]sf] 5 . cl3Nnf] xKtfsf] t'ngfdf o; xKtfsf] cjlwe/ ahf/ a'ln; g} /xof] . o;n] ubf{, g]K;] %)–lbg] d'leË Pe/]h / k|j[lt /]vf -6«]G8 nfO{g_ eGbf dfly g} sfod /x]sf] 5 . Nepse (Jan 01, 2014 – July 24, 2014)
- 5. l/n]l6j :6«]Gy OG8]S; -cf/P;cfO{_ cf/P;cfO{ k|fljlws ljZn]if0fsf] o:tf] cf}hf/ xf], h;nfO{ Pstlkm{ ?kdf rln/x]sf] ahf/df Jofkf/ /0fgLlt agfpg a9L pkof]uL dflgG5 . To;}u/L, o;n] ahf/df vl/b / ljlqmsf] :ki6 ;+s]t b]vfpg] u5{ . klxnf] b'O{ sf/f]af/ lbg cf/P;cfO{ /]vf g]K;] ;+u} a9of] / ;f]daf/;Dd of] *(=)$ cªs k'u]sf] lyof] . t/ xKtfsf] clGtd sf/f]af/ lbg ;Dd cf/P;cfO{ cl3Nnf] xKtfsf] t'ngfdf )=($ cªsn] 36]/ *#=^^ cªs k'u]sf] 5 . o;n] ahf/ nuftf/ cf]e/a6 If]qdf sf/f]af/ eO{ /x]sf] ;+s]t u/]sf] 5 . RSI (Jan 01, 2013 – July 25, 2014) d'leª Pe/]h sGeh]{G; 8fOeh]{G; -PdP;L8L_ PdP;L8Ldf b'O{ cf]6f /]vf x'G5g, h;df Pp6fn] ahf/sf] lbzf kl/jt{gsf] ;+s]t u5{ eg] csf]{n] ahf/sf] k|j[lQ -6«]08_ b]vfpg] u5{ . olb PdP;L8L /]vfn] l;Ung /]vfnfO{ tnaf6 dfly sf6]df o;nfO{ ;sf/fTds ;+s]tsf ?kdf lnO{G5 / o;n] z]o/x? lsGg] ;+s]t ub{5 . o; ;ftf, PdP;L8L / l;Ugn /]vf b'j} a9]/ s|dzM $!=&( / #(=)) cªs k'u]sf] 5 . kmn:j?k, b'j} /]vfx? ahf/sf] ;sf/fTds k|j[ltsf sf/0f lj:tf/} pRr cªs glhs al9 /x]sf] 5 . MACD (Jan 01, 2013 – July 24, 2014) af]lnªu/ Aof08 af]lnªu/ Aof08 Ps k|fljlws ljZn]if0f ;"rs xf] h;df @!–lbg] d'leË Pe/]hsf ;fy b'O{ Aof08 -Pp6f dfly_ / Pp6f tn_ x'G5g . lo Aof08x?n] cl:y/tfsf] ;+s]t ub{5g, h'g :6fG88{ 8]leP;g u0fgf u/]/ kQf nufO{G5 . g]K;]df j[l4 ;+u} o;n] dflyNnf] Aof08 5f]Psf] 5 / of] t];f]{ x'g yfn]sf] 5 . o;n] xfnsf] ;dodf a9]sf] cl:y/tfn] ahf/ cf]e/a6 g} /x]sf] ub{5 .
- 6. Bollinger Bands (Jan 01, 2013 – July 24, 2014) ;du{dfM o; ;ftfsf] klxnf] sf/f]af/ lbg @=&* k|ltztn] a9]sf] g]K;]df df}lb«s gLltsf] k|efj b]lvPsf] lyof] . xKtfsf] cGTodf, g]K;] ##=@) cªs -jf #=!& k|ltzt_ n] a9]/ !)&(=)( cªsdf aGb ePsf] 5 . ;f]daf/ g]K;] !)*#=%% cªs k'u]sf] lyof] h"g ljut ^ jif{sf] pRr cªs xf] . o; xKtf, Ps xKtf / Ps lbgdf -;f]daf/_ g} s|dzM $=$( ca{ ?k}Fofsf] s"n ;fKtflxs cf}ift Jofkf/ -ef]No"d_ / !=@ ca{ ?k}Fofsf] s"n b}lgs Jofkf/ - ef]No"d_ ePsf] lyof] h"g clxn] ;Ddsf] ;a} eGbf pRr sf/f]af/ xf] . cf/P;cfO{ ;"rs *#=^^ cªsdf aGb eof] h;n] ahf/ cf]e/a6 If]qdf /x]sf] b]vfPsf] 5 . csf{ tk{m, PdP;L8L ;"rsn] eg] ahf/ a'ln; k|j[ltdf /x]sf] b]vfPsf] 5 . af]lnË/ Aof08n] eg] pRr cl:y/tf /x]sfn] ahf/ cf]e/a6 If]qdf /x]sf] ;+s]t u/]sf] 5 . ;du|df, nufgLstf{x? ahf/ lgs6 eljiosf nflu a'ln; /xg] ljZjf; u/]sfn], nufgLstf{sf] dgf]lj¡ffgdf s'g} kl/jt{g gcfPsf] a'‰g ;lsG5 .