Nepse Technical Analysis September 13 - September 17, 2015
•
0 likes•259 views

Nepse Weekly Technical Analysis September 13 - September 17, 2015

Recommended
Recommended
More Related Content
What's hot
What's hot (19)
Viewers also liked
Viewers also liked (16)
Similar to Nepse Technical Analysis September 13 - September 17, 2015
Similar to Nepse Technical Analysis September 13 - September 17, 2015 (19)
More from Kriti Capital & Investments Ltd.
More from Kriti Capital & Investments Ltd. (15)
Recently uploaded
Recently uploaded (20)
Nepse Technical Analysis September 13 - September 17, 2015
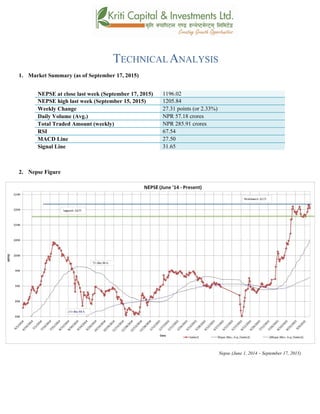
- 1. TECHNICALANALYSIS 1. Market Summary (as of September 17, 2015) NEPSE at close last week (September 17, 2015) 1196.02 NEPSE high last week (September 15, 2015) 1205.84 Weekly Change 27.31 points (or 2.33%) Daily Volume (Avg.) NPR 57.18 crores Total Traded Amount (weekly) NPR 285.91 crores RSI 67.54 MACD Line 27.50 Signal Line 31.65 2. Nepse Figure Nepse (June 1, 2014 – September 17, 2015)
- 2. 3. Trend Analysis Last week, Nepse hovered around the 1200 mark. Nepse touched 1200 mark twice before, but during the middle of last week, it crossed over the 1200 and closed at 1205.84 level, which is a new record high. The benchmark index showed bullish trend at the beginning of last week. During the first three days, it’s candle structure formed white three solders, indicating that the market will show bullish attitude in days to come. Although the market formed three white solders, the market ended in the red on the last two days of the week, which seems to be a normal market correction. Furthermore, market fluctuation decreased as indicated by the convergence of the Bollinger bands. (Note: The capital market is affected by various political scenarios. Given the current condition regarding the announcement of the new constitution on 3rd of Aswin, it is expected that Nepse will trigger bullish momentum in the coming days.) 4. Resistance and Support Immediate Support 1175 Support 2 1168 Immediate Resistance 1205 1218 Currently, the immediate support level stands at 1175, which previously was used as a strong support level for Nepse. When the index formed double top, its support level stood at 1175, indicating a strong support level for the index. Considering the record high last week, its immediate resistance now stands at 1205 and second resistance at 1218. Considering the positive political news, the current trend is expected to be bullish and cross both the resistance levels in the coming weeks. 5. Trend Indicator a.) MACD The MACD is a momentum oscillator formed by using two different types of moving averages, which provides specific buying or selling signals. When a MACD line crosses above the signal line, it is considered to be a positive sign and indicates a time to buy, and vice-versa. The Signal line experienced a steady fall, where as Macd did not show much change in the course of last week. The Macd and signal line, at the beginning of last week, was at 29.01 and 36.45 respectively. The Macd is still moving below the signal line, showing a rather bearish outlook of the market. However, the distance between the lines has narrowed down. By the end of the week, the macd and signal lines ended at 27.50 and 31.65 respectively.
- 3. b.) RSI RSI is a form of leading indicator that is believed to be most effective during periods of sideways movement. Such indicators may create numerous buy and sell signals that are useful when the market is not clearly trending upwards or downwards. The RSI, at the beginning of last week, stood at 68.12 level. Through the course of the week, it moved pass the 70’s level, which shows that high buying pressure is still present in the market. The long term trend in the market still looks bullish as the RSI has been hovering around and above the 60’s level for a long period. Towards the end of the week, the RSI fell and came down to 67.54 level. c.) Bollinger Bands The Bollinger Band is a technical indicator that consists of a moving average (21-day) along with two trading bands above (upper band) and below it (lower band). The bands are an indication of volatility, which are represented by calculating standard deviation. The benchmark index moved closer towards the upper bollinger band during last week, signifying over- bought condition in the market. Moreover, the upper and lower bands have converged significantly in the course of last week, indicating a decrease in the market volatility.
- 4. 6. Volume Indicator (On-Balance Volume) On-Balance Volume (OBV) is a momentum indicator that relates volume to the current price of the index or security. It measures buying and selling pressure at the market. It acts as a cumulative indicator that adds volume on up days and subtracts volume on down days. If a price increase is supported by OBV, it confirms an uptrend, whereas if a price decrease is supported by OBV, it confirms a downtrend. Last week, the OBV (On-Balance Volume) showed more volatility as compared to the movement of the benchmark index. This shows that in the current situation, volume has not affected the Nepse trend on a large scale. The average weekly volume transactions increased to NPR 57.18 from NPR 43.54 the week prior. 7. Overview The Nepse index made decent gain last week. The benchmark index, increased by 27.31 points (or up 2.33%) to close at 1196.02. The 50-day moving average (MA) is still moving upward at a steep rate, and also moving above the 200-day MA, indicating that the overall outlook of the market looks good. The index also made a record high in the middle of last week, when it closed at 1205.84. The average weekly volume transactions increased to NPR 57.18 from NPR 43.54 the week prior. The RSI ended at 67.54 level, which shows that the buying pressure in the market is still present. The Bollinger bands have converged significantly, indicating decrease in market volatility. The Macd line is getting closer towards the signal line. If the bullish trend continues, the Macd line will cross over the signal line in days to come. The support and resistance level stands at 1175 and 1205 respectively.
- 5. k|fljlwsljZn]if0f !_ahf/ ;f/f+z -ebf}#!, @)&@ ;Ddsf]_ aGb cªs -ebf}#!, @)&@_ !!(^=)@ pRr cªs -uPsf] ;ftf_ !@)%=*$ ;fKtflxs kl/jt{g @&=#! -@=##k|ltzt_ b}lgscf};t Jofkf/ ¿=%&=!*s/f]8 s'n ;fKtflxsJofkf/ ¿ @*%=(! s/f]8 cf/P;cfO{ ^&=%$ PdP;L8L @&=%) l;UgnnfO{g #!=^% @_ ahf/ k|j[lt Nepse (June 1, 2014 – September 17, 2015)
- 6. #_ 6]«G8 ljZn]if0f uPsf] ;ftf g]K;] kl/;"rs !@)) cªssf] xf/fxf/Ldf /xof] . kl/;"rsn] !@)) cªsb'O{ kN6 5'g k'Uof] t/ ;ftfsf] dWolt/ !@)) cªskf/ u/L kl/;"rsn] gof{ /]s8{ sfodug{ ;kmn /xof] . kl/;"rsdf b]lvPsf] p5fnn] ahf/ a'lnz 6]G8lt/ uO{/x]sf] ;+s]t ub{5 . t/ ;ftfsf] cGtolt/ b]lvPsf] lu/fj6nfO{ ;fdfGo s/]S;gsf] sf] ?kdf ;d]t lng ;lsG5 . ;fy} ahf/sf] cl:yt/tfdf ;d]t sdLcfPsf] ;+s]t b]lvG5 . $_ 6]jftyfk|lt/f]w cªs glhssf] 6]jfcªs !!&% 6]jfcªs @ !!^* glhssf] k|lt/f]w cªs !@)% xfnsf] cj:yfdfglhssf] 6]jfcªs !!&% /x]sf] 5 h'gcªsklxn]sf] cj:yfdfklgalnof] 6]jfcªssf] ?kdf /x]sf] lyof] . h'g a]nf g]K;] kl/;"rsn] 8an 6k agfpgk'Uof] Tof] a]nf b]lv g]K;] kl/;"rsdf !!&% alnof] 6]jfcfwf/sf] ?kdf /x]sf] 5 . xfnsf] cj:yfdfglhsf] k|lt/f]w cªssf] ?kdf !@)% cªs /x]sf] 5 . xfnsf] ahf/sf] l:ylt x]bf{ kl/;"rsn] xfnsf] glhssf] k|lt/f]w cªsc? ;d]t l5§} kf/ ug{ ;Sg] ;+Defjgfalnof] /x]sf] 5 . %_ g]K;] 6]«G8 ;"rs s_ d'leª Pe/]hsGeh]{G; 8fOeh]{G; -PdP;L8L_ PdP;L8Ldf b'O{ cf]6f /]vf x'G5g, h;df Pp6fn] ahf/sf] lbzf kl/jt{gsf] ;+s]t u5{ eg] csf]{n] ahf/sf] k|j[lQ -6«]08_ b]vfpg] u5{ . olb PdP;L8L /]vfn] l;Ung /]vfnfO{ tnaf6 dfly sf6]dfo;nfO{ ;sf/fTds ;+s]tsf ?kdflnO{G5 / o;n] z]o/x? lsGg] ;+s]t ub{5 . uPsf] ;ftfPdP;L8L nfO{gtyfl;UngnfO{gdflu/fj6 b]lvof] / PdP;L8L nfO{gn] uPsf] ;ftfvf;} kl/jt{gsf] ;+s]t b]vfPg . PdP;L8L nfO{g xfnsf] cj:yfdfl;UngnfO{g eGbftn /x]sf] tyfb'O{ nfO{g aLrdf a9]sf] b'/Ln] ;d]t ahf/ s]xL ;dosf] nflulaol/; b]lvG5 . xfnsf] nfluPdP;;L8L nfO{g tyfl;UgnnfO{g @&=%)tyf#!=^%df /x]sf] 5 .
- 7. v_ l/n]l6j :6«]Gy OG8]S; -cf/P;cfO{_ cf/P;cfO{ k|fljlwsljZn]if0fsf] o:tf] cf}hf/ xf], h;nfO{ Pstlkm{ ?kdfrln/x]sf] ahf/dfJofkf/ /0fgLlt agfpg a9L pkof]uL dflgG5 . To;}u/L, o;n] ahf/dfvl/b / ljlqmsf] :ki6 ;+s]t b]vfpg] u5{ . uPsf] ;ftfsf] z'?dfcf/P;cfO{ ^*=!@cªsdf /x]sf]lyof] / ;ftfsf] w]/} h;f] sf/f]af/ lbgx? cf/P;cfO{ &) cªssf] xf/fxf/Ld} /xof] h;n] ahf/dflsGg] xf]8afhL km]l/ a9]sf] ;+s]t ub{5 . ;d|udfcf/P;cfO{ ^) cªstyf ;f] eGbfdfly g} /x]sf] x'Fbfahf/ cem} klga'lnz /x]sf] ;+s]t ub{5 . ;ftfsf] cGTodfcf/P;cfO{ ^&=%$ /x]sf] lyof] . u_ af]lnªu/ Aof08 af]lnªu/ Aof08 Ps k|fljlwsljZn]if0f ;"rsxf] h;df @!–lbg] d'leËPe/]hsf ;fyb'O{ Aof08 -Pp6f dfly_ / Pp6f tn_ x'G5g . lo Aof08x?n] cl:y/tfsf] ;+s]t ub{5g, h'g :6fG88{ 8]leP;g u0fgf u/]/ kQfnufO{G5 . g]K;] kl/;"rsuPsf] ;ftfpkNnf] Jof08sf] glhsk'Uguof] h;n] ahf/ cf]e/a6sf] l:yltdf /x]sf] ;+s]t ub{5 . t/ pkNnf] tyftNnf] Aof08 aLrsf] b'/LdfcfPsf] sdLn] ahf/sf] cl:y/tfdf s]xLsdLcfPsf] ;+stub{5 .
- 8. ^_ eNo'd ;'rs -cg–Aofn]G; eNo'd_ cg–Aofn]G; eNo'd n] ahf/dflsGg] tyf a]Rg] k|];/sf] ;+s]t ub{5 . ;d|udf of] ;"rsn] ahf/ dflyuPsf] cj:yftyftnem/]sf] cj:yfdfahf/dfsf/f]af/sf] eNo'd s:tf] /xof] ;+s]t ub{5 .
- 9. xfnsf] cj:yfdfcg–Aofn]G; eNo'ddf g]K;] kl/;"rseGbf a9L cl:yt/tf b]lvof] h;n] g]K;] kl/;"rsnfO{ eNo'dn] w]/} c;/ gkf/]sf] ;+s]t ub{5 . uPsf] ;ftfcf};t sf/f]af/ /sd ?= $#=%$ s/f]8af6 a9L ?= %&=!*s/f]8 /xguof] . ;du{dfM uPsf] ;ftf g]K;] kl/;"rsdf /fd|f] ;'wf/ b]lvof] . kl/;"rs @&=#! cªsn] a9g uO{ !!(^=)@ cªsdf/xof] .xfnsf] cj:yfdf%) lbg] d'leËPe/]h @)) lbg] d'leËPe/]hnfO{ sf6L dfly lxl8/x]sf] cj:yf /x]sf] 5 h;n] ahf/;d|ddfce} klg /fd|} l:yltdf /x]sf] ;+s]t ub{5 . kl/;"rsn] uPsf] ;ftfcfkmgf] gofF /]s8{ !@)%=*$ ;d]t agfpg ;kmnePsf] 5 . cf};tsf/f]af/ /sd ? $#=%$ s/f]8af6a9L ?=%&=!* s/f]8df /xguof] .^&=%$cªsdf /x]sf] cf/P;cfO{n] clxn] ahf/df km]l/ cf]e/ a6 l:ylt /x]sf] ;+s]t ub{5 . pkNnf] tyftNnf] af]lnªu/ Jof08 aLrsf] b'/LdfcfPsf] sdLn]ahf/sf]cl:y/tfdfsdLcfPsf] ;+s]t ub{5 .xfnsf] nflugofF 6]jfcªstyfk|lt/f]w cªs !!&%tyf !@)% /x]sf] 5 .