Nepse technical analysis dec 07 dec 11, 2014 (eng & nep)
•
0 likes•254 views

Technical analysis of Nepal Stock Exchange (Nepse) index for the week from Dec 07, 2014 to Dec 11, 2014. The technical analysis includes summary, RSI, MACD and Bollinger band analysis. The analysis is done by Kriti Capital & Investments Ltd.

Recommended
Recommended
More Related Content
What's hot
What's hot (20)
Similar to Nepse technical analysis dec 07 dec 11, 2014 (eng & nep)
Similar to Nepse technical analysis dec 07 dec 11, 2014 (eng & nep) (17)
More from Kriti Capital & Investments Ltd.
More from Kriti Capital & Investments Ltd. (20)
Recently uploaded
Recently uploaded (20)
Nepse technical analysis dec 07 dec 11, 2014 (eng & nep)
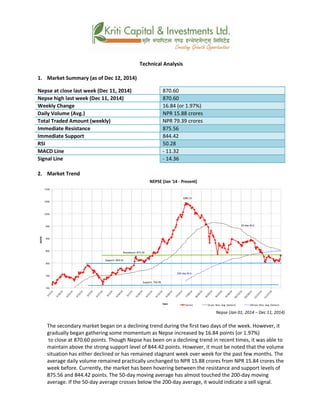
- 1. Technical Analysis 1. Market Summary (as of Dec 12, 2014) Nepse at close last week (Dec 11, 2014) 870.60 Nepse high last week (Dec 11, 2014) 870.60 Weekly Change 16.84 (or 1.97%) Daily Volume (Avg.) NPR 15.88 crores Total Traded Amount (weekly) NPR 79.39 crores Immediate Resistance 875.56 Immediate Support 844.42 RSI 50.28 MACD Line - 11.32 Signal Line - 14.36 2. Market Trend Nepse (Jan 01, 2014 – Dec 11, 2014) The secondary market began on a declining trend during the first two days of the week. However, it gradually began gathering some momentum as Nepse increased by 16.84 points (or 1.97%) to close at 870.60 points. Though Nepse has been on a declining trend in recent times, it was able to maintain above the strong support level of 844.42 points. However, it must be noted that the volume situation has either declined or has remained stagnant week over week for the past few months. The average daily volume remained practically unchanged to NPR 15.88 crores from NPR 15.84 crores the week before. Currently, the market has been hovering between the resistance and support levels of 875.56 and 844.42 points. The 50-day moving average has almost touched the 200-day moving average. If the 50-day average crosses below the 200-day average, it would indicate a sell signal.
- 2. 3. RSI RSI is a form of leading indicator that is believed to be most effective during periods of sideways movement. Such indicators may create numerous buy and sell signals that are useful when the market is not clearly trending upwards or downwards. Though RSI had maintained near or below the oversold zone, it has finally risen towards the center line. By the close of the week, the RSI stood at 50.28 levels suggesting that there is neutral buy and sell pressure in the market. RSI (Jan 02, 2014 –Dec 11, 2014) 4. MACD The MACD is a momentum oscillator formed by using two different types of moving averages, which provides specific buying or selling signals. When a MACD line crosses above the signal line, it is considered to be a positive sign and indicates a time to buy, and vice-versa. Though the MACD and Signal line moved in tandem during the last week, the MACD line has just crossed above the Signal line this week indicating a buy signal. MACD (Jan 02, 2014 – Dec 11, 2014) 5. Bollinger Bands The Bollinger Band is a technical indicator that consists of a moving average (21-day) along with two trading bands above (upper band) and below it (lower band). The bands are an indication of volatility, which are represented by calculating standard deviation. In the Bollinger Bands chart, Nepse can be seen moving horizontally in recent times. During the last few trading days, the Nepse line crossed above the mid-band suggesting a buy signal. The converging upper and lower bands suggest decreasing volatility in the market in recent times.
- 3. Bollinger Bands (Jan 02, 2014 – Dec 11, 2014) Overview: With higher selling in the secondary market during the last two months, the market has followed a downward trend. During the past week, Nepse saw an increased by 16.84 points (or 1.97%) to close at 870.60 points. The market volume has remained relatively stagnant with investors trading only NPR 15.88 crores each day on average. The 50-day moving average is very close to the 200-day moving average. If the 50-day crosses below the 200-day average, it would provide a sell signal. Nepse is trading between its resistance and support levels of 875.56 and 844.42 points. The RSI increased by 13.67 points this week to close at 50.28 levels suggesting a slight increase in buying from investors. The MACD line crossed above the Signal line indicating a buy signal. Similarly, the Bollinger Bands show decreasing volatility in the market in recent times. If the momentum from this past week can be sustained, Nepse should be able to move past its nearest resistance level.
- 4. k|fljlws ljZn]if0f ahf/ ;f/f+z - d+l;/ @! b]vL d+l;/ @% ;Ddsf]_ aGb cªs -d+l;/ @%_ M *&)=^) pRr cªs - d+l;/ @%_ M *&)=^) ;fKtflxs kl/jt{g M !^=*$ cªs -!=(& k|ltzt_ b}lgs cf};t Jofkf/ M ¿= !%=** s/f]8 s'n ;fKtflxs Jofkf/ M ¿= &(=#( s/f]8 tTsflng 6]jf M *&%=%^ tTsflng k|lt/f]w M *$$=$@ cf/P;cfO{ M %)=@* PdP;L8L M –!!=#@ l;Ugn nfO{g M –!$=#^ %) tyf @)) lbg] d'leª Pe/]h ;ftfsf] klxnf] b'O{ sf/f]af/ lbg g]K;] lu/fj6 k|j[ltdf ;'? ePsf] lyof] . t/, o;n] lj:tf/} ult lng yfNof] / g]K;] !^=*$ cªs -jf !=(& k|ltzt_ n] a9]/ *&)=^) cªsdf aGb ePsf] 5 . xfnsf] ;dodf, g]K;] lu/fj6 k|j[ltdf /x]tf klg, *$$=$@ cªsn] g]K;]nfO{ alnof] 6]jf k'¥ofPsf] 5 . t/, ljut s]lx dlxgf b]lv Jofkf/ - ef]No"d_ of lu/fj6 of l:y/ cj:yfdf /x]sf] 5 . cl3Nnf] xKtf, !%=%$ s/f]8 ?k}Fof /x]sf] b}lgs cf}ift Jofkf/ -ef]No"d_ df o; ;ftf klg s'g} vf;} kl/jt{g b]lvPg / of] !%=** s/f]8 ?k}Fof /x]sf] 5 . jt{dfgdf, ahf/ *&%=%^ / *$$=$@ cªssf] s|dzM k|lt/f]w / 6]jf cªs lar sfod /x]sf] 5 . %)–lbg] d'leË Pe/]hn] @))– lbg] d'leË Pe/]hnfO{ nueu 5f]Psf] 5 . olb %)–lbg] d'leË Pe/]hn] @))–lbg] d'leË Pe/]hnfO{ dflyaf6 kf/ u/]df o;n] z]o/ a]Rg] ;+s]t ug]{5 . Nepse (Jan 01, 2014 – December12, 2014)
- 5. l/n]l6j :6«]Gy OG8]S; -cf/P;cfO{_ cf/P;cfO{ k|fljlws ljZn]if0fsf] o:tf] cf}hf/ xf], h;nfO{ Pstlkm{ ?kdf rln/x]sf] ahf/df Jofkf/ /0fgLlt agfpg a9L pkof]uL dflgG5 . To;}u/L, o;n] ahf/df vl/b / ljlqmsf] :ki6 ;+s]t b]vfpg] u5{ . cf]e/;f]N8 If]qsf] 5]p5fp /x]sf] cf/P;cfO{ eg] cGttM s]Gb« /]vf tk{m a9]sf] 5 . xKtfsf] cGTo;Dd, cf/P;cfO{ %)=@* cªsdf /x]sf] lyfof] h;n] ahf/df g t lals| bafa g t vl/b bafa /x]sf] ;+s]t u/]sf] 5 . RSI (Jan 01, 2013 – Dec11, 2014) d'leª Pe/]h sGeh]{G; 8fOeh]{G; -PdP;L8L_ PdP;L8Ldf b'O{ cf]6f /]vf x'G5g, h;df Pp6fn] ahf/sf] lbzf kl/jt{gsf] ;+s]t u5{ eg] csf]{n] ahf/sf] k|j[lQ -6«]08_ b]vfpg] u5{ . olb PdP;L8L /]vfn] l;Ung /]vfnfO{ tnaf6 dfly sf6]df o;nfO{ ;sf/fTds ;+s]tsf ?kdf lnO{G5 / o;n] z]o/x? lsGg] ;+s]t ub{5 . o; ;ftf PdP;L8L / l;Ugn /]vf ;+u;+u} a9]tf klg PdP;L8L /]vfn] l;Ugn /]vfnfO{ d'lgaf6 kf/ u/]sf] 5 h;n] z]o/ vl/bsf] ;+s]t u/]sf] 5 . MACD (Jan 01, 2013 – Dec11, 2014) af]lnªu/ Aof08 af]lnªu/ Aof08 Ps k|fljlws ljZn]if0f ;"rs xf] h;df @!–lbg] d'leË Pe/]hsf ;fy b'O{ Aof08 -Pp6f dfly_ / Pp6f tn_ x'G5g . lo Aof08x?n] cl:y/tfsf] ;+s]t ub{5g, h'g :6fG88{ 8]leP;g u0fgf u/]/ kQf nufO{G5 . o; af]lnªu/ rf6{df g]K;] t];f]{ al9/x]sf] b]Vg ;lsG5 . ljut s]lx sf/f]af/ lbgx?df, g]K;] /]vfn] dWo /]vfnfO{ d'lgaf6 kf/ u/]sf] 5 h;n] z]o/ vl/bsf] ;+s]t u/]sf] 5 . dflyNnf] / tNnf] Aof08 lar 3l6/x]sf] b'/Ln] ahf/df cl:y/tf 3l6/x]sf] ;+s]t u/]sf] 5 .
- 6. Bollinger Bands (Jan 01, 2013 – December 11, 2014) ;du{dfM ljut b'O{ dlxgf b]lv ahf/df b]lvPsf] a9bf] vl/b bafasf sf/0f ahf/ 36g] k|j[ltdf /x]sf] lyof] . o; ;ftf, g]K;] !^=@* cªs -jf !=(& k|ltzt_ n] a9]/ *&)=^) cªsdf aGb ePsf] 5 . ahf/df Jofkf/ -ef]No"d_ eg] lzlyn /x]sf] 5 / cf}iftdf b}lgs !%=** s/f]8 a/fa/sf] sf/f]af/ ePsf] 5 . %)–lbg] d'leË Pe/]h @))–lbg] d'leË Pe/]h glhs /x]sf] 5 . . olb %)–lbg] d'leË Pe/]hn] @))–lbg] d'leË Pe/]hnfO{ dflyaf6 kf/ u/]df o;n] z]o/ a]Rg] ;+s]t ug]{5 . ahf/ *&%=%^ / *$$=$@ cªssf] s|dzM k|lt/f]w / 6]jf cªs lar sfod /x]sf] 5 . cf/P;cfO{ !#=^& cªsn] a9]/ %)=@* cªs k'u]sf] 5 h;n] ahf/df vl/b yf]/} a9]sf] ;+s]t u/]sf] 5 . PdP;L8L /]vfn] l;Ugn /]vfnfO{ d'lgaf6 kf/ u/]sf] 5 h;n] z]o/ vl/bsf] ;+s]t u/]sf] 5 . To;} ul/, af]lnªu/ Aof08n] xfnsf] ;dodf ahf/df cl:y/tf 36]sf] ;+s]t u/]sf] 5 . olb ljut s]lx ;ftfsf] k|j[lt ahf/df sfod /x]g] xf] eg], g]K;] k|lt/f]w cªs kf/ ug{ ;Ifd x'g]5 .