Nepse technical analysis (february 26 march 2, 2017
•
0 likes•358 views

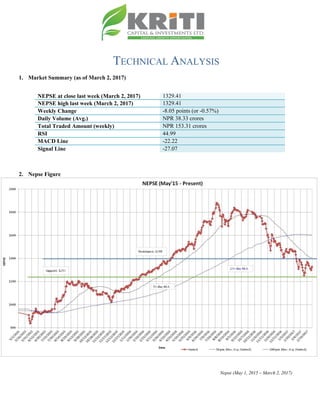
The Nepse index lost 8.05 points (or down 0.57%) to close at 1329.41 last week. Nepse lost 2.87% at the beginning of the week. However, it gained back 2.31% towards the end of the week. The index continues to hover below the 200 day and 50 day moving average. However, the index seems to be getting closer towards the 50 day MA. Crossing above the 50 day MA could signal a possible bullish trigger. The average volume turnover decreased to NPR 38.33 crores from NPR 54.82 crores the week prior.

Recommended
Recommended
More Related Content
What's hot
What's hot (8)
Similar to Nepse technical analysis (february 26 march 2, 2017
Similar to Nepse technical analysis (february 26 march 2, 2017 (20)
More from Kriti Capital & Investments Ltd.
More from Kriti Capital & Investments Ltd. (18)
Recently uploaded
Recently uploaded (20)
Nepse technical analysis (february 26 march 2, 2017
- 1. TECHNICAL ANALYSIS 1. Market Summary (as of March 2, 2017) NEPSE at close last week (March 2, 2017) 1329.41 NEPSE high last week (March 2, 2017) 1329.41 Weekly Change -8.05 points (or -0.57%) Daily Volume (Avg.) NPR 38.33 crores Total Traded Amount (weekly) NPR 153.31 crores RSI 44.99 MACD Line -22.22 Signal Line -27.07 2. Nepse Figure Nepse (May 1, 2015 – March 2, 2017)
- 2. 3. Trend Analysis The Nepse index lost 8.05 points (or down 0.57%) to close at 1329.41 last week. Nepse lost 2.87% at the beginning of the week. However, it gained back 2.31% towards the end of the week. The index continues to hover below the 200 day and 50 day moving average. However, the index seems to be getting closer towards the 50 day MA. Crossing above the 50 day MA could signal a possible bullish trigger. The average volume turnover decreased to NPR 38.33 crores from NPR 54.82 crores the week prior. 4. Resistance and Support Immediate Support 1250 Support 2 1206 Immediate Resistance 1388 Resistance 2 1480 The Nepse index continues to hover around the early 1300’s level. The index entered the 1200 territory by closing at 1299.29 on Tuesday of last week. The market seems to give no clear indication regarding its movement. The current immediate support and resistance level stands the same at 1250 and 1388 respectively. 5. Trend Indicator a.) MACD The MACD is a momentum oscillator formed by using two different types of moving averages, which provides specific buying or selling signals. When a MACD line crosses above the signal line, it is considered to be a positive sign and indicates a time to buy, and vice-versa. The Macd and the signal line, at the beginning of last week, stood at -23.53 and -30.49 respectively. In the course of the week, the macd and signal line gained 1.32 and 3.42 points to close at -22.22 and -27.07 respectively. Both the lines continue to hover in the negative territory, giving a bearish sign.
- 3. b.) RSI RSI is a form of leading indicator that is believed to be most effective during periods of sideways movement. Such indicators may create numerous buy and sell signals that are useful when the market is not clearly trending upwards or downwards. The RSI, at the beginning of last week, stood at 40.04 level. In the course of the week, it gained 4.96 points to close at 44.99 level. The RSI indicator shows a gradual decrease in selling pressure in the market. c.) Bollinger Bands The Bollinger Band is a technical indicator that consists of a moving average (21-day) along with two trading bands above (upper band) and below it (lower band). The bands are an indication of volatility, which are represented by calculating standard deviation.
- 4. The benchmark index declined but climbed back up towards the mid bollinger band last week, indicating that the market has come out of the oversold zone. The distance between the upper and lower band has converged as well, signifying a decrease in market volatility. 6. Overview The Nepse index decreased by 8.05 points (or down 0.57%) to close at 1329.41 last week. As seen in the previous week, there seems to be no clear bullish indication is present in the market. The index is moving below the 50 and 200 day moving average. The macd line moving above the signal line shows short term bullish trigger. However, both the lines continue to hover in the negative territory. The RSI has moved away from the selling pressure as well, closing at 44.99 level. The bollinger bands show signs of a decrease in market volatility. The support and resistance level stands the same at 1250 and 1388 respectively.
- 5. k|fljlws ljZn]if0f !_ ahf/ ;f/f+z -kmfu'g !(, @)&# ;Ddsf]_ aGb cªs -kmfu'g !(, @)&#_ !#@(=$! pRr cªs -uPsf] ;ftf_ !#@(=$! ;fKtflxs kl/jt{g –*=)% b}lgs cf};t Jofkf/ ¿=#*=## s/f]8 s'n ;fKtflxs Jofkf/ ¿ !%#=#! s/f]8 cf/P;cfO{ $$=(( PdP;L8L –@@=@@ l;Ugn nfO{g –@&=)& @_ ahf/ k|j[lt Nepse (May 1, 2015 –March 2nd, 2017)
- 6. #_ 6]«G8 ljZn]if0f uPsf] ;ftf g]K;] kl/;"rsdf *=)% cªssf] lu/fj6 b]lvof] h;sf] kmn:j?k ahf/ !#@(=$! cªsdf aGb eof] . /fhgLlts If]qdf b]lvPsf] ptf/ r9fj tyf a}+ls+u If]qdf b]lvPsf] pRr Jofhb/n] ahf/ cem} laol/; l:yltdf /x]sf] b]lvG5 . clxn] klg g]K;] kl/;"rs @)) lbg] tyf %) lbg] d'leË Pe/]h eGbf tn g} /x]sf] cj:yf 5 . t/ %) lbg] d'leË Pe/]h glhs k'u]sf] kl/;"rs kf/ u/]df ahf/ s]xL a9g ;+s]t eg] ldn]sf] 5 . uPsf] ;ftf cf};t sf/f]af/ /sd ;d]t 36]/ #*=## s/f]8df cfPsf] cj:yf /xof] . $_ 6]jf tyf k|lt/f]w cªs glhssf] 6]jf cªs !@%) 6]jfcªs @ !@)^ glhssf] k|lt/f]w cªs !#** g]K;] kl/;"rs xfn !#)) cªssf] xf/fxf/Ldf rln/x]sf] cj:yf /xof] . clxn] klg !@%) cªs gofF 6]jf cªs tyf !#** cªs gofF k|lt/f]w cªssf] ?kdf /x]sf] 5 . s]xL ;dosf] nflu ahf/ !#)) cªssf] xf/fxf/Ld rNg] b]lvG5 . %_ g]K;] 6]«G8 ;"rs s_ d'leª Pe/]h sGeh]{G; 8fOeh]{G; -PdP;L8L_ PdP;L8Ldf b'O{ cf]6f /]vf x'G5g, h;df Pp6fn] ahf/sf] lbzf kl/jt{gsf] ;+s]t u5{ eg] csf]{n] ahf/sf] k|j[lQ -6«]08_ b]vfpg] u5{ . olb PdP;L8L /]vfn] l;Ung /]vfnfO{ tnaf6 dfly sf6]dfo;nfO{ ;sf/fTds ;+s]tsf ?kdflnO{G5 / o;n] z]o/x? lsGg] ;+s]t ub{5 . ;ftfsf] z'?df PdP;L8L nfO{g tyf l;Ugn nfO{g s|dzM –@#=%# tyf –#)=$( sf] l:yltdf /x]sf] lyof] / ;ftfsf] cGTodf PdP;L8L nfO{g tyf l;Ugn nfO{g s|dzM –@@=@@ tyf–@&=)& sf] l:yltdf /x]sf] lyof] . xfnsf] cj:yfdf PdP;L8L nfO{g tyf l;Ugn nfO{g b'j} C0ffTds If]qdf /x]sf] x'Fbf ahf/ clxn] klg laol/; l:yltdf /x]sf] b]lvG5 .
- 7. v_ l/n]l6j :6«]Gy OG8]S; -cf/P;cfO{_ cf/P;cfO{ k|fljlws ljZn]if0fsf] o:tf] cf}hf/ xf], h;nfO{ Pstlkm{ ?kdf rln/x]sf] ahf/df Jofkf/ /0fgLlt agfpg a9L pkof]uL dflgG5 . To;}u/L, o;n] ahf/df vl/b / ljlqmsf] :ki6 ;+s]t b]vfpg] u5{ . cf/P;cfO{ uPsf] ;ftfsf] z'?df $)=)$ cªsdf /x]sf] lyof] tyf ;ftfsf] cGTo lt/ cf/P;cfO{ $$=(( cªsdf /xof] . xfnsf] cj:yfdf cf/P;cfO{n] ahf/ a]Rg] xf]8afhLaf6 aflx/ lg:sg ;Sg] l:ylt b]vfPsf] 5 .
- 8. u_ af]lnªu/ Aof08 af]lnªu/ Aof08 Ps k|fljlws ljZn]if0f ;"rs xf] h;df @!–lbg] d'leË Pe/]hsf ;fy b'O{ Aof08 -Pp6f dfly_ / Pp6f tn_ x'G5g . lo Aof08x?n] cl:y/tfsf] ;+s]t ub{5g, h'g :6fG88{ 8]leP;g u0fgf u/]/ kQf nufO{G5 . uPsf] ;ftf g]K;] kl/;"rs dWo Jof08 glhs cfPsf] cj:yfn] ahf/df a]Rg] xf]8afhLdf sdL cfPsf] b]lvG5 . ;fy} pkNnf] tyf tNnf] Jof08 aLrsf] b'/Ldf ;d]t cfPsf] sdLn] ahf/sf] cl:y/tfdf s]xL sdL cfPsf] b]lvG5 . ;du{dfM uPsf] ;ftf g]K;] kl/;"rsdf *=)% cªssf] lu/fj6sf] kmn:j?k ahf/ !#@(=$! cªsdf aGb eof] . g]K;] kl/;"rs clxn] klg @)) lbg] d'leË Pe/]h eGbf tn /x]sf] cj:yfn] ;du{df ahf/ clxn] klg laol/; l:yltd} /x]sf] 5 . t/ PdP;L8L nfO{g l;Ugn nfO{g nfO{ sf6L dfly cfPsf] cj:yfn] eg] ahf/df laol/; l:ylt cfpg ;Sg] ;+s]t b]lvPsf] 5 . $$=(( cªssf] l:yltdf cfPsf] cf/P;cfO{n] ahf/ cf]e/ ;f]N8 l:yltaf6 aflx/ lg:sb} u/]sf] ;+s]t ub{5 . pkNnf] tyf tNnf] Jof08 aLrsf] b'/Ldf s]xL sdL cfPsf]n] ahf/sf] cl:yt/tfdf s]xL sdL cfPsf] b]lvG5 . xfnsf] cj:yfdf gofF 6]jf cªs tyf k|lt/f]w cªs s||dzM !@%) tyf !#** g} sfod /x]sf] 5 .