Nepse Technical Analysis June 19 - June 23, 2016
•
0 likes•168 views

Nepse Weekly Technical Analysis June 19 - June 23, 2016

Recommended
Recommended
More Related Content
What's hot
What's hot (20)
Viewers also liked
Viewers also liked (13)
Similar to Nepse Technical Analysis June 19 - June 23, 2016
Similar to Nepse Technical Analysis June 19 - June 23, 2016 (10)
More from Kriti Capital & Investments Ltd.
More from Kriti Capital & Investments Ltd. (12)
Recently uploaded
Recently uploaded (20)
Nepse Technical Analysis June 19 - June 23, 2016
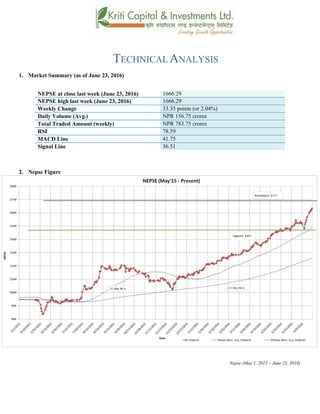
- 1. TECHNICAL ANALYSIS 1. Market Summary (as of June 23, 2016) NEPSE at close last week (June 23, 2016) 1666.29 NEPSE high last week (June 23, 2016) 1666.29 Weekly Change 33.35 points (or 2.04%) Daily Volume (Avg.) NPR 156.75 crores Total Traded Amount (weekly) NPR 783.75 crores RSI 78.59 MACD Line 41.75 Signal Line 36.51 2. Nepse Figure Nepse (May 1, 2015 – June 23, 2016)
- 2. 3. Trend Analysis The Nepse index gained a decent 33.35 points (or up 2.04%) to close at 1663.29 last week. The index corrected itself on Sunday and Monday of last week by losing 17.84 points. However, it climbed back up for the rest of the week to reach an all time height. High turnover continues to support the bullish trend in Nepse. The index continues to run above the 50 days moving average, as well as the 200 days moving average, indicating that the long term trend looks positive. 4. Resistance and Support Immediate Support 1483 Support 2 1463 Immediate Resistance 1700 Resistance 2 The Nepse index reached an all time height of 1666.29 last week. The technical indicators continue to show presence of bullish momentum in the market. The immediate support and resistance level remains the same at 1463 and 1700 respectively. It seems that the current bullish presence could drive the market to break the resistance of 1700 in the coming week. 5. Trend Indicator a.) MACD The MACD is a momentum oscillator formed by using two different types of moving averages, which provides specific buying or selling signals. When a MACD line crosses above the signal line, it is considered to be a positive sign and indicates a time to buy, and vice-versa. The Macd and the signal line, at the beginning of last week, stood at 38.60 and 31.69 respectively. The macd indicator indicates bullish momentum as the macd line is moving above the signal line. Towards the end of the week, the macd and the signal line ended at 41.75 and 36.51 respectively.
- 3. b.) RSI RSI is a form of leading indicator that is believed to be most effective during periods of sideways movement. Such indicators may create numerous buy and sell signals that are useful when the market is not clearly trending upwards or downwards. The RSI at the beginning of last week stood at 74.14 points. The RSI hovered above the 70’s zone throughout the week, signifying an over-bought condition in the market. At the end of the week, it closed at 78.59 level. The RSI indicator also indicates a strong bullish trigger in the market. c.) Bollinger Bands The Bollinger Band is a technical indicator that consists of a moving average (21-day) along with two trading bands above (upper band) and below it (lower band). The bands are an indication of volatility, which are represented by calculating standard deviation. The benchmark index is hovering close to the upper bollinger band, indicating high buying pressure in the market. The upper and lower bands continue to diverge, showing an increase in market volatility.
- 4. 6. Volume Indicator (On-Balance Volume) On-Balance Volume (OBV) is a momentum indicator that relates volume to the current price of the index or security. It measures buying and selling pressure at the market. It acts as a cumulative indicator that adds volume on up days and subtracts volume on down days. If a price increase is supported by OBV, it confirms an uptrend, whereas if a price decrease is supported by OBV, it confirms a downtrend. The On-Balance Volume (OBV) followed the Nepse index movement, as both of them declined at the beginning of last week. However, the OBV and the Nepse index climbed back up for the remaining of the week. The average weekly volume transactions declined to NPR 156.75 crores from NPR 186.68 crores the week prior. The turnover volume also supports the bullish rise in Nepse. 7. Overview The Nepse index gained 33.35 points (or up 2.04%) to close at 1666.29 last week. Nepse corrected itself at the beginning of the week by losing 17.84 points. The index is still running above the 50-day and 200-day moving averages, indicating that the overall market condition looks good. The macd line is moving above the signal line, indicating a bullish presence. The RSI ended at 78.59 level, signifying buying presence in the market. The Bollinger bands have diverged, signifying an increase in market volatility. The new support and resistance level stands at 1483 and 1700 respectively.
- 5. k|fljlwsljZn]if0f !_ahf/ ;f/f+z -cfiff9 (, @)&#;Ddsf]_ aGb cªs -cfiff9 (, @)&#_ !^^^=@( pRr cªs -uPsf] ;ftf_ !^^^=@( ;fKtflxs kl/jt{g ##=#% -@=)$k|ltzt_ b}lgscf};t Jofkf/ ¿=!%^=&%s/f]8 s'n ;fKtflxsJofkf/ ¿ &*#=&% s/f]8 cf/P;cfO{ &*=%( PdP;L8L $!=&% l;UgnnfO{g #^=%! @_ ahf/ k|j[lt Nepse (Jan 1, 2015 – June 23, 2016)
- 6. #_ 6]«G8 ljZn]if0f uPsf] ;ftfg]K;] kl/;"rsdf##=#%cªssf] a[l4 b]lvof]h;sf] kmn:j?kahf/ !^^#=@( cªsdfaGbeof] . ;du|dfclxn] klg kl/;"rs %) lbg] d'leËPe/]h tyf @)) lbg] d'leËeGbfdfly g} rln/x]sf] cj:yf ;du|dfahf/sf] l:ylt /fd|f] b]lvG5 . ;ftfsf] s]xLlbgdftnem/]sf] ahf/ km]l/ dfly g} r8]sf] cj:yf /xof] . $_ 6]jftyfk|lt/f]w cªs glhssf] 6]jfcªs !$*# 6]jfcªs @ !$^# glhssf] k|lt/f]w cªs !&)) uPsf] ;ftf g]K;] kl/;"rsn]cfkmgf] Oltxf; s} pRrcªs !^^^=@( nfO{ kf/ u/]sf] cj:yf /xof] . xfnsf] cj:yfdfahf/n] rfF8} g} !&)) cªsnfO{ ;d]t kf/ ug]{ ;+s]t b]lvG5 t/ ;f] aLrdfahf/df s]xL s/]S;g b]vg ;Sg] ;+Defjgfsfod g} 5 .xfnsf] cj:yfdfglhssf] 6]jfcªstyfglhssf] k|lt/f]w cªss|dz M !$*# tyf !&)) g} /x]sf] 5 . %_ g]K;] 6]«G8 ;"rs s_ d'leª Pe/]hsGeh]{G; 8fOeh]{G; -PdP;L8L_ PdP;L8Ldf b'O{ cf]6f /]vf x'G5g, h;df Pp6fn] ahf/sf] lbzf kl/jt{gsf] ;+s]t u5{ eg] csf]{n] ahf/sf] k|j[lQ -6«]08_ b]vfpg] u5{ . olb PdP;L8L /]vfn] l;Ung /]vfnfO{ tnaf6 dfly sf6]dfo;nfO{ ;sf/fTds ;+s]tsf ?kdflnO{G5 / o;n] z]o/x? lsGg] ;+s]t ub{5 . uPsf] ;ftfsf] z'?df PdP;L8L nfO{gtyfl;UgnnfO{g s|dzM#*=^)tyf#!=^(sf] l:yltdf /x]sf] lyof]/ ;ftfsf] cGTodf PdP;L8L nfO{g tyfl;UgnnfO{g s|dzM$!=&%tyf#^=%! /x]sf]] 5 . l;UgnnfO{g eGbfdflyrln/x]sf] PdP;L8L nfO{gn] ahf/sf] a'lnz 6]«G8df /x]sf] ;+s]t ub{5 .
- 7. v_ l/n]l6j :6«]Gy OG8]S; -cf/P;cfO{_ cf/P;cfO{ k|fljlwsljZn]if0fsf] o:tf] cf}hf/ xf], h;nfO{ Pstlkm{ ?kdfrln/x]sf] ahf/dfJofkf/ /0fgLlt agfpg a9L pkof]uL dflgG5 . To;}u/L, o;n] ahf/dfvl/b / ljlqmsf] :ki6 ;+s]t b]vfpg] u5{ . cf/P;cfO{uPsf] ;ftfsf] z'?df&$=!$cªsdf/x]sf] lyof] .cf/P;cfO{ &) cªseGbfdflyhfg'n] ahf/ cf]e/a6 l:yltdf /x]sf] 5 . ;ftfsf] cGTodf&*=%(cªsdf /x]sf] cf/P;cfO{ ahf/dflsGg] xf]8afhL lgs} g} /x]sf] ;+s]t lbG5 . u_ af]lnªu/ Aof08 af]lnªu/ Aof08 Ps k|fljlwsljZn]if0f ;"rsxf] h;df @!–lbg] d'leËPe/]hsf ;fyb'O{ Aof08 -Pp6f dfly_ / Pp6f tn_ x'G5g . lo Aof08x?n] cl:y/tfsf] ;+s]t ub{5g, h'g :6fG88{ 8]leP;g u0fgf u/]/ kQfnufO{G5 . g]K;] kl/;"rsuPsf] ;ftfsf] km]l/ pkNnf] Aof08 glhsk'u]sf] cj:yfn] ahf/dflsGg] xf]8afhL lgs} g} /x]sf] ;+s]t ub{5 . ;fy} pkNnf] tyftNnf] Jof08 aLrsf] b'/L a9gfn] ;d]t ahf/sf] cl:yt/tfdfcem} a[l4 ePsf] ;+s]t ub{5 .
- 8. ;du{dfM uPsf] ;ftf g]K;] kl/;"rsdf##=#%cªssf] a[l4 b]lvof]h;sf] kmn:j?kahf/ !^^^=@(cªsdfaGbeof] . clxn] klg kl/;"rs %) lbg] d'leËPe/]h tyf @)) lbg] d'leËeGbfdflyuO{/x]sf] cj:yfn] ahf/ ;sf/fTds l:yltdf g} /x]sf] ;+s]t ub{5 . PdP;L8L nfO{g l;UgnnfO{g eGbfdflycfPsf] cj:yfn] ahf/ a'lnz 6]«G8df /x]sf] ;+s]t ub{5 . &) cªseGbfdfly /x]sf] cf/P;cfO{n] klgahf/ cf]e/ a6 l:yltdf /x]sf] ;+s]t ub{5 .;fy} pkNnf] tyftNnf] Jof08 aLrsf] b'/LdfcfPsf] a[l4n] ahf/sf] cl:y/tfeg] lgs} g} a9]sf] ;+s]t ub{5 .xfnsf] cj:yfdfgofF 6]jfcªstyfk|lt/f]w cªs s||dzM !$*# tyf !&)) g} sfod /x]sf] 5 .