Nepse Technical Analysis 21 August - 25 August, 2016
•
0 likes•172 views

Nepse Weekly Technical Analysis 21 August - 25 August, 2016

Recommended
Recommended
More Related Content
What's hot
What's hot (20)
Similar to Nepse Technical Analysis 21 August - 25 August, 2016
Similar to Nepse Technical Analysis 21 August - 25 August, 2016 (17)
More from Kriti Capital & Investments Ltd.
More from Kriti Capital & Investments Ltd. (8)
Recently uploaded
Recently uploaded (20)
Nepse Technical Analysis 21 August - 25 August, 2016
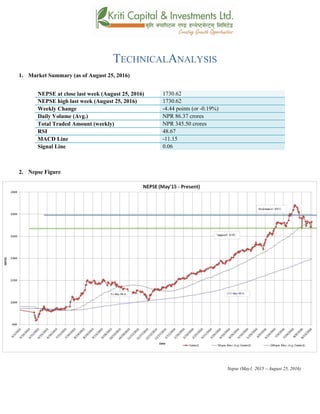
- 1. TECHNICALANALYSIS 1. Market Summary (as of August 25, 2016) NEPSE at close last week (August 25, 2016) 1730.62 NEPSE high last week (August 25, 2016) 1730.62 Weekly Change -4.44 points (or -0.19%) Daily Volume (Avg.) NPR 86.37 crores Total Traded Amount (weekly) NPR 345.50 crores RSI 48.67 MACD Line -11.15 Signal Line 0.06 2. Nepse Figure Nepse (May1, 2015 – August 25, 2016)
- 2. 3. Trend Analysis The Nepse index lost 4.44 points (or down -0.19%) to close at 1730.62 last week. The index declined by 53.2 points for most of the week. However, the market recovered 48.76 points on the last trading day, signifying presence of bullish sentiment in the market. The index is hovering around 50 day moving average, which shows that there is nervousness present in the market. However, Nepse continues to move well above the 200 day moving average, indicating the long term market outlook looks good. 4. Resistance and Support Immediate Support 1680 Support 2 1600 Immediate Resistance 1800 Resistance 2 The Nepse index broke the support level of 1723 again and remained below it for most of the week. However, the index climbed back up and above 1723 by the end of the week. The current support and resistance level stands at 1680 and 1800 respectively. The index continued to experience high volatility the past week as well. 5. Trend Indicator a.) MACD The MACD is a momentum oscillator formed by using two different types of moving averages, which provides specific buying or selling signals. When a MACD line crosses above the signal line, it is considered to be a positive sign and indicates a time to buy, and vice-versa. The Macd and the signal line, at the beginning of last week, stood at -3.62 and 10.40 respectively. Both the lines continued to decline and diverged in the course of the week, where the macd line continues to move below the signal line. The macd indicator still shows presence of bearish sentiment in the market. Towards the end of the week, the macd and the signal line ended at -11.15 and 0.06 respectively. b.) RSI RSI is a form of leading indicator that is believed to be most effective during periods of sideways movement. Such indicators may create numerous buy and sell signals that are useful when the market is not clearly trending upwards or downwards.
- 3. The RSI, at the beginning of last week, stood at 45.80 points. In the course of the week, it gained 2.87 points to close at 47.53 level. The RSI remaining in the 40’s zone show that the market has come out of the over-bought zone, and could move sideways. c.) Bollinger Bands The Bollinger Band is a technical indicator that consists of a moving average (21-day) along with two trading bands above (upper band) and below it (lower band). The bands are an indication of volatility, which are represented by calculating standard deviation. The benchmark index is hovering between the lower and middle bollinger band, which shows that the market has moved out of over-bought condition. The market volatility remains high as the distance between the upper and lower bands remain wide.
- 4. 6. Overview The Nepse index lost 4.44 points (or down 0.19%) to close at 1730.62 last week. Nepse is hovering around the 50 day moving average, which shows short term nervousness in the market. However, the index is moving well above the 200 day moving average, indicating the long term market outlook looks good. The macd indicator still show bearish sign as the macd line is in the negative territory, and moving below the signal line. The RSI is hovering in the 40’s zone, indicating that the market has come out of the buying pressure. The bollinger bands continue to show high volatility as well. The new support and resistance level now stands at 1680 and 1800 respectively.
- 5. k|fljlwsljZn]if0f !_ahf/ ;f/f+z -ebf}(, @)&#;Ddsf]_ aGb cªs -ebf}(, @)&#_ !&#)=^@ pRr cªs -uPsf] ;ftf_ !&#)=^@ ;fKtflxs kl/jt{g –$=$$ -–)=!(k|ltzt_ b}lgscf};t Jofkf/ ¿=*^=#&s/f]8 s'n ;fKtflxsJofkf/ ¿ #$%=%) s/f]8 cf/P;cfO{ $*=^& PdP;L8L –!!=!% l;UgnnfO{g )=)^ @_ ahf/ k|j[lt Nepse (May1, 2015 – August 25, 2016)
- 6. #_ 6]«G8 ljZn]if0f uPsf] ;ftfg]K;] kl/;"rsdf$=$$cªssf] lu/fj6 b]lvof]h;sf] kmn:j?kahf/ !,&#)=^@cªsdfaGbeof] . ;ftfsf] w]/} h;f] lbg 36]sf] ahf/ ;ftfsf] clGtdlbg $*=&^ cªs a9]sf] cj:yf /xof] h;n] ahf/df km]l/ s]xLlx;fan] a'lnz l:yltdf b]lvG5 . t/ ;du|dfclxn] klg kl/;"rs %) lbg] d'leËPe/]h tyf @)) lbg] d'leËeGbfdfly g} rln/x]sf] cj:yfn] ;du|dfahf/sf] l:ylt /fd|f] b]lvG5 . xfnsf] cj:yfdf %) lbg] d'leËPe/]h Pp6f alnof] 6]jfcªssf] ?kdf b]lvPsf] 5 . $_ 6]jftyfk|lt/f]w cªs glhssf] 6]jfcªs !^*) 6]jfcªs @ !^)) glhssf] k|lt/f]w cªs !*)) uPsf] ;ftf g]K;] kl/;"rscfkmgf] glhssf] 6]jfcªs!&@#eGbftnuPsf] cj:yf /xof] . t/ ;f] 6]jfcªsnfO{ g]K;]n] t'?Gtk|fKt u/]sf] cj:yf /xof] . uPsf] ;ftf g]K;] kl/;"rsdflgs} g} cl:yt/tf b]lvof] . xfnsf] nflugofF 6]jfcªstyfk|lt/f]w cªss|dzM !^*) tyf !*)) /x]sf] 5 . %_ g]K;] 6]«G8 ;"rs s_ d'leª Pe/]hsGeh]{G; 8fOeh]{G; -PdP;L8L_ PdP;L8Ldf b'O{ cf]6f /]vf x'G5g, h;df Pp6fn] ahf/sf] lbzf kl/jt{gsf] ;+s]t u5{ eg] csf]{n] ahf/sf] k|j[lQ -6«]08_ b]vfpg] u5{ . olb PdP;L8L /]vfn] l;Ung /]vfnfO{ tnaf6 dfly sf6]dfo;nfO{ ;sf/fTds ;+s]tsf ?kdflnO{G5 / o;n] z]o/x? lsGg] ;+s]t ub{5 . uPsf] ;ftfsf] z'?df PdP;L8L nfO{gtyfl;UgnnfO{g s|dzM–#=^@tyf!)=$!sf] l:yltdf /x]sf] lyof] . t/ ;ftfsf] afFsLlbgx?df PdP;L8L nfO{g l;UgnnfO{g eGbftn g} /x]sf] cj:yf /x]sf] 5 h;n] xfnahf/ a'lnz 6]«G8df /x]sf] ;+s]t ub{5 / ;ftfsf] lu/fj6 ;Fu} PdP;L8L nfO{g C0ffTds If]qdfk|j]z u/]sf] 5 . ;ftfsf] cGTodf PdP;L8L nfO{g tyfl;UgnnfO{g s|dzM–!!=!%tyf)=)^sf] l:yltdf /x]sf] lyof] .
- 7. v_ l/n]l6j :6«]Gy OG8]S; -cf/P;cfO{_ cf/P;cfO{ k|fljlwsljZn]if0fsf] o:tf] cf}hf/ xf], h;nfO{ Pstlkm{ ?kdfrln/x]sf] ahf/dfJofkf/ /0fgLlt agfpg a9L pkof]uL dflgG5 . To;}u/L, o;n] ahf/dfvl/b / ljlqmsf] :ki6 ;+s]t b]vfpg] u5{ . cf/P;cfO{uPsf] ;ftfsf] z'?df$%=*)cªsdf/x]sf] lyof]tyf ;ftfsf] cGTolt/ cf/P;cfO{ $&=%#cªsdf /xof].h;n] ahf/dfa]Rg]xf]8afhLsf] ;+s]t ub{5 . &) cªseGbflgs} tnem/]sf]] cf/P;cfO{ clxn] ahf/df a]Rg] xf]8afhL a9]sf] ;+s]t ub{5 . u_ af]lnªu/ Aof08 af]lnªu/ Aof08 Ps k|fljlwsljZn]if0f ;"rsxf] h;df @!–lbg] d'leËPe/]hsf ;fyb'O{ Aof08 -Pp6f dfly_ / Pp6f tn_ x'G5g . lo Aof08x?n] cl:y/tfsf] ;+s]t ub{5g, h'g :6fG88{ 8]leP;g u0fgf u/]/ kQfnufO{G5 .
- 8. g]K;] kl/;"rsuPsf] ;ftfpkNnf] Jof08eGbf k/ uPsf] cj:yfn] ahf/ cf]e/ a6 l:ylt af6 aflx/ cfPsf] ;+s]t ub{5 . pkNnf] tyftNnf] Jof08 aLrsf] b'/LdfcfPsf] a[l4n]cl:yt/tfeg] a9]sf] ;+s]t ub{5 . ;du{dfM uPsf] ;ftf g]K;] kl/;"rsdf$=$$cªssf] lu/fj6 b]lvof]h;sf] kmn:j?kahf/ !&#)=^@cªsdfaGbeof] . clxn] klg kl/;"rs %) lbg] d'leËPe/]h tyf @)) lbg] d'leËeGbfdflyuO{/x]sf] cj:yfn] ahf/ ;sf/fTds l:yltdf g} /x]sf] ;+s]t ub{5 . PdP;L8L nfO{gl;UgnnfO{g eGbftncfPsf]cj:yfn] ahf/dflsGg] xf]8afhLdf sdLcfPsf] b]lvG5 . &) cªseGbflgs} tnem/]sf]] cf/P;cfO{n] ahf/ cf]e/ a6 l:yltaflx/ cfPsf] ;+s]t ub{5 . pkNnf] tyftNnf] Jof08 aLrsf] b'/Ldfb]lvPsf] a[l4n] ahf/sf] cl:y/tfdfeg]a[l4 ePsf] ;+s]t ub{5 .xfnsf] cj:yfdfgofF 6]jfcªstyfk|lt/f]w cªs s||dzM !^*) tyf !*)) g} sfod /x]sf] 5 . ;du|df x]bf{ ahf/ laol/; l:yltdf /x]sf] ;+s]t ub{5 .