Nepse Technical Analysis September 11 - September 15, 2016
•Download as DOCX, PDF•
0 likes•307 views

Nepse Weekly Technical Analysis September 11 - September 15, 2016

Recommended
Recommended
More Related Content
What's hot
What's hot (20)
Viewers also liked
Viewers also liked (12)
Similar to Nepse Technical Analysis September 11 - September 15, 2016
Similar to Nepse Technical Analysis September 11 - September 15, 2016 (13)
More from Kriti Capital & Investments Ltd.
More from Kriti Capital & Investments Ltd. (7)
Recently uploaded
Recently uploaded (20)
Nepse Technical Analysis September 11 - September 15, 2016
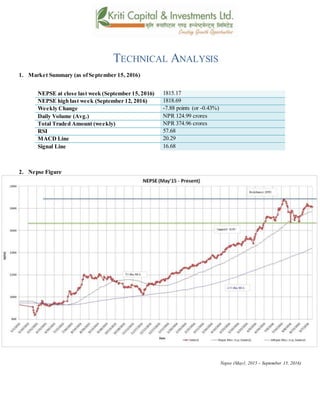
- 1. TECHNICAL ANALYSIS 1. Market Summary (as ofSeptember 15, 2016) NEPSE at close last week (September 15,2016) 1815.17 NEPSE high last week (September 12, 2016) 1818.69 Weekly Change -7.88 points (or -0.43%) Daily Volume (Avg.) NPR 124.99 crores Total Traded Amount (weekly) NPR 374.96 crores RSI 57.68 MACD Line 20.29 Signal Line 16.68 2. Nepse Figure Nepse (May1, 2015 – September 15, 2016)
- 2. 3. Trend Analysis The Nepse index lost 7.88 points (or down 0.43%) to close at 1815.17 last week. The index corrected itself by 9.76 points and moved sideways in the course of last week. The average volume turnover last week was 124.99 crores as compared to 170.75 crores the week prior. The index continues to move above the 50 day and 200 day moving average, signifying positive outlook of the market. 4. Resistance and Support Immediate Support 1680 Support 2 1600 Immediate Resistance 1880 Resistance 2 The Nepse index moved sideways and hovered around the early 1800’s level again last week. The support and resistance level stands the same at 1680 and 1880 respectively. 5. Trend Indicator a.) MACD The MACD is a momentum oscillator formed by using two different types of moving averages, which provides specific buying or selling signals. When a MACD line crosses above the signal line, it is considered to be a positive sign and indicates a time to buy, and vice-versa. The Macd and the signal line, at the beginning of last week, stood at 21.19 and 14.48 respectively. In the course of the week, the macd line declined by 0.90 points, where as the signal line climbed up by 2.20 points. At the end of the week, the macd and the signal line ended at 20.29 and 16.68 level respectively. If the macd line moves below the signal line, it could indicate a slowdown in the bullish presence in the market. b.) RSI RSI is a form of leading indicator that is believed to be most effective during periods of sideways movement. Such indicators may create numerous buy and sell signals that are useful when the market is not clearly trending upwards or downwards.
- 3. The RSI, at the beginning of last week, stood at 58.29 points. In the course of the week, it lost a minute 0.61 points to close at 57.68 level. In the current situation, the RSI shows a neutral stance as it is moving sideways, along with the Nepse index. c.) Bollinger Bands The Bollinger Band is a technical indicator that consists of a moving average (21-day) along with two trading bands above (upper band) and below it (lower band). The bands are an indication of volatility, which are represented by calculating standard deviation. The benchmark index is hovering between the upper and middle bollinger bands. The index has deviated from the upper band, indicating a decrease in the buying pressure in the market. The distance between the upper and lower bands has diverged slightly, indicating a moderate increase in market volatility.
- 4. 6. Overview The Nepse index fell by 7.88 points (or down 0.43%) to close at 1815.17 last week. Nepse is moving above the 200-day, as well as 50-day moving average, signifying long-term positive outlook of the market. The macd indicator show a decline in bullish presence in the market as the macd line show signs of moving below the signal line. The RSI is moving sideways and closed at 57.68 level. The bollinger bands show a moderate increase in market volatility as the upper and lower bands have diverged slightly. The support and resistance level stands the same at 1680 and 1880 respectively.
- 5. k|fljlwsljZn]if0f !_ahf/ ;f/f+z -ebf}#), @)&#;Ddsf]_ aGb cªs -ebf}#), @)&#_ !*!%=!& pRr cªs -uPsf] ;ftf_ !*!*=^( ;fKtflxs kl/jt{g – &=** -–)=$#k|ltzt_ b}lgscf};tJofkf/ ¿=!@$=((s/f]8 s'n ;fKtflxsJofkf/ ¿ #&$=(^ s/f]8 cf/P;cfO{ %&=^* PdP;L8L @)=@( l;UgnnfO{g !^=^* @_ ahf/ k|j[lt
- 6. Nepse (May1, 2015 – September 15, 2016) #_ 6]«G8 ljZn]if0f uPsf] ;ftfg]K;] kl/;"rsdf&=**cªssf] ;fdfGolu/fj6 b]lvof]h;sf] kmn:j?kahf/ !,*!%=!&cªsdfaGbeof] .uPsf] ;ftf g]K;] kl/;"rsdf s]xL s/]S;g b]lvof] / kl/;"rsdf ;fO{8j]h d'ed]G6 b]lvof]. t/ ;du|dfclxn]klg kl/;"rs %) lbg] d'leËPe/]h tyf @)) lbg] d'leËeGbfdfly g} rln/x]sf] cj:yfn] ;du|dfahf/sf] l:ylt /fd|f] b]lvG5 .cf};t sf/f]af/kl/df0f eg]!&)=&% s/f]8af6 !@$=(( s/f]8 dfcfPsf]cj:yf b]lvof] . $_ 6]jftyfk|lt/f]w cªs glhssf] 6]jfcªs !^*) 6]jfcªs @ !^)) glhssf] k|lt/f]w cªs !**) uPsf] ;ftf g]K;] kl/;"rs!*))cªssf]jl/kl/ /x]sf]cj:yf /xof] / xfngofFk|lt/f]wcªs !**) g} /x]sf] cj:yf 5 . %_ g]K;] 6]«G8 ;"rs s_ d'leª Pe/]hsGeh]{G; 8fOeh]{G; -PdP;L8L_ PdP;L8Ldfb'O{ cf]6f /]vf x'G5g, h;df Pp6fn] ahf/sf] lbzf kl/jt{gsf] ;+s]t u5{ eg] csf]{n] ahf/sf] k|j[lQ -6«]08_ b]vfpg] u5{ . olb PdP;L8L /]vfn] l;Ung /]vfnfO{ tnaf6 dfly sf6]dfo;nfO{ ;sf/fTds ;+s]tsf ?kdflnO{G5 / o;n] z]o/x? lsGg] ;+s]t ub{5 . ;ftfsf]cGTodf PdP;L8L nfO{g tyfl;UgnnfO{g s|dzM@!=!(tyf!$=$*sf] l:yltdf /x]sf] lyof] . PdP;L8LnfO{g s]xLlu/fj6 b]lvof] .xfnsf] nflu PdP;L8LnfO{g tyfl;UgnnfO{g s|dz M @)=@( tyf !^=^* /x]sf] 5 / PdP;L8L nfO{g l;UgnnfO{g eGbftncfPdfahf/dfa'lnz l:Ylt b]vg ;lsg] l:ylt 5 . .
- 7. v_ l/n]l6j :6«]Gy OG8]S; -cf/P;cfO{_ cf/P;cfO{k|fljlwsljZn]if0fsf]o:tf] cf}hf/ xf], h;nfO{ Pstlkm{ ?kdfrln/x]sf] ahf/dfJofkf//0fgLltagfpg a9L pkof]uL dflgG5 . To;}u/L, o;n] ahf/dfvl/b / ljlqmsf]:ki6 ;+s]t b]vfpg]u5{ . cf/P;cfO{uPsf];ftfsf]z'?df%*=@(cªsdf/x]sf]lyof]tyf ;ftfsf]cGTolt/ cf/P;cfO{ %&=^*cªsdf /xof].uPsf] ;ftf g]K;]df ;fO{8j]h d'ed]G6 b]lvof] . u_ af]lnªu/ Aof08 af]lnªu/ Aof08 Ps k|fljlwsljZn]if0f ;"rsxf]h;df @!–lbg]d'leËPe/]hsf ;fyb'O{ Aof08 -Pp6fdfly_ / Pp6f tn_ x'G5g . lo Aof08x?n]cl:y/tfsf] ;+s]t ub{5g, h'g :6fG88{8]leP;g u0fgf u/]/ kQfnufO{G5 .
- 8. g]K;] kl/;"rsuPsf] ;ftf km]l/ pkNnf] Jof08nfO{ 5f]8L tncfPsf] cj:yfn]lsGg] xf]8afhLdf s]xLsdLcfPsf];+s]t ub{5 . pkNnf] tyftNnf] Jof08 aLrsf] b'/LdfcfPsf] ;fdfGo a[l4n]cl:yt/tfeg] s]xL] a9]sf] ;+s]t ub{5 . ;du{dfM uPsf] ;ftf g]K;] kl/;"rsdf&=**cªssf] lu/fj6 b]lvof]h;sf] kmn:j?kahf/ !*!%=!&cªsdfaGbeof] . clxn] klg kl/;"rs %) lbg] d'leËPe/]h tyf @)) lbg] d'leËeGbfdflyuO{/x]sf]cj:yfn] ahf/ ;sf/fTds l:yltdf g} /x]sf] ;+s]t ub{5 . PdP;L8L nfO{gdf b]lvPsf] ;fdfGolu/fj6n]lsGg] xf]8afhLdf eg] s]xLsdLcfPsf]b]lvG5 . clxn] klg&) cªseGbftnem/]sf]]cf/P;cfO{n] ahf/ cf]e/ a6 l:yltdf g/x]sf] ;+s]t ub{5 t/ la:tf/} dflycfpg ;Sg] l:ylt b]lvG5 . pkNnf] tyftNnf] Jof08 aLrsf] b'/Ldfb]lvPsf] ;fdfGo a[l4n]ahf/sf] cl:y/tfdfeg]a[l4ePsf] ;+s]t ub{5 .xfnsf] cj:yfdfgofF 6]jfcªstyfk|lt/f]w cªs s||dzM !^*) tyf !**) sfod /x]sf] 5 .