Nepse Technical Analysis August 14 - August 18, 2016
•
0 likes•219 views

Nepse Weekly Technical Analysis August 14 - August 18, 2016

Recommended
Recommended
More Related Content
What's hot
What's hot (20)
Viewers also liked
Viewers also liked (13)
Similar to Nepse Technical Analysis August 14 - August 18, 2016
Similar to Nepse Technical Analysis August 14 - August 18, 2016 (12)
More from Kriti Capital & Investments Ltd.
More from Kriti Capital & Investments Ltd. (8)
Recently uploaded
Recently uploaded (20)
Nepse Technical Analysis August 14 - August 18, 2016
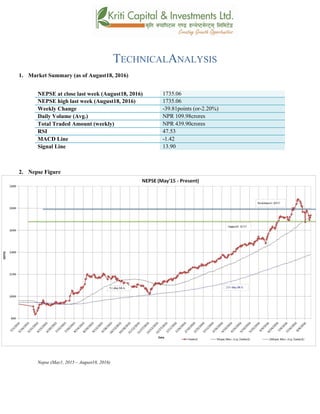
- 1. TECHNICALANALYSIS 1. Market Summary (as of August18, 2016) NEPSE at close last week (August18, 2016) 1735.06 NEPSE high last week (August18, 2016) 1735.06 Weekly Change -39.81points (or-2.20%) Daily Volume (Avg.) NPR 109.98crores Total Traded Amount (weekly) NPR 439.90crores RSI 47.53 MACD Line -1.42 Signal Line 13.90 2. Nepse Figure Nepse (May1, 2015 – August18, 2016)
- 2. 3. Trend Analysis The Nepseindexlost 39.81 points (ordown2.20%) to close at 1735.06 last week. The indexdeclined by 80.06 points at the beginning of the week. However, the market recovered some of the points as it gained 40.25 points towards the end of the week. The index is moving well above the 200 day moving average, indicating the long term outlook looks good. However, it is moving just above the 50 day moving average, showing that the 50 day MA to be a strong support level. 4. Resistance and Support Immediate Support 1690 Support 2 1723 Immediate Resistance 1800 Resistance 2 The Nepse indexbroke the support level of 1723 by reaching 1694.81last week. However, it has climbed back up and above the 1723 level. The index experienced high volatility in the past week. Hence, the new support and resistance level now stands at 1690 and 1800 level respectively. 5. Trend Indicator a.) MACD The MACD is a momentum oscillator formed by using two different types of moving averages, which provides specific buying or selling signals. When a MACD line crosses above the signal line, it is considered to be a positive sign and indicates a time to buy, and vice-versa. The Macdand the signal line, at the beginning of last week, stood at 10.92 and 26.71respectively. Both the linesdeclined and diverged in the course of the week, where the macd line continues to move below the signal line. Such indicator gives a bearish signal of the market. Furthermore, the macd line entered the negative territory as well. At the end of the week, the macd and the signal line stood at -1.42 and 13.90 respectively. b.) RSI RSI is a form of leading indicator that is believed to be most effective during periods of sideways movement. Such indicators may create numerous buy and sell signals that are useful when the market is not clearly trending upwards or downwards.
- 3. The RSI, at the beginning of last week, stood at 46.06 points. In the course of the week, it gained 1.47 points to close at 47.53 level. The RSI indicator continues to show a decrease in the buying pressure in the market. c.) Bollinger Bands The Bollinger Band is a technical indicator that consists of a moving average (21-day) along with two trading bands above (upper band) and below it (lower band). The bands are an indication of volatility, which are represented by calculating standard deviation. The benchmark index moved closer towards the lower bollinger band. However, it bounced back up closer to the middle band towards the end of the week. The bollinger bands also signify a rise in selling pressure in the market. The distance between the upper and lower bands also indicates presence of high volatility in the market. 6. Overview TheNepse index lost 39.81 points (or down2.20%) to close at 1735.06last week.Nepsecontinues to run above the 50-day and 200-day moving averages, indicating that the long term market condition looks good. The 50- day moving average also shows to be a strong support level, as the index bounced back up twice. The macd line has entered the negative territory, giving a bearish signal of the market. The RSI also shows a decrease in the buying pressure in the market. The bollinger bands continue to show high volatility as well. The new support and resistance level now stands at 1690 and 1800 respectively.
- 4. k|fljlwsljZn]if0f !_ahf/ ;f/f+z -ebf}@, @)&#;Ddsf]_ aGb cªs -ebf}@, @)&#_ !&#%=)^ pRr cªs -uPsf] ;ftf_ !&#%=)^ ;fKtflxs kl/jt{g –#(=*! -–@=@)k|ltzt_ b}lgscf};t Jofkf/ ¿=!)(=(*s/f]8 s'n ;fKtflxsJofkf/ ¿ $#(=() s/f]8 cf/P;cfO{ $&=%# PdP;L8L –!=$@ l;UgnnfO{g !#=() @_ ahf/ k|j[lt Nepse (May 1, 2015 – August 18, 2016)
- 5. #_ 6]«G8 ljZn]if0f uPsf] ;ftfg]K;] kl/;"rsdf#(=*!cªssf] lu/fj6 b]lvof]h;sf] kmn:j?kahf/ !,&#%=)^cªsdfaGbeof] . uPsf] ;ftf g]K;] kl/;"rsdfef/L lu/fj6 b]lvof] h;nfO{ ljleGgnufgLstf{x?n] ;fdfGoahf/ s/]S;gsf] ;+1f lbP t/ g]K;]n] ;ftfsf] afFsLlbgx?df $)=@% cªs a6'Nof] . t/ ;du|dfclxn] klg kl/;"rs %) lbg] d'leËPe/]h tyf @)) lbg] d'leËeGbfdfly g} rln/x]sf] cj:yfn] ;du|dfahf/sf] l:ylt /fd|f] b]lvG5 .xfnsf] cj:yfdf%) lbg] d'leËPe/]h Pp6f alnof] 6]jfcªssf] ?kdf b]lvPsf] 5 . $_ 6]jftyfk|lt/f]w cªs glhssf] 6]jfcªs !^() 6]jfcªs @ !&@# glhssf] k|lt/f]w cªs !*)) uPsf] ;ftf g]K;] kl/;"rscfkmgf] glhssf] 6]jfcªs !&@# eGbftnuPsf] cj:yf /xof] . t/ ;f] 6]jfcªsnfO{ g]K;]n] t'?Gtk|fKt u/]sf] cj:yf /xof] . uPsf] ;ftf g]K;] kl/;"rsdflgs} g} cl:yt/tf b]lvof] . xfnsf] nflugofF 6]jfcªstyfk|lt/f]w cªss|dzM !^() tyf !*)) /x]sf] 5 . %_ g]K;] 6]«G8 ;"rs s_ d'leª Pe/]hsGeh]{G; 8fOeh]{G; -PdP;L8L_ PdP;L8Ldf b'O{ cf]6f /]vf x'G5g, h;df Pp6fn] ahf/sf] lbzf kl/jt{gsf] ;+s]t u5{ eg] csf]{n] ahf/sf] k|j[lQ -6«]08_ b]vfpg] u5{ . olb PdP;L8L /]vfn] l;Ung /]vfnfO{ tnaf6 dfly sf6]dfo;nfO{ ;sf/fTds ;+s]tsf ?kdflnO{G5 / o;n] z]o/x? lsGg] ;+s]t ub{5 . uPsf] ;ftfsf] z'?df PdP;L8L nfO{gtyfl;UgnnfO{g s|dzM!)=(@tyf@^=&!sf] l:yltdf /x]sf] lyof] . t/ ;ftfsf] afFsLlbgx?dfPdP;L8L nfO{g l;UgnnfO{geGbftn g} /x]sf] cj:yf /x]sf] 5 h;n] xfnahf/ a'lnz 6]«G8df /x]sf] ;+s]t ub{5 / ;ftfsf] lu/fj6 ;Fu} PdP;L8L nfO{g C0ffTds If]qdfk|j]z u/]sf] 5 . ;ftfsf] cGTodf PdP;L8L nfO{g tyfl;UgnnfO{g s|dzM–!=$@tyf!#=()sf] l:yltdf /x]sf] lyof] .
- 6. v_ l/n]l6j :6«]Gy OG8]S; -cf/P;cfO{_ cf/P;cfO{ k|fljlwsljZn]if0fsf] o:tf] cf}hf/ xf], h;nfO{ Pstlkm{ ?kdfrln/x]sf] ahf/dfJofkf/ /0fgLlt agfpg a9L pkof]uL dflgG5 . To;}u/L, o;n] ahf/dfvl/b / ljlqmsf] :ki6 ;+s]t b]vfpg] u5{ . cf/P;cfO{uPsf] ;ftfsf] z'?df$^=)^cªsdf/x]sf] lyof]tyf ;ftfsf] cGTolt/ cf/P;cfO{ $&=%#cªsdf /xof].h;n] ahf/dfa]Rg]xf]8afhLsf] ;+s]t ub{5 . &) cªseGbflgs} tnem/]sf]] cf/P;cfO{ clxn] ahf/df a]Rg] xf]8afhL a9]sf] ;+s]t ub{5 . u_ af]lnªu/ Aof08 af]lnªu/ Aof08 Ps k|fljlwsljZn]if0f ;"rsxf] h;df @!–lbg] d'leËPe/]hsf ;fyb'O{ Aof08 -Pp6f dfly_ / Pp6f tn_ x'G5g . lo Aof08x?n] cl:y/tfsf] ;+s]t ub{5g, h'g :6fG88{ 8]leP;g u0fgf u/]/ kQfnufO{G5 .
- 7. g]K;] kl/;"rsuPsf] ;ftfpkNnf] Jof08eGbf k/ uPsf] cj:yfn] ahf/ cf]e/ a6 l:ylt af6 aflx/ cfPsf] ;+s]t ub{5 . pkNnf] tyftNnf] Jof08 aLrsf] b'/LdfcfPsf] a[l4n]cl:yt/tfeg] a9]sf] ;+s]t ub{5 . ;du{dfM uPsf] ;ftf g]K;] kl/;"rsdf#(=*!cªssf] lu/fj6 b]lvof]h;sf] kmn:j?kahf/ !&#%=)^cªsdfaGbeof] . clxn] klg kl/;"rs %) lbg] d'leËPe/]h tyf @)) lbg] d'leËeGbfdflyuO{/x]sf] cj:yfn] ahf/ ;sf/fTds l:yltdf g} /x]sf] ;+s]t ub{5 . PdP;L8L nfO{gl;UgnnfO{g eGbftncfPsf]cj:yfn] ahf/dflsGg] xf]8afhLdf sdLcfPsf] b]lvG5 . &) cªseGbflgs} tnem/]sf]] cf/P;cfO{n] ahf/ cf]e/ a6 l:yltaflx/ cfPsf] ;+s]t ub{5 . pkNnf] tyftNnf] Jof08 aLrsf] b'/Ldfb]lvPsf] a[l4n] ahf/sf] cl:y/tfdfeg]a[l4 ePsf] ;+s]t ub{5 .xfnsf] cj:yfdfgofF 6]jfcªstyfk|lt/f]w cªs s||dzM !^() tyf !*)) g} sfod /x]sf] 5 . ;du|df x]bf{ ahf/ laol/; l:yltdf /x]sf] ;+s]t ub{5 .