Nepse Technical Analysis 31 May 2015 - 4 June 2015
•
0 likes•189 views

Nepse Weekly Technical Analysis 31 May 2015 - 4 June 2015

Recommended
Recommended
More Related Content
What's hot
What's hot (20)
Viewers also liked
Viewers also liked (11)
Similar to Nepse Technical Analysis 31 May 2015 - 4 June 2015
Similar to Nepse Technical Analysis 31 May 2015 - 4 June 2015 (15)
More from Kriti Capital & Investments Ltd.
More from Kriti Capital & Investments Ltd. (20)
Recently uploaded
Recently uploaded (20)
Nepse Technical Analysis 31 May 2015 - 4 June 2015
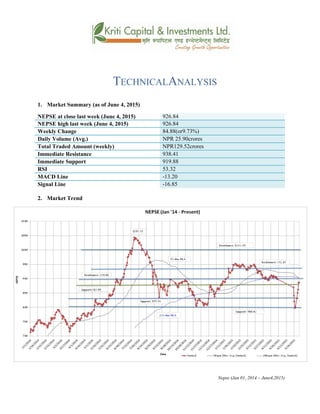
- 1. TECHNICALANALYSIS 1. Market Summary (as of June 4, 2015) NEPSE at close last week (June 4, 2015) 926.84 NEPSE high last week (June 4, 2015) 926.84 Weekly Change 84.88(or9.73%) Daily Volume (Avg.) NPR 25.90crores Total Traded Amount (weekly) NPR129.52crores Immediate Resistance 938.41 Immediate Support 919.88 RSI 53.32 MACD Line -13.20 Signal Line -16.85 2. Market Trend Nepse (Jan 01, 2014 – June4,2015)
- 2. 3. RSI RSI is a form of leading indicator that is believed to be most effective during periods of sideways movement. Such indicators may create numerous buy and sell signals that are useful when the market is not clearly trending upwards or downwards. RSI made significant improvement last week, as it increased at each trading day. It made a considerableincrease at the beginning of last week as it ended at 32.67 levels from 15.22 the previous trading day. With an increase in momentum, the RSI ended at 53.32 levels at the end of last week. RSI (Jan 01, 2014 – June 4, 2015) 4. MACD The MACD is a momentum oscillator formed by using two different types of moving averages, which provides specific buying or selling signals. When a MACD line crosses above the signal line, it is considered to be a positive sign and indicates a time to buy, and vice-versa. The MACD Linecrossed over the signal line at the middle of last week, and it seems to be trying to get out of the negative zone. Currently, both the lines are still below the zero level. MACD at the end of last week stands at -13.20 and Signal Line at -16.85. MACD (Jan 01, 2014 – June 4, 2015) 5. Bollinger Bands The Bollinger Band is a technical indicator that consists of a moving average (21-day) along with two trading bands above (upper band) and below it (lower band). The bands are an indication of volatility, which are represented by calculating standard deviation. The NEPSE indexexperienced aremarkable surge last week. By the end of last week, the index crossed over the mid Bollinger band, and is currently between the upper and mid bands. The gap between the upper and lower bands is still wide, indicating high market volatility.
- 3. Bollinger Bands (Jan 01, 2014 – June 4, 2015) Overview: Last week, the NEPSE index witnessed a remarkable recovery by gaining almost all the points it had lost after the massive earthquake. Closing at 926.84, the index gained a total of 84.88 points (or 9.73%). However, the moving averages do not support the optimism of the market given that the 200- day moving average has crossed over the 50-day moving average. The average daily market volume increased last week to NPR 25.90 crores from NPR 14.92 crores the week prior. The RSI currently stands at a neutral zone, ending at 53.32. The MACD line has moved above the signal line,and both the lines are stillat a negative territory. Thegap between the upper and lower Bollinger bands still suggests high market volatility. Nepse surpassed two resistance levels last week. Its current support and resistance level stands at 919.88 and 938.41 respectively.
- 4. k|fljlwsljZn]if0f ahf/ ;f/f+z -h]i7@!, @)&@ ;Ddsf]_ aGb cªs -h]i7#, @)&@_ (@^=*$ pRr cªs -uPsf] ;ftf_ (@^=*$ ;fKtflxs kl/jt{g *$=** -(=&#k|ltzt_ b}lgscf};t Jofkf/ ¿=@%=()s/f]8 s'n ;fKtflxsJofkf/ ¿=!@(=%@ s/f]8 tTsflng 6]jf (#*=$! tTsflngk|lt/f]w (!(=** cf/P;cfO{ %#=#@ PdP;L8L –!#=@) l;UgnnfO{g –!^=*% बजारप्रवृित्त Nepse (Jan 01, 2014 – June 4,2015)
- 5. l/n]l6j :6«]Gy OG8]S; -cf/P;cfO{_ cf/P;cfO{ k|fljlwsljZn]if0fsf] o:tf] cf}hf/ xf], h;nfO{ Pstlkm{ ?kdfrln/x]sf] ahf/dfJofkf/ /0fgLlt agfpg a9L pkof]uL dflgG5 . To;}u/L, o;n] ahf/dfvl/b / ljlqmsf] :ki6 ;+s]t b]vfpg] u5{ . cf/P;cfO{dfkm{tuPsf] ;ftf /fd|f] ;'wf/ b]lvof] h;sf] kmn:j?ksf/f]af/ lbgsf] x/]sflbgcf/P;cfO{df ;'wf/ b]lvof] . cf/P;cfO{dfuPsf] ;ftf b]lvPsf] /fd|f] ;'wf/sf] kmn:j?kcf/P;cfO{ %#=#@ cªsdfplSnof] . RSI made significant improvement last week, as it increased at each trading day. It made a considerable increase at the beginning of last week as it ended at 32.67 levels from 15.22 the previous trading day. With an increase in momentum, the RSI ended at 53.32 levels at the end of last week. RSI (Jan 01, 2014 – June 4, 2015) d'leª Pe/]hsGeh]{G; 8fOeh]{G; -PdP;L8L_ PdP;L8Ldf b'O{ cf]6f /]vf x'G5g, h;df Pp6fn] ahf/sf] lbzf kl/jt{gsf] ;+s]t u5{ eg] csf]{n] ahf/sf] k|j[lQ -6«]08_ b]vfpg] u5{ . olb PdP;L8L /]vfn] l;Ung /]vfnfO{ tnaf6 dfly sf6]dfo;nfO{ ;sf/fTds ;+s]tsf ?kdflnO{G5 / o;n] z]o/x? lsGg] ;+s]t ub{5 . PdP;L8LnfO{g]l;UgnnfO{gnfO{ dflyaf6 sf6]sf] cj:yf /xof] . h;n] ahf/ C0ffTds If]qaf6aflx/ lgSngvf]lh /x]sf] ;+s]t ub{5 . xfnsf] cj:yfdfb'j} nfO{g z"Go n]en eGbftn g} /x]sf] 5 . PdP;L8L nfO{g ;ftfsf] cGTolt/ –!#=@)dftyfl;UgnnfO{g –!^=*%df /xguof] .
- 6. ) MACD (Jan 01, 2014 – June 4, 2015) af]lnªu/ Aof08 af]lnªu/ Aof08 Ps k|fljlwsljZn]if0f ;"rsxf] h;df @!–lbg] d'leËPe/]hsf ;fyb'O{ Aof08 -Pp6f dfly_ / Pp6f tn_ x'G5g . lo Aof08x?n] cl:y/tfsf] ;+s]t ub{5g, h'g :6fG88{ 8]leP;g u0fgf u/]/ kQfnufO{G5 . g]K;] kl/;"rsdfuPsf] ;ftf /fd|f] ;'wf/ b]lvof] . g]K;] kl/;"rsn] dWo Jof08nfO{ sf6L dflylt/ cfPsf] cj:yf /xof] / xfn g]K;] kl/;"rspkNnf] tyfdWo Jof08sf] aLrdf /xguPsf] 5 . pkNnf] tyftNnf] Jof08df w]/} b'/L /x]sf] cj:yfn] ahf/dfcl:y/tfcem} lgs} sfod /x]sf] 5 . Bollinger Bands (Jan 01, 2014 – June 4, 2015) ;du{dfM of] uPsf] ;ftf g]K;] kl/;"rsdflgs} /fd|f] ;'wf/ b]lvof] . /fhlgltlt/ ;xdtLsf] jftfj/0f aGb} uPsf] cj:yfsf]kmn:j?kahf/n] g;f]r]sf] k|fs[ltsk|sf]ksf] sf/0f uPsf] dlxgfu'efPsf] cªs w]/} h;f] km]l/ a6'Ng
- 7. ;kmnePsf] 5 . ahf/ ;ftfsf] cGTolt/ (@^=*$ cªsdf /xguof] hf] cl3Nnf] ;ftfsf] eGbf *$=**cªsn] -(=&#Ü_ a9Lxf] . t/ %)–lbg] d'leËPe/]hn] @))–lbg] d'leËPe/]hnfO{ sf6L tnlt/ uO{/xsf] x'gfn] ahf/dfcem} cl:yt/tfsfod /x]sf] ;+s]t ub{5 .cf};t sf/f]af/ /sddf ;d]t cl3Nnf] ;ftfeGbf j[l4 eO{ ?= @%=() s/f]8sf] sf/f]af/ eof]hf] cl3Nnf] ;ftf ?=!$=(@ s/f]8 /x]sf] lyof] .%#=#@df /x]sf] cf/P;cfO[n] ahf/ clxn] Go"6«n cj:yfdfcfPsf] ;+s]t ub{5 . PdP;L8L nfO{gn] l;UgnnfO{gnfO{ s|;u/]sf] cj:yfePtfklgb'j} nfOgxfncem} C0ffTds If]qdf g} /x]sf] 5 . pkNnf] tyftNnf] af]lnªu/ Jof08 aLrsf] b'/Ln] ahf/dfcem} lgs} g} cl:y/tf /x]sf] ;+s]t ub{5 . g]K;] kl/;"rsdfuPsf] ;ftfcfPsf] s|lds ;'wf/n] ubf{6]jfcªs (!(=**cªs /xguPsf] 5 / k|lt/f]w cªs (#*=$!/x]sf] 5 .