Nepse Technical Analysis February 21 - February 25, 2016
•
0 likes•227 views

Nepse Weekly Technical Analysis February 21 - February 25, 2016

Recommended
Recommended
More Related Content
What's hot
What's hot (20)
Viewers also liked
Viewers also liked (9)
Similar to Nepse Technical Analysis February 21 - February 25, 2016
Similar to Nepse Technical Analysis February 21 - February 25, 2016 (17)
More from Kriti Capital & Investments Ltd.
More from Kriti Capital & Investments Ltd. (18)
Recently uploaded
Recently uploaded (20)
Nepse Technical Analysis February 21 - February 25, 2016
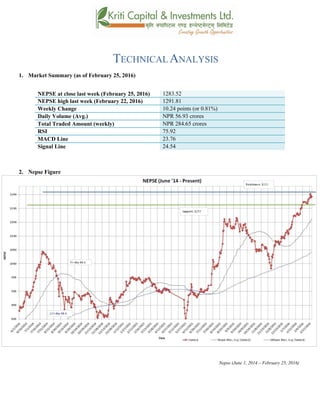
- 1. TECHNICAL ANALYSIS 1. Market Summary (as of February 25, 2016) NEPSE at close last week (February 25, 2016) 1283.52 NEPSE high last week (February 22, 2016) 1291.81 Weekly Change 10.24 points (or 0.81%) Daily Volume (Avg.) NPR 56.93 crores Total Traded Amount (weekly) NPR 284.65 crores RSI 75.92 MACD Line 23.76 Signal Line 24.54 2. Nepse Figure Nepse (June 1, 2014 – February 25, 2016)
- 2. 3. Trend Analysis The Nepse index made a decent climb in the course of last week as well. The index gained 10.24 points (or up 0.81%) to close at 1283.52. It corrected itself for two day during the week as investors seem to be moving on to relatively safer bets such as NIB FPO, which start on 11th falgun. As soon as NRB and SEBON banned NIBPO holders, big investors, especially insurance companies and mutual fund moved on to others scripts in the secondary market. Currently insurance and development banks sub index are on peak point and as mutual fund and insurance companies move to secondary market, commercial banks have potential to rise again. Last week, Nepse created a new height of 1291.81 on Monday. The 50 days moving average is still running above 200 days moving average, indicating Nepse is still on bullish trend. 4. Resistance and Support Immediate Support 1257 Support 2 1216 Immediate Resistance 1320 Resistance 2 Last week Nepse went close to 1300 level at 1298 and made new height, which closed at 1291. With money returning in the secondary market from the institutional investors, it is expected to cross previous height of 1298 and reach first resistance 1320 level. 5. Trend Indicator a.) MACD The MACD is a momentum oscillator formed by using two different types of moving averages, which provides specific buying or selling signals. When a MACD line crosses above the signal line, it is considered to be a positive sign and indicates a time to buy, and vice-versa. The macd and the signal line, at the beginning of the week, stood at 24.30 and 24.63 respectively. Both the lines continue to move close to each other. The distance between the lines has remained close and the macd line is currently below the signal line, which could mean a slowdown in the bullish run. By the end of the week, the macd and the signal line closed at 23.76 and 24.54 respectively. b.) RSI RSI is a form of leading indicator that is believed to be most effective during periods of sideways movement. Such indicators may create numerous buy and sell signals that are useful when the market is not clearly trending upwards or downwards.
- 3. The RSI, at the beginning of the week, stood at 84.64 level, which continue to signifies very high buying pressure in the market. In the course of the week, it fell by 8.72 points to close at 75.92 level. It seems that the RSI will come down in the coming days, which will suggest a slowdown in the buying pressure in the market. c.) Bollinger Bands The Bollinger Band is a technical indicator that consists of a moving average (21-day) along with two trading bands above (upper band) and below it (lower band). The bands are an indication of volatility, which are represented by calculating standard deviation. The benchmark index has been bouncing below the upper Bollinger band in the past month. As the market seems to be on a bullish run, the index could still touch the upper band once again. The distance between the upper and the lower band has remained constant as well, suggesting moderate market volatility. 6. Volume Indicator (On-Balance Volume) On-Balance Volume (OBV) is a momentum indicator that relates volume to the current price of the index or security. It measures buying and selling pressure at the market. It acts as a cumulative indicator that adds volume on up days and subtracts volume on down days. If a price increase is supported by OBV, it confirms an uptrend, whereas if a price decrease is supported by OBV, it confirms a downtrend.
- 4. The On-Balance Volume (OBV) still shows volatility as compared to the movement in Nepse. In the course of last week, the OBV climbed up, which support the bullish run that is still present in the market. The average weekly volume transactions increased to NPR 56.93 crores from NPR 49.34 crores the week prior. 7. Overview The Nepse index gained 10.24 points (or up 0.81%) to close at 1283.52. The 50-day and 200-day moving average continue to climb up along with the benchmark index, indicating that the overall market condition looks good. The RSI continues to signal high buying pressure in the market as it is hovering at 75.92 level. However, the level has been cooling down, which could bean a slowdown in the buying pressure. The macd line is still moving very close to the signal line. The Bollinger bands still indicate moderate market volatility. The support and resistance level stands the same at 1257 and 1320 respectively. Note: It was expected that NIB FPO would collect huge money from secondary market. Later as NIBPO holders were bar to apply NIB FPO, institutional investors like mutual fund and insurance company’s investment will return to secondary market, so banking index is on center investment.
- 5. k|fljlwsljZn]if0f !_ahf/ ;f/f+z -kmfNu'0f!#, @)&@ ;Ddsf]_ aGb cªs -kmfNu'0f!#, @)&@_ !@*#=%@ pRr cªs -uPsf] ;ftf_ !@(!=*! ;fKtflxs kl/jt{g !)=@$ -)=*!k|ltzt_ b}lgscf};t Jofkf/ ¿=%^=(!s/f]8 s'n ;fKtflxsJofkf/ ¿ @*$=^% s/f]8 cf/P;cfO{ &%=(@ PdP;L8L @#=&^ l;UgnnfO{g @$=%$ @_ ahf/ k|j[lt Nepse (June 1, 2014 – February 25, 2016)
- 6. #_ 6]«G8 ljZn]if0f uPsf] ;ftfklg g]K;] kl/;"rs a9g] s|dhf/L g} /xof] . uPsf] ;ftf kl/;"rsdf !)=@$cªssf] a[l4 b]lvof] h;sf] kmn:j?kahf/ !@*#=%@ cªsdfaGbeof] . ;ftfsf] s]xLlbgahf/df s/]S;gklgblvof] hf] clxn] ahf/df s]xLsKdgLx?sf] k|fyldslgisfzgn] ubf{ klgx'gk'Uof] . ;ftfsf] cGTolt/ lgodglgsfon] g]kfn O{Ge]i6d]G6 a}+ssf] Pkmlkcf] df ;+:yfks z]o/ wf/0f ug]{x? b/vf:tkmf/d xfNgaGb]h u/] nut} 7"nf nufgLstf{x?n] g]K;]df c? z]o/ lsGgyfn]sf] ;d]t b]lvof] . uPsf] ;ftf g]K;] kl/;"rsn] cfkmgf] Oltxf;s} ;a}eGbfpRrcªs !@(!=*! Kff/ u/]sf] cj:yf /xof] . clxn] klg kl/;"rs %) lbg] d'leËPe/]h tyf @)) lbg] d'leËeGbfdfly g} rln/x]sf] cj:yf ;du|dfahf/sf] l:ylt /fd|f] b]lvG5 / ahf/ clxn] klga'lnzcj:yfdf g} /x]sf] ;+s]t ub{5 . $_ 6]jftyfk|lt/f]w cªs glhssf] 6]jfcªs !@%& 6]jfcªs @ !@!^ glhssf] k|lt/f]w cªs !#@) uPsf] ;ftfklgg]K;] kl/;"rscfkmgf] Oltxf; s} pRrcªs !@(! kf/ u/]sf] cj:yf /xof] . bf];|f] ahf/df km]l/ 7"nf nufgLstf{x?sf] ;+nUgtf a9] kl5 ahf/ km]l/ cem} dflyhfg ;Sg] ;+Defjgfalnof] ePsf] 5 . oxLcj:yfdfahf/n] cfkmgf] glhssf] k|lt/f]w cªs !#@) ;d]t kf/ ug{ ;Sg] ;+Defjgf /x]sf] 5 . %_ g]K;] 6]«G8 ;"rs s_ d'leª Pe/]hsGeh]{G; 8fOeh]{G; -PdP;L8L_ PdP;L8Ldf b'O{ cf]6f /]vf x'G5g, h;df Pp6fn] ahf/sf] lbzf kl/jt{gsf] ;+s]t u5{ eg] csf]{n] ahf/sf] k|j[lQ -6«]08_ b]vfpg] u5{ . olb PdP;L8L /]vfn] l;Ung /]vfnfO{ tnaf6 dfly sf6]dfo;nfO{ ;sf/fTds ;+s]tsf ?kdflnO{G5 / o;n] z]o/x? lsGg] ;+s]t ub{5 . uPsf] ;ftfsf] z'?df PdP;L8L nfO{gtyfl;UgnnfO{g s|dzM @$=#)tyf @$=^#sf] l:yltdf /x]sf] lyof] . clxn] klgb'j} nfO{g ;Fu ;Fu} rln/x]sf] cj:yf /xof] . xfnsf] cj:yfdfPdP;L8L nfO{gl;UgnnfO{geGbftn /x]sf] l:yltn] a'lnzcj:yfdf s]xLsdLcfPsf] 5 . . ;ftfsf] cGTodfPdP;L8L tyfl;UgnnfO{g s|dzM @#=&^tyf @$=%$cªssf] l:yltdf /xgk'Uof] .
- 7. v_ l/n]l6j :6«]Gy OG8]S; -cf/P;cfO{_ cf/P;cfO{ k|fljlwsljZn]if0fsf] o:tf] cf}hf/ xf], h;nfO{ Pstlkm{ ?kdfrln/x]sf] ahf/dfJofkf/ /0fgLlt agfpg a9L pkof]uL dflgG5 . To;}u/L, o;n] ahf/dfvl/b / ljlqmsf] :ki6 ;+s]t b]vfpg] u5{ . uPsf] ;ftfz?dfcf/P;cfO{ *$=^$ cªsdf /x]sf] lyof] h;n] ahf/dflsGg] xf]8afhLsf] ;+s]t ub{5 . t/ kl5 ;ftfsf] afFsLlbgx?df ;f] *=&@ cªsn] 36]/ &%=(@ cªs ;d]t 5f]Psf] cj:yf /xof] . h;n] cfufdLlbgx?dfcf/P;cfO{ 36g] ;Defjgf /x]sf] b]vfp5 h;sf] kmn:j?kahf/ /x]sf] lsGg] xf]8afhLdf s]xLsdLcfpg ;S5 . u_ af]lnªu/ Aof08 af]lnªu/ Aof08 Ps k|fljlwsljZn]if0f ;"rsxf] h;df @!–lbg] d'leËPe/]hsf ;fyb'O{ Aof08 -Pp6f dfly_ / Pp6f tn_ x'G5g . lo Aof08x?n] cl:y/tfsf] ;+s]t ub{5g, h'g :6fG88{ 8]leP;g u0fgf u/]/ kQfnufO{G5 . g]K;] kl/;"rsuPsf] ;ftfpkNnf] Aof08nfO{ 5f]P/ tncfPsf] cj:yf /xof] hf] uPsf] Ps dlxgfdfnueu Pp6} 6]«G8df rln/xof] .;fy} pkNnf] tyftNnf] Jof08 aLr a9]sf] b'/Lnueu Pp6} /x]sf] l:yltn] ahf/dfcl:yt/tfcem} sfod /x]sf] ;+s]t ub{5 .
- 8. ;du{dfM uPsf] ;ftf g]K;] kl/;"rsdf!)=@$cªssf]] a[l4 b]lvof] h;sf] kmn:j?k kl/;"rs!@*#=%@cªsdfaGbeof] . clxn]klgkl/;"rs %) lbg] d'leËPe/]htyf @)) lbg] d'leËeGbfdflyuO{/x]sf] cj:yfn] ahf/ ;sf/fTds l:yltdf g} /x]sf] ;+s]t ub{5 .*) cªsaf6 s]xLtnem/]sf] cf/P;cfO{n] clxn] klgahf/ cf]e/a6 l:yltdf /x]sf] ;+s]t ub{5 t/ uPsf] ;ftfsf] cl3Nnf] ;ftfeGbf s]xLtncfPsf] cf/P;cfO{ eg] ahf/dfcf]e/a6 l:yltdf s]xLsdLcfpg ;Sg] ;+Defjgf /x]sf] ;+s]t ub{5 . af]lnªu/ Aof08n] ahf/ a'lnz l:ylt ;Fu} ahf/dfcl:yt/tfcem} sfod /x]sf] ;+s]t ub{5 . xfnsf] cj:yfdfgofF 6]jfcªstyfk|lt/f]w cªs s||dzM !@%&tyf !#@) /x]sf] 5 .