
Recommended
More Related Content
What's hot
What's hot (20)
Viewers also liked
Viewers also liked (11)
Similar to Aaj ka trend 16.11.16
Similar to Aaj ka trend 16.11.16 (20)
Recently uploaded
Recently uploaded (20)
Aaj ka trend 16.11.16
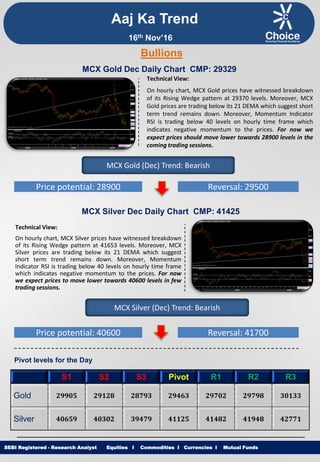
- 1. Equities I Commodities I Currencies I Mutual Funds Aaj Ka Trend Technical View: On hourly chart, MCX Gold prices have witnessed breakdown of its Rising Wedge pattern at 29370 levels. Moreover, MCX Gold prices are trading below its 21 DEMA which suggest short term trend remains down. Moreover, Momentum Indicator RSI is trading below 40 levels on hourly time frame which indicates negative momentum to the prices. For now we expect prices should move lower towards 28900 levels in the coming trading sessions. SEBI Registered - Research Analyst Equities I Commodities I Currencies I Mutual Funds Bullions MCX Gold Dec Daily Chart CMP: 29329 MCX Gold (Dec) Trend: Bearish Price potential: 28900 Reversal: 29500 MCX Silver Dec Daily Chart CMP: 41425 Technical View: On hourly chart, MCX Silver prices have witnessed breakdown of its Rising Wedge pattern at 41653 levels. Moreover, MCX Silver prices are trading below its 21 DEMA which suggest short term trend remains down. Moreover, Momentum Indicator RSI is trading below 40 levels on hourly time frame which indicates negative momentum to the prices. For now we expect prices to move lower towards 40600 levels in few trading sessions. MCX Silver (Dec) Trend: Bearish Price potential: 40600 Reversal: 41700 Pivot levels for the Day S1 S2 S3 Pivot R1 R2 R3 Gold 29905 29128 28793 29463 29702 29798 30133 Silver 40659 40302 39479 41125 41482 41948 42771 16th Nov’16
- 2. Equities I Commodities I Currencies I Mutual Funds Technical View: On daily chart, MCX Copper price has given breakout of its ascending triangle pattern at 337.10 levels on daily chart. Moreover, prices have retraced till 61.80% Fibonacci levels on hourly chart. Furthermore, MCX Copper is trading above its 100 DEMA on daily time frame. Moreover, momentum indicator MACD has shown positive crossover on daily chart which is bullish sign. For now we expect prices to move higher towards 386 levels in coming trading sessions. SEBI Registered - Research Analyst Equities I Commodities I Currencies I Mutual Funds MCX Copper Nov Daily Chart CMP: 375 MCX Copper (Nov) Trend: Bullish Price potential: 386 Reversal: 367 MCX Crude Oil Nov. Daily Chart CMP: 3082 Technical View: MCX Crude oil price has reversed after forming Double Top pattern on hourly chart. MCX Crude Oil is trading in a Lower Low pattern on hourly chart. In addition, Counter is facing resistance of its horizontal trend line in NYMEX at $45.35 levels on hourly chart. Moreover, Momentum indicator MACD is trading below its signal line on daily chart which suggest the negative movement in the prices. For now we expect prices to move lower 2970 towards levels in coming trading sessions. MCX Crude Oil (Nov) Trend: Bearish Price potential: 2970 Reversal: 3130 Pivot levels for the Day S1 S2 S3 Pivot R1 R2 R3 Copper 368.0 357.7 341.8 373.5 383.8 389.4 405.2 Crude 2880 2849 2722 2976 3007 3103 3230 Base Metal Energy Aaj Ka Trend 16th Nov’16
- 3. Equities I Commodities I Currencies I Mutual FundsSEBI Registered - Research Analyst Equities I Commodities I Currencies I Mutual Funds Other Base Metals & Energy S1 S2 S3 Pivot R1 R2 R3 Trend Copper 368.0 357.7 341.8 373.5 383.8 389.4 405.2 Aluminum 116.4 114.7 112.1 117.4 119.0 120.0 122.7 Lead 146.3 143.7 139.3 148.1 150.7 152.5 156.9 Nickel 754.2 739.0 714.4 763.6 778.8 788.2 812.8 Zinc 172.7 168.3 160.7 175.9 180.3 183.5 191.1 Natural Gas 177.2 175.6 169.0 182.2 183.8 188.8 195.4 Fundamental News: Gold prices rose mildly in Asia on Tuesday with investors awaiting remarks from Fed Chair Janet Yellen this week expected to offer a harder view on a widely expected rate hike next month. Gold futures rose in early Europe trading on Tuesday, snapping a five-session losing streak which took prices to the lowest level in more than five-months as the U.S. dollar pulled back from a one-year high. Gold futures erased overnight gains in North American trading on Tuesday, falling back towards a six-month low after data showed that U.S. retail sales rose more than expected in October, boosting optimism over the health of the economy. Oil prices were higher during Europe trading on Tuesday, bouncing back from a three-month low as market players hoped major global oil producers will reach an agreement to cut output. Oil Tuesday surged 3%, recovering from multi-month lows on renewed hopes for an OPEC output cut. Oil prices jumped more than 3 percent on Tuesday, bouncing back from multi-month lows on expectations that OPEC will agree later this month to cut production to reduce a supply glut. Oil prices were higher during North America trading on Tuesday, extending overnight gains as market participants continued to weigh prospects of a coordinated production cut among major global oil producers. Copper prices were lower on Tuesday, extending its decline from the highest level since June 2015 amid speculation prices rallied too hard and too fast. Aaj Ka Trend 16th Nov’16
- 4. Equities I Commodities I Currencies I Mutual FundsSEBI Registered - Research Analyst Equities I Commodities I Currencies I Mutual Funds International Market Commodity Closing Price Gold 1232.20 Silver 17.20 Crude Oil 45.59 Brent Crude Oil 46.70 Natural Gas 2.71 COMEX/NYMEX/ICE ( Precious Metals & Energy) Currency & Commodity Index Currency (Spot) Current Price USD / INR 66.70 Dollar Index 99.93 EUR / USD 1.07 CRB Index* 183.05 Closing as on 15.11.16 *Closing as on 15.11.16 LME (Base Metals) ( $ per tones) Commodity Closing Price Copper 5521 Aluminum 1730 Zinc 2590 Lead 2180 Nickel 11250 SHFE (Base Metals) (Yuan per tones) Commodity Closing Price Copper 39880 Aluminum 13520 Zinc 19850 Lead 16900 Closing as on 15.11.16 Closing as on 15.11.16 LME INVENTORY DATA Aaj Ka Trend 07-Nov-16 08-Nov-16 10-Nov-16 14-Nov-16 15-Nov-16 Aluminium -5276 -5076 -4125 -6300 -6400 Copper -6602 -6774 -9025 -4100 -4700 Lead -226 -74 -325 -150 -150 Nickel -545 -194 192 0 1092 Zinc -299 -476 -775 -800 -301 16th Nov’16
- 5. Equities I Commodities I Currencies I Mutual Funds This is solely for information of clients of Choice Broking and does not construe to be an investment advice. It is also not intended as an offer or solicitation for the purchase and sale of any financial instruments. Any action taken by you on the basis of the information contained herein is your responsibility alone and Choice Broking its subsidiaries or its employees or associates will not be liable in any manner for the consequences of such action taken by you. We have exercised due diligence in checking the correctness and authenticity of the information contained in this recommendation, but Choice Broking or any of its subsidiaries or associates or employees shall not be in any way responsible for any loss or damage that may arise to any person from any inadvertent error in the information contained in this recommendation or any action taken on basis of this information. Technical analysis studies market psychology, price patterns and volume levels. It is used to forecast future price and market movements. Technical analysis is complementary to fundamental analysis and news sources. The recommendations issued herewith might be contrary to recommendations issued by Choice Broking in the company research undertaken as the recommendations stated in this report is derived purely from technical analysis. Choice Broking has based this document on information obtained from sources it believes to be reliable but which it has not independently verified; Choice Broking makes no guarantee, representation or warranty and accepts no responsibility or liability as to its accuracy or completeness. The opinions contained within the report are based upon publicly available information at the time of publication and are subject to change without notice. The information and any disclosures provided herein are in summary form and have been prepared for informational purposes. The recommendations and suggested price levels are intended purely for trading purposes. The recommendations are valid for the day of the report however trading trends and volumes might vary substantially on an intraday basis and the recommendations may be subject to change. The information and any disclosures provided herein may be considered confidential. Any use, distribution, modification, copying, forwarding or disclosure by any person is strictly prohibited. The information and any disclosures provided herein do not constitute a solicitation or offer to purchase or sell any security or other financial product or instrument. The current performance may be unaudited. Past performance does not guarantee future returns. There can be no assurance that investments will achieve any targeted rates of return, and there is no guarantee against the loss of your entire investment. POTENTIAL CONFLICT OF INTEREST DISCLOSURE (as on date of report) Disclosure of interest statement – • Analyst interest of the stock /Instrument(s): - No. • Firm interest of the stock / Instrument (s): - No. Disclaimer Contact Us Amit Pathania Research Associate amit.pathania@choiceindia.com Rohan Patil Research Associate rohan.patil@choiceindia.com www.choicebroking.incustomercare@choiceindia.com SEBI Registered - Research Analyst Equities I Commodities I Currencies I Mutual Funds Aaj Ka Trend 16th Nov’16 Neeraj Yadav Research Advisor neeraj.yadav@choiceindia.com Anish Vyas Senior Research Associate anish.vyas@choiceindia.com Amit Pathania Digitally signed by Amit Pathania DN: cn=Amit Pathania, o=Choice Equity Broking Pvt. ltd, ou=Research Department, email=amit.pathania@choiceindia.com, c=IN Date: 2016.11.16 08:28:19 +05'30'