1. Equities I Commodities I Currencies I Mutual Funds
Aaj Ka Trend
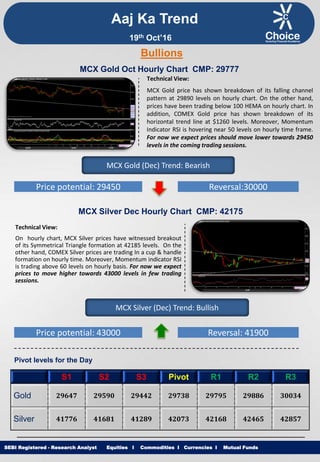
Technical View:
MCX Gold price has shown breakdown of its falling channel
pattern at 29890 levels on hourly chart. On the other hand,
prices have been trading below 100 HEMA on hourly chart. In
addition, COMEX Gold price has shown breakdown of its
horizontal trend line at $1260 levels. Moreover, Momentum
Indicator RSI is hovering near 50 levels on hourly time frame.
For now we expect prices should move lower towards 29450
levels in the coming trading sessions.
SEBI Registered - Research Analyst Equities I Commodities I Currencies I Mutual Funds
Bullions
MCX Gold Oct Hourly Chart CMP: 29777
MCX Gold (Dec) Trend: Bearish
Price potential: 29450 Reversal:30000
MCX Silver Dec Hourly Chart CMP: 42175
Technical View:
On hourly chart, MCX Silver prices have witnessed breakout
of its Symmetrical Triangle formation at 42185 levels. On the
other hand, COMEX Silver prices are trading In a cup & handle
formation on hourly time. Moreover, Momentum indicator RSI
is trading above 60 levels on hourly basis. For now we expect
prices to move higher towards 43000 levels in few trading
sessions.
MCX Silver (Dec) Trend: Bullish
Price potential: 43000 Reversal: 41900
Pivot levels for the Day
S1 S2 S3 Pivot R1 R2 R3
Gold 29647 29590 29442 29738 29795 29886 30034
Silver 41776 41681 41289 42073 42168 42465 42857
19th Oct’16
2. Equities I Commodities I Currencies I Mutual Funds
Technical View:
On hourly chart MCX Copper has given breakdown of its
Triangle pattern at 312.60 levels. In addition, prices have
been trading below its 100 DEMA, which suggest medium
term remains weak. Furthermore, Three Black Crow bearish
candlestick pattern is visible on daily time frame. Moreover,
momentum indicator RSI has been trading below 40 levels
on hourly time frame. For now we expect prices to move
lower towards 306 levels in coming trading sessions.
SEBI Registered - Research Analyst Equities I Commodities I Currencies I Mutual Funds
MCX Copper Nov hourly Chart CMP: 312.50
MCX Copper (Nov) Trend: Bearish
Price potential: 306 Reversal: 318
MCX Crude Oil Oct. Hourly Chart CMP: 3343
Technical View:
MCX Crude Oil prices are trading in a Symmetrical triangle
formation on hourly chart. In addition, Counter is trading
below its 21 HEMA on hourly chart. Moreover, Momentum
indicator RSI has shown negative divergence on 4 hourly
chart. Furthermore, momentum indicator MACD has shown
negative crossover on hourly chart. For now we expect
prices to move lower towards 3265 levels in coming trading
sessions.
MCX Crude Oil (Oct) Trend: Bearish
Price potential: 3265 Reversal: 3390
Pivot levels for the Day
S1 S2 S3 Pivot R1 R2 R3
Copper 312.1 311.2 308.5 313.9 314.8 316.6 319.3
Crude 3305 3286 3233 3339 3358 3392 3445
Base Metal
Energy
Aaj Ka Trend
19th Oct’16
3. Equities I Commodities I Currencies I Mutual FundsSEBI Registered - Research Analyst Equities I Commodities I Currencies I Mutual Funds
Other Base Metals & Energy
S1 S2 S3 Pivot R1 R2 R3 Trend
Copper 312.1 311.2 308.5 313.9 314.8 316.6 319.3
Aluminum 109.8 108.5 106.3 110.7 112.0 112.9 115.1
Lead 131.8 130.7 128.6 132.8 133.9 134.9 137.0
Nickel 685.5 682.8 674.4 691.2 693.9 699.6 708.0
Zinc 149.3 148.1 146.0 150.3 151.5 152.4 154.6
Natural Gas 224.1 217.6 210.9 224.3 230.8 231.0 237.7
Fundamental News:
Gold prices held mostly steady in Asia on Tuesday with comments from Fed Vice Chair Stanley Fischer noted as
saying the central bank is "very close" to job and price targets that should trigger a rate hike.
Gold prices pushed higher during Europe's session on Tuesday, as a pullback in the U.S. dollar from a seven-
month peak boosted the appeal of the precious metal.
Gold prices added to overnight gains in North American trade on Tuesday, as disappointing U.S. inflation data
was seen as easing pressure on the Federal Reserve to tighten monetary policy, weighing on the dollar.
Oil prices rose early on Tuesday as some analysts said markets might not be quite as oversupplied as suggested
by many, with global inventories rising less than expected ahead of the high-demand winter heating season in
the northern hemisphere.
Oil prices were higher during European hours on Tuesday, following an overnight decline, as market players
awaited details of a planned output cut by the Organization of the Petroleum Exporting Countries.
Saudi Arabia's crude oil exports in August fell to 7.305 million barrels per day from 7.622 million bpd in July as
the world's largest oil exporter pumped less, the kingdom has told an influential data base.
Oil prices drifted lower on Tuesday, with a planned production cut by the Organization of the Petroleum
Exporting Countries largely priced into the market as traders’ awaited U.S. inventory data.
The dollar was little changed against the other major currencies on Tuesday, hovering close to a seven-month
peak data showing that the cost of living in the U.S. rose at the fastest pace in five months in September.
Aaj Ka Trend
19th Oct’16
4. Equities I Commodities I Currencies I Mutual FundsSEBI Registered - Research Analyst Equities I Commodities I Currencies I Mutual Funds
International Market
Commodity Closing Price
Gold 1264
Silver 17.64
Crude Oil 50.75
Brent Crude Oil 52.14
Natural Gas 3.24
COMEX/NYMEX/ICE ( Precious Metals & Energy) Currency & Commodity Index
Currency (Spot) Current Price
USD / INR 66.66
Dollar Index 97.84
EUR / USD 1.10
CRB Index* 189.79
Closing as on 18.10.16 *Closing as on 18.10.16
LME (Base Metals) ( $ per tones)
Commodity Closing Price
Copper 4660
Aluminum 1644
Zinc 2287
Lead 1972
Nickel 10316
SHFE (Base Metals) (Yuan per tones)
Commodity Closing Price
Copper 37050
Aluminum 12540
Zinc 17720
Lead 14950
Closing as on 18.10.16 Closing as on 18.10.16
LME INVENTORY DATA
Aaj Ka Trend
12-Oct-16 13-Oct-16 14-Oct-16 17-Oct-16 18-Oct-16
Aluminium -7301 -9952 -10000 -6226 2548
Copper -1498 -1658 2925 -3274 2201
Lead -677 -151 0 -151 601
Nickel -254 -446 612 1768 -1195
Zinc -349 -526 -375 -248 102
19th Oct’16
5. Equities I Commodities I Currencies I Mutual Funds
This is solely for information of clients of Choice Broking and does not construe to be an investment advice. It is also not intended as an offer or solicitation
for the purchase and sale of any financial instruments. Any action taken by you on the basis of the information contained herein is your responsibility alone
and Choice Broking its subsidiaries or its employees or associates will not be liable in any manner for the consequences of such action taken by you. We
have exercised due diligence in checking the correctness and authenticity of the information contained in this recommendation, but Choice Broking or any of
its subsidiaries or associates or employees shall not be in any way responsible for any loss or damage that may arise to any person from any inadvertent
error in the information contained in this recommendation or any action taken on basis of this information. Technical analysis studies market psychology,
price patterns and volume levels. It is used to forecast future price and market movements. Technical analysis is complementary to fundamental analysis
and news sources. The recommendations issued herewith might be contrary to recommendations issued by Choice Broking in the company research
undertaken as the recommendations stated in this report is derived purely from technical analysis. Choice Broking has based this document on information
obtained from sources it believes to be reliable but which it has not independently verified; Choice Broking makes no guarantee, representation or warranty
and accepts no responsibility or liability as to its accuracy or completeness. The opinions contained within the report are based upon publicly available
information at the time of publication and are subject to change without notice. The information and any disclosures provided herein are in summary form
and have been prepared for informational purposes. The recommendations and suggested price levels are intended purely for trading purposes. The
recommendations are valid for the day of the report however trading trends and volumes might vary substantially on an intraday basis and the
recommendations may be subject to change. The information and any disclosures provided herein may be considered confidential. Any use, distribution,
modification, copying, forwarding or disclosure by any person is strictly prohibited. The information and any disclosures provided herein do not constitute a
solicitation or offer to purchase or sell any security or other financial product or instrument. The current performance may be unaudited. Past performance
does not guarantee future returns. There can be no assurance that investments will achieve any targeted rates of return, and there is no guarantee against
the loss of your entire investment.
POTENTIAL CONFLICT OF INTEREST DISCLOSURE (as on date of report) Disclosure of interest statement – • Analyst interest of the stock
/Instrument(s): - No. • Firm interest of the stock / Instrument (s): - No.
Disclaimer
Contact Us
Amit Pathania
Research Associate
amit.pathania@choiceindia.com
Rohan Patil
Research Associate
rohan.patil@choiceindia.com
www.choicebroking.incustomercare@choiceindia.com
SEBI Registered - Research Analyst Equities I Commodities I Currencies I Mutual Funds
Aaj Ka Trend
19th Oct’16
Neeraj Yadav
Research Advisor
neeraj.yadav@choiceindia.com
Anish Vyas
Senior Research Associate
anish.vyas@choiceindia.com
Amit Pathania
Digitally signed by Amit Pathania
DN: cn=Amit Pathania, o=Choice Equity Broking Pvt. ltd,
ou=Research Department,
email=amit.pathania@choiceindia.com, c=IN
Date: 2016.10.19 08:33:09 +05'30'