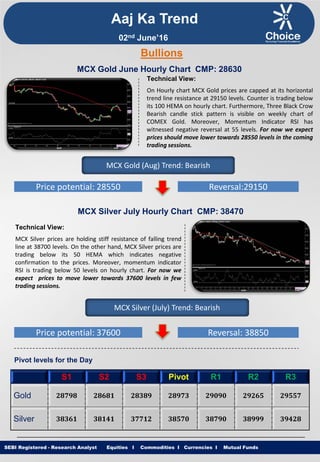
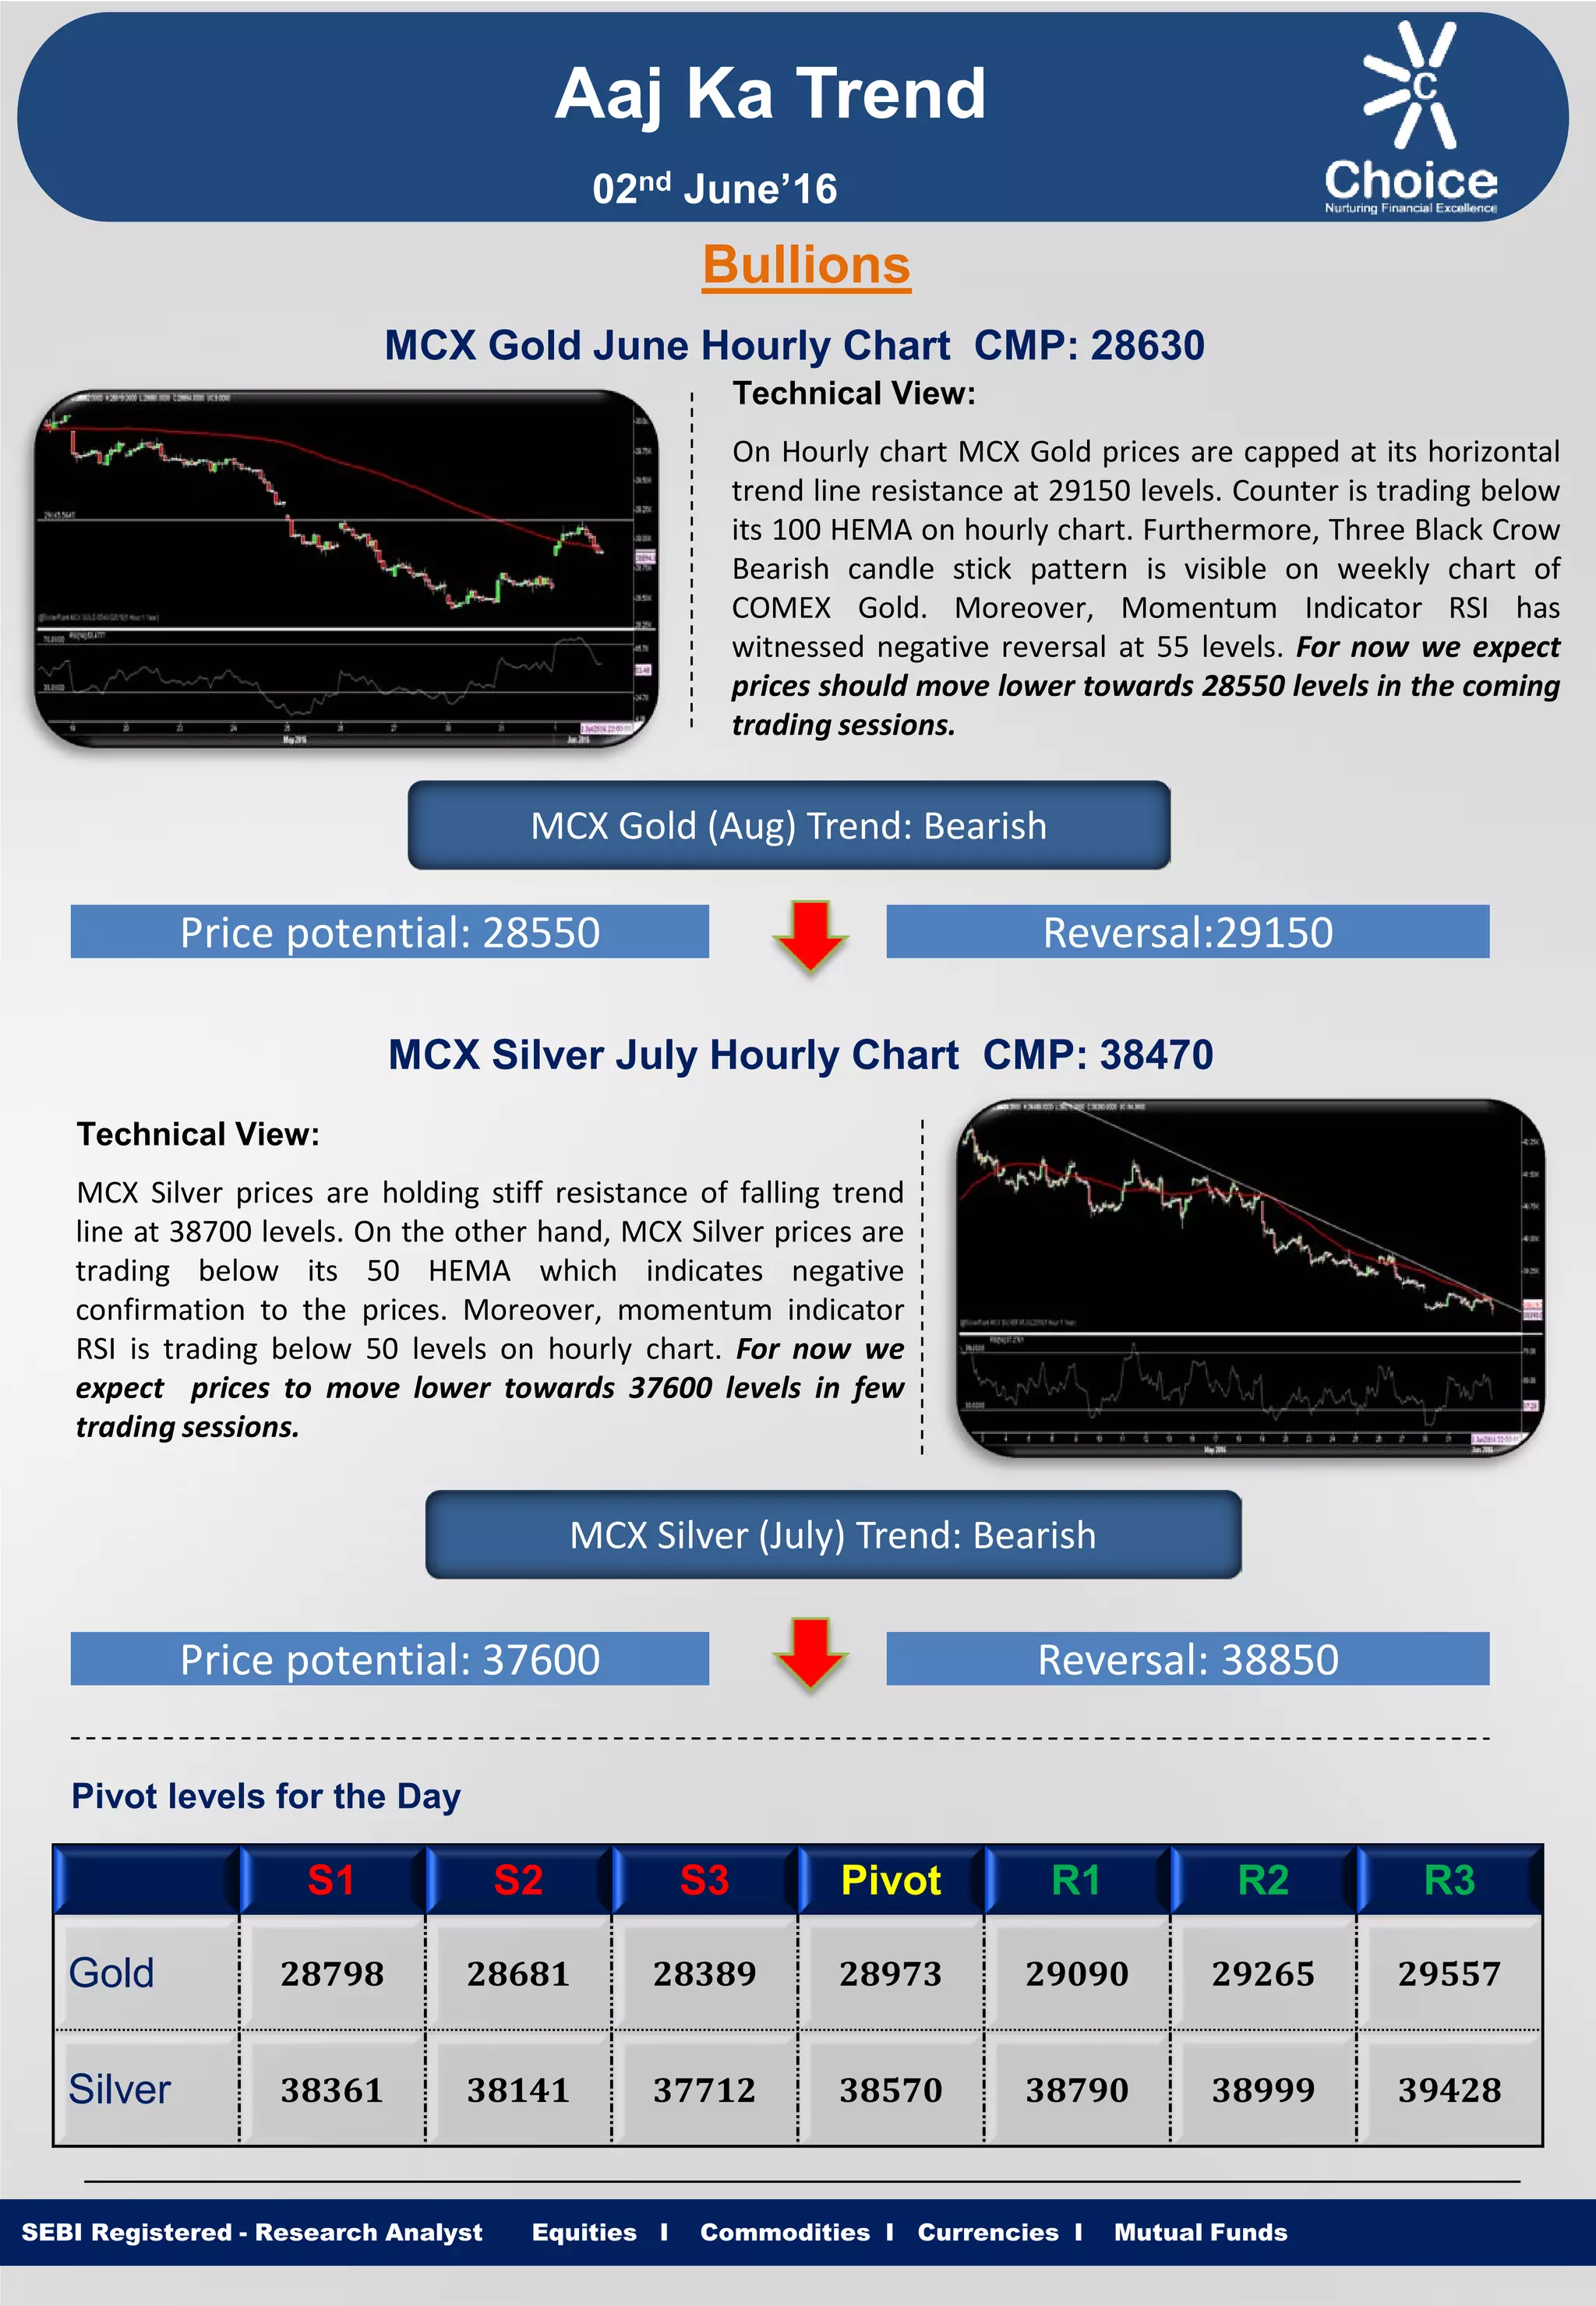
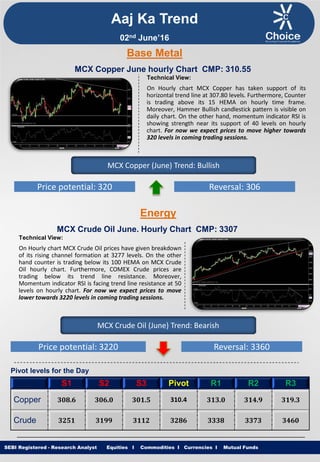
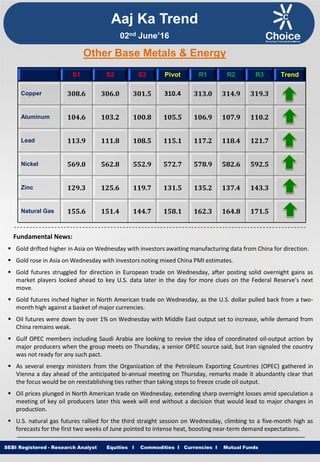
Equities I Commodities I Currencies I Mutual Funds
Aaj Ka Trend
Technical View:
On Hourly chart MCX Gold prices are capped at its horizontal
trend line resistance at 29150 levels. Counter is trading below
its 100 HEMA on hourly chart. Furthermore, Three Black Crow
Bearish candle stick pattern is visible on weekly chart of
COMEX Gold. Moreover, Momentum Indicator RSI has
witnessed negative reversal at 55 levels. For now we expect
prices should move lower towards 28550 levels in the coming
trading sessions.
SEBI Registered - Research Analyst Equities I Commodities I Currencies I Mutual Funds
Bullions
MCX Gold June Hourly Chart CMP: 28630
MCX Gold (Aug) Trend: Bearish
Price potential: 28550 Reversal:29150
MCX Silver July Hourly Chart CMP: 38470
Technical View:
MCX Silver prices are holding stiff resistance of falling trend
line at 38700 levels. On the other hand, MCX Silver prices are
trading below its 50 HEMA which indicates negative
confirmation to the prices. Moreover, momentum indicator
RSI is trading below 50 levels on hourly chart. For now we
expect prices to move lower towards 37600 levels in few
trading sessions.
MCX Silver (July) Trend: Bearish
Price potential: 37600 Reversal: 38850
Pivot levels for the Day
S1 S2 S3 Pivot R1 R2 R3
Gold 28798 28681 28389 28973 29090 29265 29557
Silver 38361 38141 37712 38570 38790 38999 39428
02nd June’16
Equities I Commodities I Currencies I Mutual Funds
Technical View:
On Hourly chart MCX Copper has taken support of its
horizontal trend line at 307.80 levels. Furthermore, Counter
is trading above its 15 HEMA on hourly time frame.
Moreover, Hammer Bullish candlestick pattern is visible on
daily chart. On the other hand, momentum indicator RSI is
showing strength near its support of 40 levels on hourly
chart. For now we expect prices to move higher towards
320 levels in coming trading sessions.
SEBI Registered - Research Analyst Equities I Commodities I Currencies I Mutual Funds
MCX Copper June hourly Chart CMP: 310.55
MCX Copper (June) Trend: Bullish
Price potential: 320 Reversal: 306
MCX Crude Oil June. Hourly Chart CMP: 3307
Technical View:
On Hourly chart MCX Crude Oil prices have given breakdown
of its rising channel formation at 3277 levels. On the other
hand counter is trading below its 100 HEMA on MCX Crude
Oil hourly chart. Furthermore, COMEX Crude prices are
trading below its trend line resistance. Moreover,
Momentum indicator RSI is facing trend line resistance at 50
levels on hourly chart. For now we expect prices to move
lower towards 3220 levels in coming trading sessions.
MCX Crude Oil (June) Trend: Bearish
Price potential: 3220 Reversal: 3360
Pivot levels for the Day
S1 S2 S3 Pivot R1 R2 R3
Copper 308.6 306.0 301.5 310.4 313.0 314.9 319.3
Crude 3251 3199 3112 3286 3338 3373 3460
Base Metal
Energy
Aaj Ka Trend
02nd June’16
Equities I Commodities I Currencies I Mutual FundsSEBI Registered - Research Analyst Equities I Commodities I Currencies I Mutual Funds
Other Base Metals & Energy
S1 S2 S3 Pivot R1 R2 R3 Trend
Copper 308.6 306.0 301.5 310.4 313.0 314.9 319.3
Aluminum 104.6 103.2 100.8 105.5 106.9 107.9 110.2
Lead 113.9 111.8 108.5 115.1 117.2 118.4 121.7
Nickel 569.0 562.8 552.9 572.7 578.9 582.6 592.5
Zinc 129.3 125.6 119.7 131.5 135.2 137.4 143.3
Natural Gas 155.6 151.4 144.7 158.1 162.3 164.8 171.5
Fundamental News:
 Gold drifted higher in Asia on Wednesday with investors awaiting manufacturing data from China for direction.
 Gold rose in Asia on Wednesday with investors noting mixed China PMI estimates.
 Gold futures struggled for direction in European trade on Wednesday, after posting solid overnight gains as
market players looked ahead to key U.S. data later in the day for more clues on the Federal Reserve’s next
move.
 Gold futures inched higher in North American trade on Wednesday, as the U.S. dollar pulled back from a two-
month high against a basket of major currencies.
 Oil futures were down by over 1% on Wednesday with Middle East output set to increase, while demand from
China remains weak.
 Gulf OPEC members including Saudi Arabia are looking to revive the idea of coordinated oil-output action by
major producers when the group meets on Thursday, a senior OPEC source said, but Iran signaled the country
was not ready for any such pact.
 As several energy ministers from the Organization of the Petroleum Exporting Countries (OPEC) gathered in
Vienna a day ahead of the anticipated bi-annual meeting on Thursday, remarks made it abundantly clear that
the focus would be on reestablishing ties rather than taking steps to freeze crude oil output.
 Oil prices plunged in North American trade on Wednesday, extending sharp overnight losses amid speculation a
meeting of key oil producers later this week will end without a decision that would lead to major changes in
production.
 U.S. natural gas futures rallied for the third straight session on Wednesday, climbing to a five-month high as
forecasts for the first two weeks of June pointed to intense heat, boosting near-term demand expectations.
Aaj Ka Trend
02nd June’16
Equities I Commodities I Currencies I Mutual FundsSEBI Registered - Research Analyst Equities I Commodities I Currencies I Mutual Funds
International Market
Commodity Closing Price
Gold 1211.84
Silver 15.93
Crude Oil 48.81
Brent Crude Oil 49.64
Natural Gas 2.38
COMEX/NYMEX/ICE ( Precious Metals & Energy) Currency & Commodity Index
Currency (Spot) Current Price
USD / INR 67.45
Dollar Index 95.42
EUR / USD 1.1187
CRB Index* 186.82
Closing as on 01.06.16 *Closing as on 01.06.16
LME (Base Metals) ( $ per tones)
Commodity Closing Price
Copper 4617
Aluminum 1569
Zinc 1971
Lead 1710
Nickel 8475
SHFE (Base Metals) (Yuan per tones)
Commodity Closing Price
Copper 35240
Aluminum 12250
Zinc 15560
Lead 12750
Closing as on 01.06.16 Closing as on 01.06.16
LME INVENTORY DATA
Aaj Ka Trend
26-May-16 27-May-16 30-May-16 31-May-16 01-June-16
Aluminium -4425 -5900 0 -4900 -8925
Copper 725 -2225 0 -2025 2625
Lead -275 -25 0 225 -100
Nickel -978 1848 0 -978 -258
Zinc -50 -2025 0 -2300 -250
02nd June’16
Equities I Commodities I Currencies I Mutual Funds
This is solely for information of clients of Choice Broking and does not construe to be an investment advice. It is also not intended as an offer or solicitation
for the purchase and sale of any financial instruments. Any action taken by you on the basis of the information contained herein is your responsibility alone
and Choice Broking its subsidiaries or its employees or associates will not be liable in any manner for the consequences of such action taken by you. We
have exercised due diligence in checking the correctness and authenticity of the information contained in this recommendation, but Choice Broking or any of
its subsidiaries or associates or employees shall not be in any way responsible for any loss or damage that may arise to any person from any inadvertent
error in the information contained in this recommendation or any action taken on basis of this information. Technical analysis studies market psychology,
price patterns and volume levels. It is used to forecast future price and market movements. Technical analysis is complementary to fundamental analysis
and news sources. The recommendations issued herewith might be contrary to recommendations issued by Choice Broking in the company research
undertaken as the recommendations stated in this report is derived purely from technical analysis. Choice Broking has based this document on information
obtained from sources it believes to be reliable but which it has not independently verified; Choice Broking makes no guarantee, representation or warranty
and accepts no responsibility or liability as to its accuracy or completeness. The opinions contained within the report are based upon publicly available
information at the time of publication and are subject to change without notice. The information and any disclosures provided herein are in summary form
and have been prepared for informational purposes. The recommendations and suggested price levels are intended purely for trading purposes. The
recommendations are valid for the day of the report however trading trends and volumes might vary substantially on an intraday basis and the
recommendations may be subject to change. The information and any disclosures provided herein may be considered confidential. Any use, distribution,
modification, copying, forwarding or disclosure by any person is strictly prohibited. The information and any disclosures provided herein do not constitute a
solicitation or offer to purchase or sell any security or other financial product or instrument. The current performance may be unaudited. Past performance
does not guarantee future returns. There can be no assurance that investments will achieve any targeted rates of return, and there is no guarantee against
the loss of your entire investment.
POTENTIAL CONFLICT OF INTEREST DISCLOSURE (as on date of report) Disclosure of interest statement – • Analyst interest of the stock
/Instrument(s): - No. • Firm interest of the stock / Instrument (s): - No.
Disclaimer
Contact Us
Amit Pathania
Research Associate
amit.pathania@choiceindia.com
Rohan Patil
Research Associate
rohan.patil@choiceindia.com
www.choiceindia.comcustomercare@choiceindia.com
SEBI Registered - Research Analyst Equities I Commodities I Currencies I Mutual Funds
Aaj Ka Trend
02nd June’16
Neeraj Yadav
Research Advisor
neeraj.yadav@choiceindia.com
Anish Vyas
Senior Research Associate
anish.vyas@choiceindia.com
Anish Vyas
Digitally signed by Anish Vyas
DN: cn=Anish Vyas, o=Choice Merchandise
Broking Pvt. Ltd, ou=Sr. Research Associate,
email=anish.vyas@choiceindia.com, c=IN
Date: 2016.06.02 08:47:51 +05'30'

Aaj ka trend 02.06.16

  • 1.
    Equities I CommoditiesI Currencies I Mutual Funds Aaj Ka Trend Technical View: On Hourly chart MCX Gold prices are capped at its horizontal trend line resistance at 29150 levels. Counter is trading below its 100 HEMA on hourly chart. Furthermore, Three Black Crow Bearish candle stick pattern is visible on weekly chart of COMEX Gold. Moreover, Momentum Indicator RSI has witnessed negative reversal at 55 levels. For now we expect prices should move lower towards 28550 levels in the coming trading sessions. SEBI Registered - Research Analyst Equities I Commodities I Currencies I Mutual Funds Bullions MCX Gold June Hourly Chart CMP: 28630 MCX Gold (Aug) Trend: Bearish Price potential: 28550 Reversal:29150 MCX Silver July Hourly Chart CMP: 38470 Technical View: MCX Silver prices are holding stiff resistance of falling trend line at 38700 levels. On the other hand, MCX Silver prices are trading below its 50 HEMA which indicates negative confirmation to the prices. Moreover, momentum indicator RSI is trading below 50 levels on hourly chart. For now we expect prices to move lower towards 37600 levels in few trading sessions. MCX Silver (July) Trend: Bearish Price potential: 37600 Reversal: 38850 Pivot levels for the Day S1 S2 S3 Pivot R1 R2 R3 Gold 28798 28681 28389 28973 29090 29265 29557 Silver 38361 38141 37712 38570 38790 38999 39428 02nd June’16
  • 2.
    Equities I CommoditiesI Currencies I Mutual Funds Technical View: On Hourly chart MCX Copper has taken support of its horizontal trend line at 307.80 levels. Furthermore, Counter is trading above its 15 HEMA on hourly time frame. Moreover, Hammer Bullish candlestick pattern is visible on daily chart. On the other hand, momentum indicator RSI is showing strength near its support of 40 levels on hourly chart. For now we expect prices to move higher towards 320 levels in coming trading sessions. SEBI Registered - Research Analyst Equities I Commodities I Currencies I Mutual Funds MCX Copper June hourly Chart CMP: 310.55 MCX Copper (June) Trend: Bullish Price potential: 320 Reversal: 306 MCX Crude Oil June. Hourly Chart CMP: 3307 Technical View: On Hourly chart MCX Crude Oil prices have given breakdown of its rising channel formation at 3277 levels. On the other hand counter is trading below its 100 HEMA on MCX Crude Oil hourly chart. Furthermore, COMEX Crude prices are trading below its trend line resistance. Moreover, Momentum indicator RSI is facing trend line resistance at 50 levels on hourly chart. For now we expect prices to move lower towards 3220 levels in coming trading sessions. MCX Crude Oil (June) Trend: Bearish Price potential: 3220 Reversal: 3360 Pivot levels for the Day S1 S2 S3 Pivot R1 R2 R3 Copper 308.6 306.0 301.5 310.4 313.0 314.9 319.3 Crude 3251 3199 3112 3286 3338 3373 3460 Base Metal Energy Aaj Ka Trend 02nd June’16
  • 3.
    Equities I CommoditiesI Currencies I Mutual FundsSEBI Registered - Research Analyst Equities I Commodities I Currencies I Mutual Funds Other Base Metals & Energy S1 S2 S3 Pivot R1 R2 R3 Trend Copper 308.6 306.0 301.5 310.4 313.0 314.9 319.3 Aluminum 104.6 103.2 100.8 105.5 106.9 107.9 110.2 Lead 113.9 111.8 108.5 115.1 117.2 118.4 121.7 Nickel 569.0 562.8 552.9 572.7 578.9 582.6 592.5 Zinc 129.3 125.6 119.7 131.5 135.2 137.4 143.3 Natural Gas 155.6 151.4 144.7 158.1 162.3 164.8 171.5 Fundamental News:  Gold drifted higher in Asia on Wednesday with investors awaiting manufacturing data from China for direction.  Gold rose in Asia on Wednesday with investors noting mixed China PMI estimates.  Gold futures struggled for direction in European trade on Wednesday, after posting solid overnight gains as market players looked ahead to key U.S. data later in the day for more clues on the Federal Reserve’s next move.  Gold futures inched higher in North American trade on Wednesday, as the U.S. dollar pulled back from a two- month high against a basket of major currencies.  Oil futures were down by over 1% on Wednesday with Middle East output set to increase, while demand from China remains weak.  Gulf OPEC members including Saudi Arabia are looking to revive the idea of coordinated oil-output action by major producers when the group meets on Thursday, a senior OPEC source said, but Iran signaled the country was not ready for any such pact.  As several energy ministers from the Organization of the Petroleum Exporting Countries (OPEC) gathered in Vienna a day ahead of the anticipated bi-annual meeting on Thursday, remarks made it abundantly clear that the focus would be on reestablishing ties rather than taking steps to freeze crude oil output.  Oil prices plunged in North American trade on Wednesday, extending sharp overnight losses amid speculation a meeting of key oil producers later this week will end without a decision that would lead to major changes in production.  U.S. natural gas futures rallied for the third straight session on Wednesday, climbing to a five-month high as forecasts for the first two weeks of June pointed to intense heat, boosting near-term demand expectations. Aaj Ka Trend 02nd June’16
  • 4.
    Equities I CommoditiesI Currencies I Mutual FundsSEBI Registered - Research Analyst Equities I Commodities I Currencies I Mutual Funds International Market Commodity Closing Price Gold 1211.84 Silver 15.93 Crude Oil 48.81 Brent Crude Oil 49.64 Natural Gas 2.38 COMEX/NYMEX/ICE ( Precious Metals & Energy) Currency & Commodity Index Currency (Spot) Current Price USD / INR 67.45 Dollar Index 95.42 EUR / USD 1.1187 CRB Index* 186.82 Closing as on 01.06.16 *Closing as on 01.06.16 LME (Base Metals) ( $ per tones) Commodity Closing Price Copper 4617 Aluminum 1569 Zinc 1971 Lead 1710 Nickel 8475 SHFE (Base Metals) (Yuan per tones) Commodity Closing Price Copper 35240 Aluminum 12250 Zinc 15560 Lead 12750 Closing as on 01.06.16 Closing as on 01.06.16 LME INVENTORY DATA Aaj Ka Trend 26-May-16 27-May-16 30-May-16 31-May-16 01-June-16 Aluminium -4425 -5900 0 -4900 -8925 Copper 725 -2225 0 -2025 2625 Lead -275 -25 0 225 -100 Nickel -978 1848 0 -978 -258 Zinc -50 -2025 0 -2300 -250 02nd June’16
  • 5.
    Equities I CommoditiesI Currencies I Mutual Funds This is solely for information of clients of Choice Broking and does not construe to be an investment advice. It is also not intended as an offer or solicitation for the purchase and sale of any financial instruments. Any action taken by you on the basis of the information contained herein is your responsibility alone and Choice Broking its subsidiaries or its employees or associates will not be liable in any manner for the consequences of such action taken by you. We have exercised due diligence in checking the correctness and authenticity of the information contained in this recommendation, but Choice Broking or any of its subsidiaries or associates or employees shall not be in any way responsible for any loss or damage that may arise to any person from any inadvertent error in the information contained in this recommendation or any action taken on basis of this information. Technical analysis studies market psychology, price patterns and volume levels. It is used to forecast future price and market movements. Technical analysis is complementary to fundamental analysis and news sources. The recommendations issued herewith might be contrary to recommendations issued by Choice Broking in the company research undertaken as the recommendations stated in this report is derived purely from technical analysis. Choice Broking has based this document on information obtained from sources it believes to be reliable but which it has not independently verified; Choice Broking makes no guarantee, representation or warranty and accepts no responsibility or liability as to its accuracy or completeness. The opinions contained within the report are based upon publicly available information at the time of publication and are subject to change without notice. The information and any disclosures provided herein are in summary form and have been prepared for informational purposes. The recommendations and suggested price levels are intended purely for trading purposes. The recommendations are valid for the day of the report however trading trends and volumes might vary substantially on an intraday basis and the recommendations may be subject to change. The information and any disclosures provided herein may be considered confidential. Any use, distribution, modification, copying, forwarding or disclosure by any person is strictly prohibited. The information and any disclosures provided herein do not constitute a solicitation or offer to purchase or sell any security or other financial product or instrument. The current performance may be unaudited. Past performance does not guarantee future returns. There can be no assurance that investments will achieve any targeted rates of return, and there is no guarantee against the loss of your entire investment. POTENTIAL CONFLICT OF INTEREST DISCLOSURE (as on date of report) Disclosure of interest statement – • Analyst interest of the stock /Instrument(s): - No. • Firm interest of the stock / Instrument (s): - No. Disclaimer Contact Us Amit Pathania Research Associate amit.pathania@choiceindia.com Rohan Patil Research Associate rohan.patil@choiceindia.com www.choiceindia.comcustomercare@choiceindia.com SEBI Registered - Research Analyst Equities I Commodities I Currencies I Mutual Funds Aaj Ka Trend 02nd June’16 Neeraj Yadav Research Advisor neeraj.yadav@choiceindia.com Anish Vyas Senior Research Associate anish.vyas@choiceindia.com Anish Vyas Digitally signed by Anish Vyas DN: cn=Anish Vyas, o=Choice Merchandise Broking Pvt. Ltd, ou=Sr. Research Associate, email=anish.vyas@choiceindia.com, c=IN Date: 2016.06.02 08:47:51 +05'30'