
Recommended
More Related Content
What's hot
What's hot (20)
Viewers also liked
Viewers also liked (16)
Similar to Aaj ka trend 29.09.16
Similar to Aaj ka trend 29.09.16 (19)
Recently uploaded
Recently uploaded (20)
Aaj ka trend 29.09.16
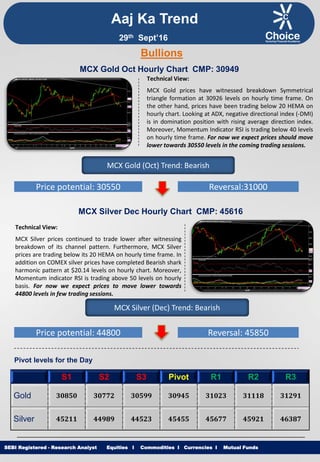
- 1. Equities I Commodities I Currencies I Mutual Funds Aaj Ka Trend Technical View: MCX Gold prices have witnessed breakdown Symmetrical triangle formation at 30926 levels on hourly time frame. On the other hand, prices have been trading below 20 HEMA on hourly chart. Looking at ADX, negative directional index (-DMI) is in domination position with rising average direction index. Moreover, Momentum Indicator RSI is trading below 40 levels on hourly time frame. For now we expect prices should move lower towards 30550 levels in the coming trading sessions. SEBI Registered - Research Analyst Equities I Commodities I Currencies I Mutual Funds Bullions MCX Gold Oct Hourly Chart CMP: 30949 MCX Gold (Oct) Trend: Bearish Price potential: 30550 Reversal:31000 MCX Silver Dec Hourly Chart CMP: 45616 Technical View: MCX Silver prices continued to trade lower after witnessing breakdown of its channel pattern. Furthermore, MCX Silver prices are trading below its 20 HEMA on hourly time frame. In addition on COMEX silver prices have completed Bearish shark harmonic pattern at $20.14 levels on hourly chart. Moreover, Momentum indicator RSI is trading above 50 levels on hourly basis. For now we expect prices to move lower towards 44800 levels in few trading sessions. MCX Silver (Dec) Trend: Bearish Price potential: 44800 Reversal: 45850 Pivot levels for the Day S1 S2 S3 Pivot R1 R2 R3 Gold 30850 30772 30599 30945 31023 31118 31291 Silver 45211 44989 44523 45455 45677 45921 46387 29th Sept’16
- 2. Equities I Commodities I Currencies I Mutual Funds Technical View: On hourly chart MCX Copper has witnessed breakdown of Rising channel formation at 324 levels on hourly time frame. Furthermore, Counter is trading below its 50 HEMA on hourly chart. Moreover, momentum indicator MACD has observed negative crossover on hourly time frame. In addition, Momentum indicator RSI is trading below 50 levels on hourly basis. For now we expect prices to move lower towards 316 levels in coming trading sessions. SEBI Registered - Research Analyst Equities I Commodities I Currencies I Mutual Funds MCX Copper Nov hourly Chart CMP: 324.45 MCX Copper (Nov) Trend: Bearish Price potential: 316 Reversal: 328 MCX Crude Oil Oct. Hourly Chart CMP: 3067 Technical View: MCX Crude Oil prices are trading in a falling channel formation on hourly time frame. Furthermore, Counter is trading below its 20 HEMA on hourly chart. Looking at ADX, negative directional index (-DMI) is in domination position with rising average direction index. Moreover, Momentum indicator RSI is hovering near 50 levels on hourly basis. For now we expect prices to move lower towards 2945 levels in coming trading sessions. MCX Crude Oil (Oct) Trend: Bearish Price potential: 2945 Reversal: 3070 Pivot levels for the Day S1 S2 S3 Pivot R1 R2 R3 Copper 322.4 320.7 317.7 323.7 325.4 326.7 329.7 Crude 2953 2912 2820 3004 3045 3096 3188 Base Metal Energy Aaj Ka Trend 29th Sept’16
- 3. Equities I Commodities I Currencies I Mutual FundsSEBI Registered - Research Analyst Equities I Commodities I Currencies I Mutual Funds Other Base Metals & Energy S1 S2 S3 Pivot R1 R2 R3 Trend Copper 322.4 320.7 317.7 323.7 325.4 326.7 329.7 Aluminum 109.0 108.3 107.1 109.5 110.2 110.7 111.9 Lead 130.8 128.7 125.6 131.9 133.9 135.0 138.2 Nickel 700.5 693.8 682.1 705.5 712.2 717.2 728.9 Zinc 153.5 152.3 150.4 154.3 155.5 156.2 158.2 Natural Gas 195.3 193.2 187.3 199.1 201.2 205.0 210.9 Fundamental News: Gold prices were mostly steady in early Asia on Wednesday as investors navigated a mix of U.S. interest rate and presidential election views, prospects for an OPEC output freeze and an upbeat U.S. survey on consumer confidence. Gold prices trimmed overnight losses during North America's session on Wednesday, but remained in negative territory as market players looked ahead to a handful of Federal Reserve speeches that may offer clues on the timing of future rate hikes. Islamic State militants no longer control any oil wells in Iraq after being ousted by government forces last week from an area near Kirkuk, the oil ministry said on Wednesday. Oil prices rose nearly 2 percent on speculation OPEC members gathered in Algeria could lay the foundation on Wednesday for a production-limiting deal in November, and on the possibility of another draw in U.S. crude stockpiles. Oil prices extended gains in North American hours on Wednesday, rising to the strongest levels of the session after data showed that crude supplies in the U.S. fell for the fourth week in a row. U.S. crude stocks unexpectedly fell in the latest week, official data showed Wednesday. OPEC might still agree an oil output-limiting deal later this year as the economic problems of its de-facto leader Saudi Arabia force Riyadh to cede more ground to arch-rival Iran. U.S. natural gas futures fell to the lowest level in almost two weeks on Wednesday, as market players looked ahead to fresh weekly information on U.S. gas inventories to gauge the strength of demand for the fuel. Aaj Ka Trend 29th Sept’16
- 4. Equities I Commodities I Currencies I Mutual FundsSEBI Registered - Research Analyst Equities I Commodities I Currencies I Mutual Funds International Market Commodity Closing Price Gold 1328.55 Silver 19.33 Crude Oil 47.10 Brent Crude Oil 49.10 Natural Gas 3.03 COMEX/NYMEX/ICE ( Precious Metals & Energy) Currency & Commodity Index Currency (Spot) Current Price USD / INR 66.41 Dollar Index 95.38 EUR / USD 1.12 CRB Index* 185.90 Closing as on 28.09.16 *Closing as on 28.09.16 LME (Base Metals) ( $ per tones) Commodity Closing Price Copper 4833 Aluminum 1653 Zinc 2350 Lead 2011 Nickel 10783 SHFE (Base Metals) (Yuan per tones) Commodity Closing Price Copper 37550 Aluminum 12450 Zinc 17480 Lead 13550 Closing as on 28.09.16 Closing as on 28.09.16 LME INVENTORY DATA Aaj Ka Trend 22-Sept-16 23-Sept-16 26-Sept-16 27-Sept-16 28-Sept-16 Aluminium -8150 -6700 -10701 -10175 7776 Copper -1750 10825 7252 7350 -2402 Lead -200 -25 250 250 -251 Nickel 120 -1686 -854 -504 25 Zinc -300 -1200 -648 -525 -827 29th Sept’16
- 5. Equities I Commodities I Currencies I Mutual Funds This is solely for information of clients of Choice Broking and does not construe to be an investment advice. It is also not intended as an offer or solicitation for the purchase and sale of any financial instruments. Any action taken by you on the basis of the information contained herein is your responsibility alone and Choice Broking its subsidiaries or its employees or associates will not be liable in any manner for the consequences of such action taken by you. We have exercised due diligence in checking the correctness and authenticity of the information contained in this recommendation, but Choice Broking or any of its subsidiaries or associates or employees shall not be in any way responsible for any loss or damage that may arise to any person from any inadvertent error in the information contained in this recommendation or any action taken on basis of this information. Technical analysis studies market psychology, price patterns and volume levels. It is used to forecast future price and market movements. Technical analysis is complementary to fundamental analysis and news sources. The recommendations issued herewith might be contrary to recommendations issued by Choice Broking in the company research undertaken as the recommendations stated in this report is derived purely from technical analysis. Choice Broking has based this document on information obtained from sources it believes to be reliable but which it has not independently verified; Choice Broking makes no guarantee, representation or warranty and accepts no responsibility or liability as to its accuracy or completeness. The opinions contained within the report are based upon publicly available information at the time of publication and are subject to change without notice. The information and any disclosures provided herein are in summary form and have been prepared for informational purposes. The recommendations and suggested price levels are intended purely for trading purposes. The recommendations are valid for the day of the report however trading trends and volumes might vary substantially on an intraday basis and the recommendations may be subject to change. The information and any disclosures provided herein may be considered confidential. Any use, distribution, modification, copying, forwarding or disclosure by any person is strictly prohibited. The information and any disclosures provided herein do not constitute a solicitation or offer to purchase or sell any security or other financial product or instrument. The current performance may be unaudited. Past performance does not guarantee future returns. There can be no assurance that investments will achieve any targeted rates of return, and there is no guarantee against the loss of your entire investment. POTENTIAL CONFLICT OF INTEREST DISCLOSURE (as on date of report) Disclosure of interest statement – • Analyst interest of the stock /Instrument(s): - No. • Firm interest of the stock / Instrument (s): - No. Disclaimer Contact Us Amit Pathania Research Associate amit.pathania@choiceindia.com Rohan Patil Research Associate rohan.patil@choiceindia.com www.choicebroking.incustomercare@choiceindia.com SEBI Registered - Research Analyst Equities I Commodities I Currencies I Mutual Funds Aaj Ka Trend 29th Sept’16 Neeraj Yadav Research Advisor neeraj.yadav@choiceindia.com Anish Vyas Senior Research Associate anish.vyas@choiceindia.com Amit Pathania Digitally signed by Amit Pathania DN: cn=Amit Pathania, o=Choice Equity Broking Pvt. ltd, ou=Research Department, email=amit.pathania@choiceindia.com, c=IN Date: 2016.09.29 08:30:26 +05'30'