
Recommended
More Related Content
What's hot
What's hot (20)
Viewers also liked
Viewers also liked (18)
Similar to Aaj ka trend 12.09.16
Similar to Aaj ka trend 12.09.16 (20)
Recently uploaded
Recently uploaded (20)
Aaj ka trend 12.09.16
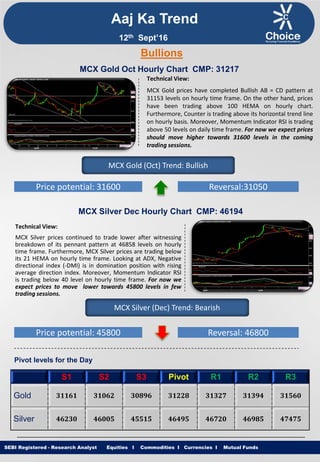
- 1. Equities I Commodities I Currencies I Mutual Funds Aaj Ka Trend Technical View: MCX Gold prices have completed Bullish AB = CD pattern at 31153 levels on hourly time frame. On the other hand, prices have been trading above 100 HEMA on hourly chart. Furthermore, Counter is trading above its horizontal trend line on hourly basis. Moreover, Momentum Indicator RSI is trading above 50 levels on daily time frame. For now we expect prices should move higher towards 31600 levels in the coming trading sessions. SEBI Registered - Research Analyst Equities I Commodities I Currencies I Mutual Funds Bullions MCX Gold Oct Hourly Chart CMP: 31217 MCX Gold (Oct) Trend: Bullish Price potential: 31600 Reversal:31050 MCX Silver Dec Hourly Chart CMP: 46194 Technical View: MCX Silver prices continued to trade lower after witnessing breakdown of its pennant pattern at 46858 levels on hourly time frame. Furthermore, MCX Silver prices are trading below its 21 HEMA on hourly time frame. Looking at ADX, Negative directional index (-DMI) is in domination position with rising average direction index. Moreover, Momentum Indicator RSI is trading below 40 level on hourly time frame. For now we expect prices to move lower towards 45800 levels in few trading sessions. MCX Silver (Dec) Trend: Bearish Price potential: 45800 Reversal: 46800 Pivot levels for the Day S1 S2 S3 Pivot R1 R2 R3 Gold 31161 31062 30896 31228 31327 31394 31560 Silver 46230 46005 45515 46495 46720 46985 47475 12th Sept’16
- 2. Equities I Commodities I Currencies I Mutual Funds Technical View: MCX Copper prices continued to trade above its trend line support on hourly chart. In addition, COMEX Copper is trading near its short term trend line support at $2.08 levels in hourly time frame. Moreover, Counter is trading above its 50 HEMA which indicates strength head on hourly chart. On the other hand, momentum indicator RSI is hovering near 50 levels on hourly chart. For now we expect prices to move higher towards 321 levels in coming trading sessions. SEBI Registered - Research Analyst Equities I Commodities I Currencies I Mutual Funds MCX Copper Nov hourly Chart CMP: 313.65 MCX Copper (Nov) Trend: Bullish Price potential: 321 Reversal: 308.20 MCX Crude Oil Sept. Hourly Chart CMP: 3080 Technical View: MCX Crude Oil witnessed breakout of its Triangle pattern at 3078 levels on hourly time frame. Looking at ADX, Positive directional index (+DMI) is in domination position with rising average direction index. Counter is trading above its 21 HEMA on Hourly time chart. Moreover, Momentum indicator RSI is trading near 60 levels on hourly basis. For now we expect prices to move higher towards 3195 levels in coming trading sessions. MCX Crude Oil (Sept) Trend: Bullish Price potential: 3195 Reversal: 3070 Pivot levels for the Day S1 S2 S3 Pivot R1 R2 R3 Copper 312.4 310.9 308.4 313.5 314.9 316.0 318.6 Crude 3092 3068 3015 3121 3145 3174 3227 Base Metal Energy Aaj Ka Trend 12th Sept’16
- 3. Equities I Commodities I Currencies I Mutual FundsSEBI Registered - Research Analyst Equities I Commodities I Currencies I Mutual Funds Other Base Metals & Energy S1 S2 S3 Pivot R1 R2 R3 Trend Copper 312.4 310.9 308.4 313.5 314.9 316.0 318.6 Aluminum 105.0 104.6 103.9 105.4 105.7 106.1 106.9 Lead 126.5 125.9 124.7 127.1 127.7 128.3 129.5 Nickel 684.4 676.2 662.3 690.1 698.3 704.0 717.9 Zinc 152.7 151.9 150.4 153.3 154.2 154.8 156.2 Natural Gas 186.8 184.7 180.9 188.5 190.6 192.3 196.1 Fundamental News: Gold drifted slightly weaker in early Asia on Friday with consumer prices in China that will be closely watched in the wake of recent mildly upbeat data in trade and manufacturing. Gold edged up as it swung between small gains and losses Friday in Asia after consumer prices in China came in lower than expected, capping recent upbeat data in trade and manufacturing from the country that is the second largest importer of the yellow metal. Gold prices slipped lower on Friday, but losses were expected to remain limited as a globally weaker U.S. dollar continued to lend support to the precious metal. Crude prices held weaker on Friday in Asia as investors took profits on sharp gains following bullish U.S. inventories data and looked ahead to an industry report on rig counts in the U.S. Oil prices edged lower on Friday but were still set for their first weekly gain in three weeks after Russia and Saudi Arabia agreed to work together to help rebalance the markets and after a surprisingly large drawdown in U.S. crude stocks. Oil prices fell on Friday as traders booked profits after a rally in the previous session when government data showed a far larger than expected drawdown in U.S. crude inventories. Iran's steep oil output growth has stalled in the past three months, new data showed, suggesting Tehran might be struggling to fulfill its plans to raise production to new highs while demanding to be excluded from any OPEC deals on supply curbs. The dollar erased losses against the other major currencies in quiet trade on Friday, as no major U.S. economic data was to be released throughout the day but gains were expected to remain limited as declined expectations for a 2016 U.S. rate hike continued to weigh. Aaj Ka Trend 12th Sept’16
- 4. Equities I Commodities I Currencies I Mutual FundsSEBI Registered - Research Analyst Equities I Commodities I Currencies I Mutual Funds International Market Commodity Closing Price Gold 1327.96 Silver 18.95 Crude Oil 45.10 Brent Crude Oil 47.25 Natural Gas 2.838 COMEX/NYMEX/ICE ( Precious Metals & Energy) Currency & Commodity Index Currency (Spot) Current Price USD / INR 66.68 Dollar Index 95.29 EUR / USD 1.1241 CRB Index* 182.53 Closing as on 09.09.16 *Closing as on 09.09.16 LME (Base Metals) ( $ per tones) Commodity Closing Price Copper 4633 Aluminum 1578.50 Zinc 2291 Lead 1902 Nickel 10370 SHFE (Base Metals) (Yuan per tones) Commodity Closing Price Copper 36310 Aluminum 12005 Zinc 17820 Lead 13920 Closing as on 09.09.16 Closing as on 09.09.16 LME INVENTORY DATA Aaj Ka Trend 05-Sept-16 06-Sept-16 07-Sept-16 08-Sept-16 09-Sept-16 Aluminium -6975 -3900 -5450 -6700 -7052 Copper 13725 6450 10300 -1375 12378 Lead 0 -225 -425 200 1148 Nickel -666 138 -744 105 80 Zinc -575 -575 -1350 -175 -1001 12th Sept’16
- 5. Equities I Commodities I Currencies I Mutual Funds This is solely for information of clients of Choice Broking and does not construe to be an investment advice. It is also not intended as an offer or solicitation for the purchase and sale of any financial instruments. Any action taken by you on the basis of the information contained herein is your responsibility alone and Choice Broking its subsidiaries or its employees or associates will not be liable in any manner for the consequences of such action taken by you. We have exercised due diligence in checking the correctness and authenticity of the information contained in this recommendation, but Choice Broking or any of its subsidiaries or associates or employees shall not be in any way responsible for any loss or damage that may arise to any person from any inadvertent error in the information contained in this recommendation or any action taken on basis of this information. Technical analysis studies market psychology, price patterns and volume levels. It is used to forecast future price and market movements. Technical analysis is complementary to fundamental analysis and news sources. The recommendations issued herewith might be contrary to recommendations issued by Choice Broking in the company research undertaken as the recommendations stated in this report is derived purely from technical analysis. Choice Broking has based this document on information obtained from sources it believes to be reliable but which it has not independently verified; Choice Broking makes no guarantee, representation or warranty and accepts no responsibility or liability as to its accuracy or completeness. The opinions contained within the report are based upon publicly available information at the time of publication and are subject to change without notice. The information and any disclosures provided herein are in summary form and have been prepared for informational purposes. The recommendations and suggested price levels are intended purely for trading purposes. The recommendations are valid for the day of the report however trading trends and volumes might vary substantially on an intraday basis and the recommendations may be subject to change. The information and any disclosures provided herein may be considered confidential. Any use, distribution, modification, copying, forwarding or disclosure by any person is strictly prohibited. The information and any disclosures provided herein do not constitute a solicitation or offer to purchase or sell any security or other financial product or instrument. The current performance may be unaudited. Past performance does not guarantee future returns. There can be no assurance that investments will achieve any targeted rates of return, and there is no guarantee against the loss of your entire investment. POTENTIAL CONFLICT OF INTEREST DISCLOSURE (as on date of report) Disclosure of interest statement – • Analyst interest of the stock /Instrument(s): - No. • Firm interest of the stock / Instrument (s): - No. Disclaimer Contact Us Amit Pathania Research Associate amit.pathania@choiceindia.com Rohan Patil Research Associate rohan.patil@choiceindia.com www.choiceindia.comcustomercare@choiceindia.com SEBI Registered - Research Analyst Equities I Commodities I Currencies I Mutual Funds Aaj Ka Trend 12th Sept’16 Neeraj Yadav Research Advisor neeraj.yadav@choiceindia.com Anish Vyas Senior Research Associate anish.vyas@choiceindia.com Anish Vyas Digitally signed by Anish Vyas DN: cn=Anish Vyas, o=Choice Merchandise Broking Pvt. Ltd, ou=Sr. Research Associate, email=anish.vyas@choiceindia.com, c=IN Date: 2016.09.12 09:11:19 +05'30'