
Recommended
More Related Content
What's hot
What's hot (20)
Similar to Aaj ka trend 23.05.16
Similar to Aaj ka trend 23.05.16 (20)
Recently uploaded
Recently uploaded (20)
Aaj ka trend 23.05.16
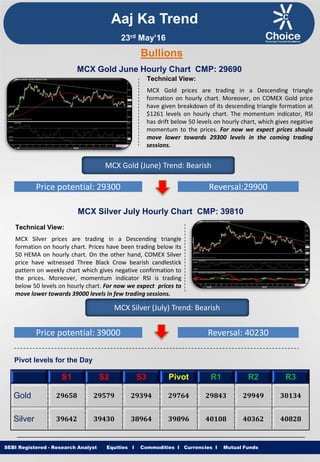
- 1. Equities I Commodities I Currencies I Mutual Funds Aaj Ka Trend Technical View: MCX Gold prices are trading in a Descending triangle formation on hourly chart. Moreover, on COMEX Gold price have given breakdown of its descending triangle formation at $1261 levels on hourly chart. The momentum indicator, RSI has drift below 50 levels on hourly chart, which gives negative momentum to the prices. For now we expect prices should move lower towards 29300 levels in the coming trading sessions. SEBI Registered - Research Analyst Equities I Commodities I Currencies I Mutual Funds Bullions MCX Gold June Hourly Chart CMP: 29690 MCX Gold (June) Trend: Bearish Price potential: 29300 Reversal:29900 MCX Silver July Hourly Chart CMP: 39810 Technical View: MCX Silver prices are trading in a Descending triangle formation on hourly chart. Prices have been trading below its 50 HEMA on hourly chart. On the other hand, COMEX Silver price have witnessed Three Black Crow bearish candlestick pattern on weekly chart which gives negative confirmation to the prices. Moreover, momentum indicator RSI is trading below 50 levels on hourly chart. For now we expect prices to move lower towards 39000 levels in few trading sessions. MCX Silver (July) Trend: Bearish Price potential: 39000 Reversal: 40230 Pivot levels for the Day S1 S2 S3 Pivot R1 R2 R3 Gold 29658 29579 29394 29764 29843 29949 30134 Silver 39642 39430 38964 39896 40108 40362 40828 23rd May’16
- 2. Equities I Commodities I Currencies I Mutual Funds Technical View: MCX Copper Prices are trading in a consolidation formation since last 1 week. However, MCX Copper prices is trading below its 100 HEMA on hourly chart which indicates short term trend remains weak. On the other hand, momentum indicator RSI is trading below 50 levels on hourly chart. Furthermore, momentum indictor MACD has shown negative crossover on hourly chart. For now we expect prices to move lower towards 300 levels in coming trading sessions. SEBI Registered - Research Analyst Equities I Commodities I Currencies I Mutual Funds MCX Copper June hourly Chart CMP: 308.45 MCX Copper (June) Trend: Bearish Price potential: 300 Reversal: 314 MCX Crude Oil June. Hourly Chart CMP: 3276 Technical View: On daily chart, the MCX Crude Oil price has completed a “Bearish AB=CD Harmonic Pattern” at 3330 levels. Moreover prices are trading near its channel trend line resistance. On the other hand counter is trading below its 21 HEMA on NYMEX Crude 4 hour chart. Furthermore momentum indicator RSI is Trading in overbought territory which selling pressure ahead. For now we expect prices to move lower towards 3190 levels in coming trading sessions. MCX Crude Oil (June) Trend: Bearish Price potential: 3190 Reversal: 3330 Pivot levels for the Day S1 S2 S3 Pivot R1 R2 R3 Copper 308.1 306.4 302.0 310.9 312.6 315.3 319.8 Crude 3234 3200 3117 3283 3317 3366 3449 Base Metal Energy Aaj Ka Trend 23rd May’16
- 3. Equities I Commodities I Currencies I Mutual FundsSEBI Registered - Research Analyst Equities I Commodities I Currencies I Mutual Funds Other Base Metals & Energy S1 S2 S3 Pivot R1 R2 R3 Trend Copper 308.1 306.4 302.0 310.9 312.6 315.3 319.8 Aluminum 104.2 103.2 101.3 105.1 106.1 107.0 108.9 Lead 113.1 112.6 111.2 114.0 114.5 115.4 116.8 Nickel 570.2 566.7 556.6 576.8 580.3 586.9 597.0 Zinc 125.1 124.3 122.4 126.1 127.0 128.0 129.8 Natural Gas 136.7 134.5 130.6 138.4 140.6 142.3 146.2 Fundamental News: Gold rebounded in Asia on Friday, edging up from a sharp overnight drop on growing expectations the Federal Reserve will raise interest rates as early as June. Gold prices held steady on Friday, hovering close to a three-week trough as the perspective of a June rate hike in the U.S. and a stronger U.S. dollar continued to weigh on the precious metal. A stronger U.S. dollar usually weighs on gold, as it dampens the metal's appeal as an alternative asset and makes dollar-priced commodities more expensive for holders of other currencies. Crude rose further in Asia on Friday on a rebound from overnight losses with U.S. rig count data later in the day expected to set the tone. Oil prices rose on Friday as turmoil in Nigeria, shale bankruptcies in the United States and a crisis in Venezuela all contributed to tightening supplies. U.S. oil futures were hovering at seven-month highs on Friday, as supply disruptions in Nigeria and Libya lent support to the commodity, although the strong U.S. dollar limited gains. Oil futures bounced back on Friday but were off earlier highs as ongoing supply concerns helped offset the impact of a possible Fed rate hike in June and ample inventories. Fear that the U.S. Federal Reserve may raise rates by next month prompted investors to cash out of long positions in Brent and U.S. crude's West Texas Intermediate (WTI) futures that rallied earlier in the week on oil supply outages. Aaj Ka Trend 23rd May’16
- 4. Equities I Commodities I Currencies I Mutual FundsSEBI Registered - Research Analyst Equities I Commodities I Currencies I Mutual Funds International Market Commodity Closing Price Gold 1251.98 Silver 16.53 Crude Oil 48.41 Brent Crude Oil 48.72 Natural Gas 2.06 COMEX/NYMEX/ICE ( Precious Metals & Energy) Currency & Commodity Index Currency (Spot) Current Price USD / INR 67.44 Dollar Index 95.34 EUR / USD 1.1224 CRB Index* 184.20 Closing as on 20.05.16 *Closing as on 20.05.16 LME (Base Metals) ( $ per tones) Commodity Closing Price Copper 4578 Aluminum 1547 Zinc 1866 Lead 1675 Nickel 8500 SHFE (Base Metals) (Yuan per tones) Commodity Closing Price Copper 35150 Aluminum 12380 Zinc 14865 Lead 12765 Closing as on 20.05.16 Closing as on 20.05.16 LME INVENTORY DATA Aaj Ka Trend 16-May-16 17-May-16 18-May-16 19-May-16 20-May-16 Aluminium -6625 -2050 -4600 -5000 -5575 Copper -2350 -2275 100 1750 -2875 Lead -250 -175 4800 -200 -150 Nickel -5880 -606 -1680 1482 1104 Zinc -325 -575 -1000 -1125 -600 23rd May’16
- 5. Equities I Commodities I Currencies I Mutual Funds This is solely for information of clients of Choice Broking and does not construe to be an investment advice. It is also not intended as an offer or solicitation for the purchase and sale of any financial instruments. Any action taken by you on the basis of the information contained herein is your responsibility alone and Choice Broking its subsidiaries or its employees or associates will not be liable in any manner for the consequences of such action taken by you. We have exercised due diligence in checking the correctness and authenticity of the information contained in this recommendation, but Choice Broking or any of its subsidiaries or associates or employees shall not be in any way responsible for any loss or damage that may arise to any person from any inadvertent error in the information contained in this recommendation or any action taken on basis of this information. Technical analysis studies market psychology, price patterns and volume levels. It is used to forecast future price and market movements. Technical analysis is complementary to fundamental analysis and news sources. The recommendations issued herewith might be contrary to recommendations issued by Choice Broking in the company research undertaken as the recommendations stated in this report is derived purely from technical analysis. Choice Broking has based this document on information obtained from sources it believes to be reliable but which it has not independently verified; Choice Broking makes no guarantee, representation or warranty and accepts no responsibility or liability as to its accuracy or completeness. The opinions contained within the report are based upon publicly available information at the time of publication and are subject to change without notice. The information and any disclosures provided herein are in summary form and have been prepared for informational purposes. The recommendations and suggested price levels are intended purely for trading purposes. The recommendations are valid for the day of the report however trading trends and volumes might vary substantially on an intraday basis and the recommendations may be subject to change. The information and any disclosures provided herein may be considered confidential. Any use, distribution, modification, copying, forwarding or disclosure by any person is strictly prohibited. The information and any disclosures provided herein do not constitute a solicitation or offer to purchase or sell any security or other financial product or instrument. The current performance may be unaudited. Past performance does not guarantee future returns. There can be no assurance that investments will achieve any targeted rates of return, and there is no guarantee against the loss of your entire investment. POTENTIAL CONFLICT OF INTEREST DISCLOSURE (as on date of report) Disclosure of interest statement – • Analyst interest of the stock /Instrument(s): - No. • Firm interest of the stock / Instrument (s): - No. Disclaimer Contact Us Amit Pathania Research Associate amit.pathania@choiceindia.com Rohan Patil Research Associate rohan.patil@choiceindia.com www.choiceindia.comcustomercare@choiceindia.com SEBI Registered - Research Analyst Equities I Commodities I Currencies I Mutual Funds Aaj Ka Trend 23rd May’16 Neeraj Yadav Research Advisor neeraj.yadav@choiceindia.com Anish Vyas Senior Research Associate anish.vyas@choiceindia.com Anish Vyas Digitally signed by Anish Vyas DN: cn=Anish Vyas, o=Choice Merchandise Broking Pvt. Ltd, ou=Sr. Research Associate, email=anish.vyas@choiceindia.com, c=IN Date: 2016.05.23 08:53:24 +05'30'