
Recommended
More Related Content
What's hot
What's hot (20)
Similar to Aaj ka trend 02.08.16
Similar to Aaj ka trend 02.08.16 (15)
Recently uploaded
Recently uploaded (20)
Aaj ka trend 02.08.16
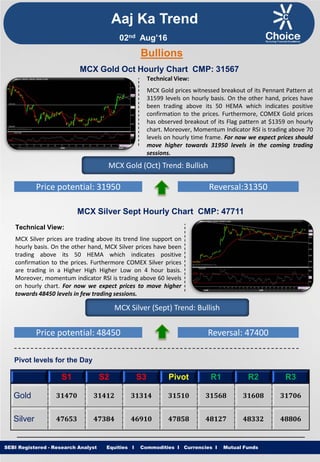
- 1. Equities I Commodities I Currencies I Mutual Funds Aaj Ka Trend Technical View: MCX Gold prices witnessed breakout of its Pennant Pattern at 31599 levels on hourly basis. On the other hand, prices have been trading above its 50 HEMA which indicates positive confirmation to the prices. Furthermore, COMEX Gold prices has observed breakout of its Flag pattern at $1359 on hourly chart. Moreover, Momentum Indicator RSI is trading above 70 levels on hourly time frame. For now we expect prices should move higher towards 31950 levels in the coming trading sessions. SEBI Registered - Research Analyst Equities I Commodities I Currencies I Mutual Funds Bullions MCX Gold Oct Hourly Chart CMP: 31567 MCX Gold (Oct) Trend: Bullish Price potential: 31950 Reversal:31350 MCX Silver Sept Hourly Chart CMP: 47711 Technical View: MCX Silver prices are trading above its trend line support on hourly basis. On the other hand, MCX Silver prices have been trading above its 50 HEMA which indicates positive confirmation to the prices. Furthermore COMEX Silver prices are trading in a Higher High Higher Low on 4 hour basis. Moreover, momentum indicator RSI is trading above 60 levels on hourly chart. For now we expect prices to move higher towards 48450 levels in few trading sessions. MCX Silver (Sept) Trend: Bullish Price potential: 48450 Reversal: 47400 Pivot levels for the Day S1 S2 S3 Pivot R1 R2 R3 Gold 31470 31412 31314 31510 31568 31608 31706 Silver 47653 47384 46910 47858 48127 48332 48806 02nd Aug’16
- 2. Equities I Commodities I Currencies I Mutual Funds Technical View: MCX Copper prices have witnessed breakdown of its Rectangle pattern at 327.50 levels on hourly basis. Moreover, MCX Copper prices are trading below its super trend indicator on hourly chart. Furthermore, counter is trading below its 50 HEMA on hourly time frame. On the other hand, momentum indicator RSI has drift below 40 levels on hourly chart. For now we expect prices to move lower towards 318 levels in coming trading sessions. SEBI Registered - Research Analyst Equities I Commodities I Currencies I Mutual Funds MCX Copper Aug hourly Chart CMP: 325.90 MCX Copper (Aug) Trend: Bearish Price potential: 318 Reversal: 330.50 MCX Crude Oil Aug. Hourly Chart CMP: 2681 Technical View: MCX Crude Oil prices breached its Horizontal trend line support at 2704 levels on hourly time frame. On the other hand prices have been trading below its 50 HEMA on hourly chart. In Addition, COMEX Crude oil prices are trading in Lower Low Lower High formation 4 hour chart. Moreover, Momentum indicator RSI is trading below 30 on hourly chart. For now we expect prices to move lower towards 2620 levels in coming trading sessions. MCX Crude Oil (Aug) Trend: Bearish Price potential: 2620 Reversal: 2750 Pivot levels for the Day S1 S2 S3 Pivot R1 R2 R3 Copper 325.2 323.3 317.7 329.0 330.9 334.6 340.3 Crude 2658 2618 2503 2733 2773 2848 2963 Base Metal Energy Aaj Ka Trend 02nd Aug’16
- 3. Equities I Commodities I Currencies I Mutual FundsSEBI Registered - Research Analyst Equities I Commodities I Currencies I Mutual Funds Other Base Metals & Energy S1 S2 S3 Pivot R1 R2 R3 Trend Copper 325.2 323.3 317.7 329.0 330.9 334.6 340.3 Aluminum 108.8 108.1 106.2 110.0 110.7 111.9 113.8 Lead 121.2 120.6 118.7 122.4 123.1 124.3 126.1 Nickel 713.3 709.4 700.5 718.3 722.2 727.2 736.1 Zinc 150.6 149.8 148.2 151.5 152.2 153.1 154.8 Natural Gas 186.9 185.1 180.4 189.8 191.6 194.5 199.2 Fundamental News: Gold drifted traded flat in Asia on Monday as manufacturing data in China diverged and the New York Fed's William Dudley said market views on interest rates are too pessimistic. Gold prices edged lower in European trade on Monday, as investors looked to buy into rising equity markets rather than purchasing safe-haven assets, but prices held near three-week highs amid waning expectations that the Federal Reserve will raise interest rates anytime soon. Gold prices were slightly lower in North American trade on Monday, after data showed that U.S. construction spending fell for a third straight month in June as outlays dropped across the board. Oil prices struggled near three-month lows in European trade on Monday, as signs of increasing production in the U.S. and rising output among members of the Organization of the Petroleum Exporting Countries weighed. Oil prices fell on Monday, reversing earlier gains, as increases in OPEC production and U.S. oil rig additions continued to weigh on the market. Oil fell by over 1% on Monday after a brief relief from extended losses last month as oversupply concerns still held sway. Oil prices fell back towards April lows in North American trade on Monday, reproaching bear market territory as signs of increasing production in the U.S. and rising output among members of the Organization of the Petroleum Exporting Countries weighed. U.S. natural gas futures declined on Monday, falling for the first time in three sessions as investors locked in gains after prices climbed to a four-week high on Friday. Aaj Ka Trend 02nd Aug’16
- 4. Equities I Commodities I Currencies I Mutual FundsSEBI Registered - Research Analyst Equities I Commodities I Currencies I Mutual Funds International Market Commodity Closing Price Gold 1352.52 Silver 20.42 Crude Oil 40.17 Brent Crude Oil 42.32 Natural Gas 2.77 COMEX/NYMEX/ICE ( Precious Metals & Energy) Currency & Commodity Index Currency (Spot) Current Price USD / INR 66.74 Dollar Index 95.75 EUR / USD 1.1167 CRB Index* 178.21 Closing as on 01.08.16 *Closing as on 01.08.16 LME (Base Metals) ( $ per tones) Commodity Closing Price Copper 4882 Aluminum 1635 Zinc 2267 Lead 1823 Nickel 10735 SHFE (Base Metals) (Yuan per tones) Commodity Closing Price Copper 37850 Aluminum 12270 Zinc 17325 Lead 13970 Closing as on 01.08.16 Closing as on 01.08.16 LME INVENTORY DATA Aaj Ka Trend 26-July-16 27-July-16 28-July-16 29-July-16 01-Aug-16 Aluminium 4975 -6000 -5850 -8825 -9650 Copper -7625 700 -5700 725 625 Lead 6 -75 -25 -50 -50 Nickel -125 1038 -54 -1524 -120 Zinc -200 -1000 -1575 -1400 -1425 02nd Aug’16
- 5. Equities I Commodities I Currencies I Mutual Funds This is solely for information of clients of Choice Broking and does not construe to be an investment advice. It is also not intended as an offer or solicitation for the purchase and sale of any financial instruments. Any action taken by you on the basis of the information contained herein is your responsibility alone and Choice Broking its subsidiaries or its employees or associates will not be liable in any manner for the consequences of such action taken by you. We have exercised due diligence in checking the correctness and authenticity of the information contained in this recommendation, but Choice Broking or any of its subsidiaries or associates or employees shall not be in any way responsible for any loss or damage that may arise to any person from any inadvertent error in the information contained in this recommendation or any action taken on basis of this information. Technical analysis studies market psychology, price patterns and volume levels. It is used to forecast future price and market movements. Technical analysis is complementary to fundamental analysis and news sources. The recommendations issued herewith might be contrary to recommendations issued by Choice Broking in the company research undertaken as the recommendations stated in this report is derived purely from technical analysis. Choice Broking has based this document on information obtained from sources it believes to be reliable but which it has not independently verified; Choice Broking makes no guarantee, representation or warranty and accepts no responsibility or liability as to its accuracy or completeness. The opinions contained within the report are based upon publicly available information at the time of publication and are subject to change without notice. The information and any disclosures provided herein are in summary form and have been prepared for informational purposes. The recommendations and suggested price levels are intended purely for trading purposes. The recommendations are valid for the day of the report however trading trends and volumes might vary substantially on an intraday basis and the recommendations may be subject to change. The information and any disclosures provided herein may be considered confidential. Any use, distribution, modification, copying, forwarding or disclosure by any person is strictly prohibited. The information and any disclosures provided herein do not constitute a solicitation or offer to purchase or sell any security or other financial product or instrument. The current performance may be unaudited. Past performance does not guarantee future returns. There can be no assurance that investments will achieve any targeted rates of return, and there is no guarantee against the loss of your entire investment. POTENTIAL CONFLICT OF INTEREST DISCLOSURE (as on date of report) Disclosure of interest statement – • Analyst interest of the stock /Instrument(s): - No. • Firm interest of the stock / Instrument (s): - No. Disclaimer Contact Us Amit Pathania Research Associate amit.pathania@choiceindia.com Rohan Patil Research Associate rohan.patil@choiceindia.com www.choiceindia.comcustomercare@choiceindia.com SEBI Registered - Research Analyst Equities I Commodities I Currencies I Mutual Funds Aaj Ka Trend 02nd Aug’16 Neeraj Yadav Research Advisor neeraj.yadav@choiceindia.com Anish Vyas Senior Research Associate anish.vyas@choiceindia.com Amit Pathania Digitally signed by Amit Pathania DN: cn=Amit Pathania, o=Choice Equity Broking Pvt. ltd, ou=Research Department, email=amit.pathania@choiceindia.com, c=IN Date: 2016.08.02 08:44:00 +05'30'