
Recommended
More Related Content
What's hot
What's hot (20)
Viewers also liked
Viewers also liked (20)
Similar to Aaj ka trend 20.09.16
Similar to Aaj ka trend 20.09.16 (16)
Recently uploaded
Recently uploaded (20)
Aaj ka trend 20.09.16
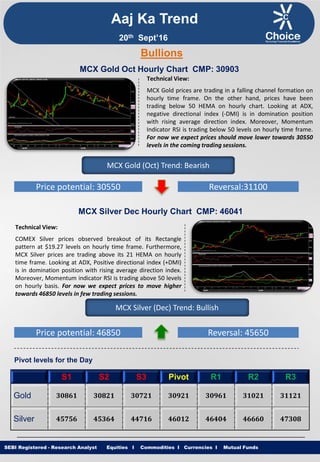
- 1. Equities I Commodities I Currencies I Mutual Funds Aaj Ka Trend Technical View: MCX Gold prices are trading in a falling channel formation on hourly time frame. On the other hand, prices have been trading below 50 HEMA on hourly chart. Looking at ADX, negative directional index (-DMI) is in domination position with rising average direction index. Moreover, Momentum Indicator RSI is trading below 50 levels on hourly time frame. For now we expect prices should move lower towards 30550 levels in the coming trading sessions. SEBI Registered - Research Analyst Equities I Commodities I Currencies I Mutual Funds Bullions MCX Gold Oct Hourly Chart CMP: 30903 MCX Gold (Oct) Trend: Bearish Price potential: 30550 Reversal:31100 MCX Silver Dec Hourly Chart CMP: 46041 Technical View: COMEX Silver prices observed breakout of its Rectangle pattern at $19.27 levels on hourly time frame. Furthermore, MCX Silver prices are trading above its 21 HEMA on hourly time frame. Looking at ADX, Positive directional index (+DMI) is in domination position with rising average direction index. Moreover, Momentum indicator RSI is trading above 50 levels on hourly basis. For now we expect prices to move higher towards 46850 levels in few trading sessions. MCX Silver (Dec) Trend: Bullish Price potential: 46850 Reversal: 45650 Pivot levels for the Day S1 S2 S3 Pivot R1 R2 R3 Gold 30861 30821 30721 30921 30961 31021 31121 Silver 45756 45364 44716 46012 46404 46660 47308 20th Sept’16
- 2. Equities I Commodities I Currencies I Mutual Funds Technical View: On hourly chart MCX Copper is trading in Rectangle formation after witnessing breakout of Consolidation range. Furthermore, Counter is trading above its 21 HEMA on hourly chart. Moreover, MCX Copper has completed Bullish Cypher Harmonic Pattern on daily chart. In addition, Momentum indicator RSI is trading above 50 levels on hourly basis. For now we expect prices to move higher towards 331.50 levels in coming trading sessions. SEBI Registered - Research Analyst Equities I Commodities I Currencies I Mutual Funds MCX Copper Nov hourly Chart CMP: 322.80 MCX Copper (Nov) Trend: Bullish Price potential: 331.50 Reversal: 318 MCX Crude Oil Oct. Hourly Chart CMP: 2898 Technical View: MCX Crude Oil prices have witnessed breakout of its Falling channel formation at 3008 levels on hourly time frame. Looking at ADX, Positive directional index (+DMI) is in domination position with rising average direction index. Furthermore, Counter is trading above its 21 HEMA on hourly chart. Moreover, Momentum indicator RSI is trading above 50 levels on hourly basis. For now we expect prices to move higher towards 3070 levels in coming trading sessions. MCX Crude Oil (Oct) Trend: Bullish Price potential: 3060 Reversal: 2935 Pivot levels for the Day S1 S2 S3 Pivot R1 R2 R3 Copper 321.6 320.3 318.2 322.5 323.7 324.6 326.8 Crude 2970 2933 2875 2991 3028 3049 3107 Base Metal Energy Aaj Ka Trend 20th Sept’16
- 3. Equities I Commodities I Currencies I Mutual FundsSEBI Registered - Research Analyst Equities I Commodities I Currencies I Mutual Funds Other Base Metals & Energy S1 S2 S3 Pivot R1 R2 R3 Trend Copper 321.6 320.3 318.2 322.5 323.7 324.6 326.8 Aluminum 104.7 104.2 103.4 105.1 105.6 105.9 106.8 Lead 129.2 128.1 126.3 130.0 131.1 131.8 133.7 Nickel 658.4 646.5 628.0 665.0 676.9 683.5 702.0 Zinc 148.3 146.5 143.7 149.3 151.1 152.1 154.9 Natural Gas 194.0 192.1 188.4 195.8 197.7 199.5 203.2 Fundamental News: Gold prices gained in Asia on Monday with the stage set this week for the latest Federal Reserve review on rates and on the same day the Bank of Japan expected to detail results of a review on its easing policies. Gold prices were higher during Europe's session on Monday, bouncing off a more than two-week low as investors looked ahead to this week's highly anticipated Federal Reserve policy meeting. Gold prices held on to overnight gains during North America's session on Monday, as the U.S. dollar slipped amid expectations of no rate change from the Federal Reserve this week. Oil prices rose sharply during European hours on Monday, recovering from last week's steep declines, as traders continued to monitor developments before the informal meeting of major oil producing countries later this month. Oil prices rose on Monday from multi-week lows after Venezuela said OPEC and non-OPEC producers were close to a deal to stabilize the market and as clashes in Libya disrupted attempts to boost crude exports. Venezuelan President Nicolas Maduro said on Sunday that OPEC and non-OPEC countries were close to reaching a deal to stabilize oil markets and that he aimed for a deal to be announced this month. Oil was higher Monday as hopes grew about a possible accord among major producers to cap output. Oil prices ticked higher during North American hours on Monday, after Venezuelan President Nicolas Maduro said over the weekend that OPEC and non-OPEC countries were "close" to reaching a deal to stabilize oil markets and that he aimed for a deal to be announced this month. Aaj Ka Trend 20th Sept’16
- 4. Equities I Commodities I Currencies I Mutual FundsSEBI Registered - Research Analyst Equities I Commodities I Currencies I Mutual Funds International Market Commodity Closing Price Gold 1316 Silver 19.23 Crude Oil 43.09 Brent Crude Oil 45.81 Natural Gas 2.943 COMEX/NYMEX/ICE ( Precious Metals & Energy) Currency & Commodity Index Currency (Spot) Current Price USD / INR 66.97 Dollar Index 95.88 EUR / USD 1.1171 CRB Index* 181.63 Closing as on 19.09.16 *Closing as on 19.09.16 LME (Base Metals) ( $ per tones) Commodity Closing Price Copper 4776 Aluminum 1583 Zinc 2251 Lead 1954 Nickel 10150 SHFE (Base Metals) (Yuan per tones) Commodity Closing Price Copper 37230 Aluminum 12095 Zinc 17900 Lead 14410 Closing as on 19.09.16 Closing as on 19.09.16 LME INVENTORY DATA Aaj Ka Trend 13-Sept-16 14-Sept-16 15-Sept-16 16-Sept-16 19-Sept-16 Aluminium -6300 -9250 -625 -6050 -5452 Copper 3602 -1875 -2275 -225 624 Lead 0 0 0 0 301 Nickel -182 84 -6 -840 -110 Zinc -801 -1125 -1100 -1125 -50 20th Sept’16
- 5. Equities I Commodities I Currencies I Mutual Funds This is solely for information of clients of Choice Broking and does not construe to be an investment advice. It is also not intended as an offer or solicitation for the purchase and sale of any financial instruments. Any action taken by you on the basis of the information contained herein is your responsibility alone and Choice Broking its subsidiaries or its employees or associates will not be liable in any manner for the consequences of such action taken by you. We have exercised due diligence in checking the correctness and authenticity of the information contained in this recommendation, but Choice Broking or any of its subsidiaries or associates or employees shall not be in any way responsible for any loss or damage that may arise to any person from any inadvertent error in the information contained in this recommendation or any action taken on basis of this information. Technical analysis studies market psychology, price patterns and volume levels. It is used to forecast future price and market movements. Technical analysis is complementary to fundamental analysis and news sources. The recommendations issued herewith might be contrary to recommendations issued by Choice Broking in the company research undertaken as the recommendations stated in this report is derived purely from technical analysis. Choice Broking has based this document on information obtained from sources it believes to be reliable but which it has not independently verified; Choice Broking makes no guarantee, representation or warranty and accepts no responsibility or liability as to its accuracy or completeness. The opinions contained within the report are based upon publicly available information at the time of publication and are subject to change without notice. The information and any disclosures provided herein are in summary form and have been prepared for informational purposes. The recommendations and suggested price levels are intended purely for trading purposes. The recommendations are valid for the day of the report however trading trends and volumes might vary substantially on an intraday basis and the recommendations may be subject to change. The information and any disclosures provided herein may be considered confidential. Any use, distribution, modification, copying, forwarding or disclosure by any person is strictly prohibited. The information and any disclosures provided herein do not constitute a solicitation or offer to purchase or sell any security or other financial product or instrument. The current performance may be unaudited. Past performance does not guarantee future returns. There can be no assurance that investments will achieve any targeted rates of return, and there is no guarantee against the loss of your entire investment. POTENTIAL CONFLICT OF INTEREST DISCLOSURE (as on date of report) Disclosure of interest statement – • Analyst interest of the stock /Instrument(s): - No. • Firm interest of the stock / Instrument (s): - No. Disclaimer Contact Us Amit Pathania Research Associate amit.pathania@choiceindia.com Rohan Patil Research Associate rohan.patil@choiceindia.com www.choicebroking.incustomercare@choiceindia.com SEBI Registered - Research Analyst Equities I Commodities I Currencies I Mutual Funds Aaj Ka Trend 20th Sept’16 Neeraj Yadav Research Advisor neeraj.yadav@choiceindia.com Anish Vyas Senior Research Associate anish.vyas@choiceindia.com Anish Vyas Digitally signed by Anish Vyas DN: cn=Anish Vyas, o=Choice Merchandise Broking Pvt. Ltd, ou=Sr. Research Associate, email=anish.vyas@choiceindia.com, c=IN Date: 2016.09.20 09:10:34 +05'30'