
Recommended
More Related Content
What's hot
What's hot (20)
Similar to Aaj ka trend 23.08.16
Similar to Aaj ka trend 23.08.16 (16)
Recently uploaded
Recently uploaded (20)
Aaj ka trend 23.08.16
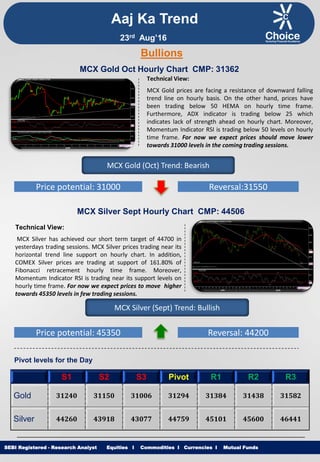
- 1. Equities I Commodities I Currencies I Mutual Funds Aaj Ka Trend Technical View: MCX Gold prices are facing a resistance of downward falling trend line on hourly basis. On the other hand, prices have been trading below 50 HEMA on hourly time frame. Furthermore, ADX indicator is trading below 25 which indicates lack of strength ahead on hourly chart. Moreover, Momentum Indicator RSI is trading below 50 levels on hourly time frame. For now we expect prices should move lower towards 31000 levels in the coming trading sessions. SEBI Registered - Research Analyst Equities I Commodities I Currencies I Mutual Funds Bullions MCX Gold Oct Hourly Chart CMP: 31362 MCX Gold (Oct) Trend: Bearish Price potential: 31000 Reversal:31550 MCX Silver Sept Hourly Chart CMP: 44506 Technical View: MCX Silver has achieved our short term target of 44700 in yesterdays trading sessions. MCX Silver prices trading near its horizontal trend line support on hourly chart. In addition, COMEX Silver prices are trading at support of 161.80% of Fibonacci retracement hourly time frame. Moreover, Momentum Indicator RSI is trading near its support levels on hourly time frame. For now we expect prices to move higher towards 45350 levels in few trading sessions. MCX Silver (Sept) Trend: Bullish Price potential: 45350 Reversal: 44200 Pivot levels for the Day S1 S2 S3 Pivot R1 R2 R3 Gold 31240 31150 31006 31294 31384 31438 31582 Silver 44260 43918 43077 44759 45101 45600 46441 23rd Aug’16
- 2. Equities I Commodities I Currencies I Mutual Funds Technical View: MCX Copper prices are trading in Falling channel formation on hourly chart. Furthermore, COMEX Copper has witnessed breakdown of its Rectangle pattern at $2.14 levels on hourly time frame. Moreover, MCX Copper is trading below its 50 HEMA on hourly chart. On the other hand, momentum indicator RSI is trading below 50 levels on hourly chart. For now we expect prices to move lower towards 310 levels in coming trading sessions. SEBI Registered - Research Analyst Equities I Commodities I Currencies I Mutual Funds MCX Copper Aug hourly Chart CMP: 318.65 MCX Copper (Aug) Trend: Bearish Price potential: 310 Reversal: 323 MCX Crude Oil Sept. Hourly Chart CMP: 3212 Technical View: MCX Crude Oil has achieved our short term target of 3215 in yesterdays trading sessions. MCX Crude oil prices have been witnessed breakdown of its Rising Wedge pattern at 3226 levels on hourly chart. Furthermore, NYMEX WTI Crude Oil has observed breakdown of its falling channel pattern on hourly basis. Moreover, Momentum indicator RSI is trading below 50 levels on hourly chart. For now we expect prices to move lower towards 3145 levels in coming trading sessions. MCX Crude Oil (Sept) Trend: Bearish Price potential: 3145 Reversal: 3270 Pivot levels for the Day S1 S2 S3 Pivot R1 R2 R3 Copper 316.6 314.4 309.9 318.9 321.1 323.4 327.9 Crude 3198 3167 3087 3247 3278 3327 3407 Base Metal Energy Aaj Ka Trend 23rd Aug’16
- 3. Equities I Commodities I Currencies I Mutual FundsSEBI Registered - Research Analyst Equities I Commodities I Currencies I Mutual Funds Other Base Metals & Energy S1 S2 S3 Pivot R1 R2 R3 Trend Copper 316.6 314.4 309.9 318.9 321.1 323.4 327.9 Aluminum 110.9 110.5 109.9 111.2 111.6 111.8 112.5 Lead 123.4 122.7 120.8 124.6 125.3 126.5 128.4 Nickel 681.9 676.9 666.9 686.9 691.9 696.9 706.9 Zinc 152.7 152.0 150.7 153.3 154.0 154.6 155.9 Natural Gas 177.4 174.0 168.7 179.3 182.7 184.6 189.9 Fundamental News: Gold drifted lower in Asia on Monday and silver dropped sharply as investors keep a sharp eye on the prospects for a near-term rate hike by the Federal Reserve. Gold fell further in Asia on Monday and silver dropped sharply as investors noted comments by Federal Reserve Vice Chair Stanley Fischer that appeared to raise prospects for a near-term rate hike by the Federal Reserve. Gold prices were under pressure in European trade on Monday, falling to a two-week low as the U.S. dollar rallied amid indications the Federal Reserve could raise interest rates as early as next month. Gold prices declined in North American trade on Monday, touching a two-week low amid indications the Federal Reserve could raise interest rates as soon as next month. Oil prices snapped a seven-session win streak on Monday, easing off eight-week highs as investors chose to cash in their gains following this month's impressive rally, which analysts warned was not justified by fundamentals. Oil was sharply lower Monday on doubts about a supply freeze accord and as the dollar strengthened. Oil prices fell sharply in North American trade on Monday, extending overnight losses as investors chose to cash in their gains following this month's impressive rally, which analysts warned was not justified by fundamentals. Oil prices fell nearly 3 percent on Monday as China ramped up exports of refined products, U.S. oil producers added rigs for an eighth consecutive week and prospects emerged for increased exports from Iraq and Nigeria. Aaj Ka Trend 23rd Aug’16
- 4. Equities I Commodities I Currencies I Mutual FundsSEBI Registered - Research Analyst Equities I Commodities I Currencies I Mutual Funds International Market Commodity Closing Price Gold 1341.50 Silver 18.96 Crude Oil 46.73 Brent Crude Oil 48.62 Natural Gas 2.66 COMEX/NYMEX/ICE ( Precious Metals & Energy) Currency & Commodity Index Currency (Spot) Current Price USD / INR 67.18 Dollar Index 94.44 EUR / USD 1.133 CRB Index* 187.08 Closing as on 22.08.16 *Closing as on 22.08.16 LME (Base Metals) ( $ per tones) Commodity Closing Price Copper 4753 Aluminum 1658 Zinc 2299 Lead 1850 Nickel 10206 SHFE (Base Metals) (Yuan per tones) Commodity Closing Price Copper 37150 Aluminum 12465 Zinc 17380 Lead 13650 Closing as on 22.08.16 Closing as on 22.08.16 LME INVENTORY DATA Aaj Ka Trend 16-Aug-16 17-Aug-16 18-Aug-16 19-Aug-16 22-Aug-16 Aluminium -2250 18300 18300 -7100 -3500 Copper -1175 7925 7925 -2800 18750 Lead -50 -175 -125 -100 -875 Nickel 4944 -414 -414 -60 180 Zinc -275 -375 -375 -1175 -675 23rd Aug’16
- 5. Equities I Commodities I Currencies I Mutual Funds This is solely for information of clients of Choice Broking and does not construe to be an investment advice. It is also not intended as an offer or solicitation for the purchase and sale of any financial instruments. Any action taken by you on the basis of the information contained herein is your responsibility alone and Choice Broking its subsidiaries or its employees or associates will not be liable in any manner for the consequences of such action taken by you. We have exercised due diligence in checking the correctness and authenticity of the information contained in this recommendation, but Choice Broking or any of its subsidiaries or associates or employees shall not be in any way responsible for any loss or damage that may arise to any person from any inadvertent error in the information contained in this recommendation or any action taken on basis of this information. Technical analysis studies market psychology, price patterns and volume levels. It is used to forecast future price and market movements. Technical analysis is complementary to fundamental analysis and news sources. The recommendations issued herewith might be contrary to recommendations issued by Choice Broking in the company research undertaken as the recommendations stated in this report is derived purely from technical analysis. Choice Broking has based this document on information obtained from sources it believes to be reliable but which it has not independently verified; Choice Broking makes no guarantee, representation or warranty and accepts no responsibility or liability as to its accuracy or completeness. The opinions contained within the report are based upon publicly available information at the time of publication and are subject to change without notice. The information and any disclosures provided herein are in summary form and have been prepared for informational purposes. The recommendations and suggested price levels are intended purely for trading purposes. The recommendations are valid for the day of the report however trading trends and volumes might vary substantially on an intraday basis and the recommendations may be subject to change. The information and any disclosures provided herein may be considered confidential. Any use, distribution, modification, copying, forwarding or disclosure by any person is strictly prohibited. The information and any disclosures provided herein do not constitute a solicitation or offer to purchase or sell any security or other financial product or instrument. The current performance may be unaudited. Past performance does not guarantee future returns. There can be no assurance that investments will achieve any targeted rates of return, and there is no guarantee against the loss of your entire investment. POTENTIAL CONFLICT OF INTEREST DISCLOSURE (as on date of report) Disclosure of interest statement – • Analyst interest of the stock /Instrument(s): - No. • Firm interest of the stock / Instrument (s): - No. Disclaimer Contact Us Amit Pathania Research Associate amit.pathania@choiceindia.com Rohan Patil Research Associate rohan.patil@choiceindia.com www.choiceindia.comcustomercare@choiceindia.com SEBI Registered - Research Analyst Equities I Commodities I Currencies I Mutual Funds Aaj Ka Trend 23rd Aug’16 Neeraj Yadav Research Advisor neeraj.yadav@choiceindia.com Anish Vyas Senior Research Associate anish.vyas@choiceindia.com Amit Pathania Digitally signed by Amit Pathania DN: cn=Amit Pathania, o=Choice Equity Broking Pvt. ltd, ou=Research Department, email=amit.pathania@choiceindia.com, c=IN Date: 2016.08.23 08:32:09 +05'30'