Mulki Call Girls 7001305949 WhatsApp Number 24x7 Best Services
Mphasis 3QFY2010 Results Show Revenue Growth of 4.8
1. 3QFY2010 Result Update | IT
August 26, 2010
Mphasis BUY
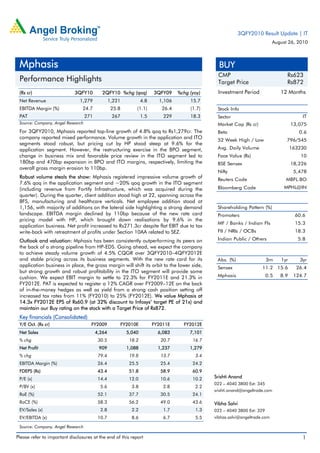
CMP Rs623
Performance Highlights Target Price Rs872
(Rs cr) 3QFY10 2QFY10 %chg (qoq) 3QFY09 %chg (yoy) Investment Period 12 Months
Net Revenue 1,279 1,221 4.8 1,106 15.7
EBITDA Margin (%) 24.7 25.8 (1.1) 26.4 (1.7) Stock Info
PAT 271 267 1.5 229 18.3 Sector IT
Source: Company, Angel Research Market Cap (Rs cr) 13,075
For 3QFY2010, Mphasis reported top-line growth of 4.8% qoq to Rs1,279cr. The Beta 0.6
company reported mixed performance. Volume growth in the application and ITO 52 Week High / Low 796/545
segments stood robust, but pricing cut by HP stood steep at 9.6% for the
application segment. However, the restructuring exercise in the BPO segment, Avg. Daily Volume 163230
change in business mix and favorable price review in the ITO segment led to Face Value (Rs) 10
180bp and 470bp expansion in BPO and ITO margins, respectively, limiting the BSE Sensex 18,226
overall gross margin erosion to 110bp.
Nifty 5,478
Robust volume steals the show: Mphasis registered impressive volume growth of Reuters Code MBFL.BO
7.6% qoq in the application segment and ~20% qoq growth in the ITO segment
(including revenue from Fortify Infrastructure, which was acquired during the Bloomberg Code MPHL@IN
quarter). During the quarter, client addition stood high at 22, spanning across the
BFS, manufacturing and healthcare verticals. Net employee addition stood at
1,156, with majority of additions on the lateral side highlighting a strong demand Shareholding Pattern (%)
landscape. EBITDA margin declined by 110bp because of the new rate card Promoters 60.6
pricing model with HP, which brought down realisations by 9.6% in the
MF / Banks / Indian Fls 15.3
application business. Net profit increased to Rs271.3cr despite flat EBIT due to tax
write-back with retreatment of profits under Section 10AA related to SEZ. FII / NRIs / OCBs 18.3
Outlook and valuation: Mphasis has been consistently outperforming its peers on Indian Public / Others 5.8
the back of a strong pipeline from HP-EDS. Going ahead, we expect the company
to achieve steady volume growth of 4.5% CQGR over 3QFY2010–4QFY2012E
and stable pricing across its business segments. With the new rate card for its Abs. (%) 3m 1yr 3yr
application business in place, the gross margin will shift its orbit to the lower side, Sensex 11.2 15.6 26.4
but strong growth and robust profitability in the ITO segment will provide some
cushion. We expect EBIT margin to settle to 22.3% for FY2011E and 21.3% in Mphasis 0.5 8.9 124.7
FY2012E. PAT is expected to register a 12% CAGR over FY2009–12E on the back
of in-the-money hedges as well as yield from a strong cash position setting off
increased tax rates from 11% (FY2010) to 25% (FY2012E). We value Mphasis at
14.3x FY2012E EPS of Rs60.9 (at 32% discount to Infosys’ target PE of 21x) and
maintain our Buy rating on the stock with a Target Price of Rs872.
Key financials (Consolidated)
Y/E Oct. (Rs cr) FY2009 FY2010E FY2011E FY2012E
Net Sales 4,264 5,040 6,083 7,101
% chg 30.5 18.2 20.7 16.7
Net Profit 909 1,088 1,237 1,279
% chg 79.4 19.8 13.7 3.4
EBITDA Margin (%) 26.4 25.5 25.4 24.2
FDEPS (Rs) 43.4 51.8 58.9 60.9
P/E (x) 14.4 12.0 10.6 10.2 Srishti Anand
022 – 4040 3800 Ext: 345
P/BV (x) 5.6 3.8 2.8 2.2
srishti.anand@angeltrade.com
RoE (%) 52.1 37.7 30.5 24.1
RoCE (%) 58.3 56.2 49.0 43.6 Vibha Salvi
EV/Sales (x) 2.8 2.2 1.7 1.3 022 – 4040 3800 Ext: 329
EV/EBITDA (x) 10.7 8.6 6.7 5.5 vibhas.salvi@angeltrade.com
Source: Company, Angel Research
Please refer to important disclosures at the end of this report 1
2. Mphasis | 3QFY2010 Result Update
Exhibit 1: 3QFY2010 – Consolidated financial statement
% chg % chg
Y/E October (Rs cr) 3QFY2010 2QFY2010 3QFY2009 9MFY2010 9MFY2009 % chg
(qoq) (yoy)
Net Revenue 1,279 1,221 4.8 1,106 15.7 3,691 3,132 17.9
Cost of Revenue 860 808 6.5 699 23.1 2,447 1,966 24.5
Gross Profit 419 413 1.6 407 3.0 1,244 1,166 6.7
SG&A 103 98 5.8 115 (10.1) 300 333 (9.9)
EBITDA 316 315 0.3 292 8.2 944 833 13.4
Depreciation 40 40 0.4 51 (21.4) 126 155 (18.6)
Financial Expenses 0 0 (0) (1) (3)
Other Income / (Expense), Net 18 27 (35.7) 3 455.0 77 22 246.2
Income before Income Taxes 293 302 (3.1) 244 20.1 896 703 27.5
Income Taxes 22 35 (38.1) 15 48.9 89 39 128.4
Net Income 271 267 1.5 229 18.3 807 664 21.6
EPS (Rs) 12.9 12.7 1.7 10.9 18.1 38 32 21.2
Gross Profit Margin (%) 32.8 33.8 36.8 33.7 37.2
EBITDA Margin (%) 24.7 25.8 26.4 25.6 26.6
Net Profit Margin (%) 21.2 21.9 20.7 21.9 21.2
Source: Company, Angel Research
Volume-led growth continues…
Mphasis recorded 4.8% qoq and 15.7% yoy growth, generating overall revenue of
Rs1,279cr in 3QFY2010. This included forex impact of Rs21cr. In USD terms, the
company registered revenue of US $275.6mn, up 1.8% qoq (18.9% yoy).
Exhibit 2: Segment-wise revenue and gross margins
Particulars 3QFY2010 2QFY2010 3QFY2009 Chg (qoq) Chg (yoy)
Net Revenue Break-Up % %
Application Services 826 840 704 (1.7) 17.4
BPO Services 162 163 188 (0.5) (14.0)
ITO Services 291 218 214 33.8 36.3
Total 1,279 1,220 1,106 4.8 15.7
Revenue Mix (%) bp Bp
Application Services 64.6 68.8 63.7 (4.3) 0.9
BPO Services 12.6 13.3 17.0 (0.7) (4.4)
ITO Services 22.8 17.8 19.3 4.9 3.4
Gross Margin Break-Up (%) bp bp
Application Services 29.5 33.3 31.9 (3.8) (2.4)
BPO Services 14.7 12.9 21.1 1.8 (6.4)
ITO Services 39.5 34.8 44.1 4.7 (4.6)
Total 29.9 30.8 32.4 (0.9) (2.5)
Source: Company, Angel Research
August 26, 2010 2
3. Mphasis | 3QFY2010 Result Update
Segment wise, the application business witnessed strong volume growth of 7.3%,
limiting the impact of steep price cuts of 9.6% under the new rate card pricing
model with HP. Also, favorable dollar rate aided revenue growth of 0.6%. Thus,
revenue from the application segment declined by 1.7 % qoq. The ITO business
grew at whopping 33.8% qoq on the back of strong ~20% volume growth. This
was coupled with 12% growth in pricing on account of improved mix with the
acquisition of Fortify Infrastructure (which added Rs27cr to the company’s revenue)
and because of one-time revenue of Rs10cr booked on account of achievement of
certain milestones targeted in the past. The BPO business witnessed a 0.5% qoq
(14% yoy) decline despite flat volume, which was mainly on account of a one-time
outage in one of the telecom clients’ facility. However, the BPO restructuring is on
course and is expected to yield better results in the coming quarters.
Mixed performance in terms of verticals
Growth was driven primarily by the BFS; technology and OEM; and healthcare
and pharma verticals. The company’s telecom vertical was affected by some
technical issues at the BPO client site, which resulted in breach of Service Level
Agreements and loss of revenue. The logistics, airlines and transportation vertical
remained flat, whereas the manufacturing and retail vertical posted laggard
performance, down 2% qoq.
Exhibit 3: Vertical mix
% chg % chg
3QFY2010 2QFY2010 3QFY2009
(qoq) (yoy)
BFS 540 465 456 16.1 18.3
Tech/OEMs 244 216 249 12.7 (2.4)
Telecom 114 168 117 (32.1) (2.3)
Manufacturing and Retail 179 183 143 (1.9) 25.2
Logistics, Airlines,
77 77 56 0.9 38.6
Transport
Healthcare and Pharma 104 79 83 32.7 25.9
Gross Revenue 1258 1187 1104 6.0 13.9
Adjust. from Hedging
21 34 2 (37.9) -
Reserve
Net Revenue 1279 1221 1106 4.8 15.7
Source: Company, Angel Research
Higher margins in ITO and BPO arrested overall margin erosion
Mphasis witnessed a 103bp qoq (403bp yoy) contraction in EBITDA margin in
3QFY2010. During the quarter, the company gave re-compensation payout and
fixed salary hikes, which resulted in a 160bp qoq (430bp yoy) increase in
manpower costs, thereby impacting the company’s margin. Segment wise, the
company’s pricing witnessed a steep cut of 9.6% in the application business,
pulling down the gross margin for the same by 380bp qoq. Overall, gross margin
erosion was limited to 103bp due to a positive effect of restructuring in the BPO
segment and cost optimisation witnessed in the ITO segment by switching to rate
card pricing from the earlier cost plus pricing with HP. Gross margin for the BPO
and ITO segments expanded by 180bp and 470bp qoq, respectively. Thus,
EBITDA margin slipped by only 110bp qoq despite higher selling and marketing
August 26, 2010 3
4. Mphasis | 3QFY2010 Result Update
expenses on account of a one-time write-back in general and administration
expenses of Rs15cr, which contained further erosion in margin.
Improved wallet share in HP channel…
During the quarter, Mphasis witnessed 22 new client wins during the quarter, of
which the application segment won 20 and the BPO and ITO segments won one
each. These wins were witnessed mainly in the BFS, healthcare and manufacturing
verticals.
The HP channel is yielding fruits as reflected by higher-end migrations across
client pyramid. During the quarter, the company witnessed addition of one client
in over US $20mn category; three additions in over US $5mn category; and four
additions in over US $1mn category.
The direct channel witnessed migration of one client from over US $5mn category
to over US $1mn category in 3QFY2010.
Exhibit 4: Client wise revenue contribution
% chg % chg
Client-wise revenue (Rs cr) 3QFY2010 2QFY2010 3QFY2009
(qoq) (yoy)
Top Client Revenue 140.7 134.3 154.8 4.8 (9.1)
% Contribution 11.0 11.0 14.0
Top 5 Revenue 370.9 366.2 364.8 1.3 1.7
% Contribution 29.0 30.0 33.0
Top 10 Revenue 575.6 549.2 508.6 4.8 13.2
% Contribution 45.0 45.0 46.0
Top 20 Revenue 685.5 756.7 793.0 (9.4) (13.6)
% Contribution 62.0 62.0 62.0
Source: Company, Angel Research
Exhibit 5: HP and Non-HP client break-up
Addition Addition
No. of clients 3QFY2010 2QFY2010 3QFY2009
(qoq) (yoy)
> US $1mn Revenue 109 106 100 3 9
Direct Channel 34 35 38 (1) (4)
HP Channel 75 71 62 4 13
> US $5mn Revenue 39 37 31 2 8
Direct Channel 11 12 13 (1) (2)
HP Channel 28 25 18 3 10
> US $10mn Revenue 22 22 20 - 2
Direct Channel 9 9 10 - (1)
HP Channel 13 13 10 - 3
> US $20mn Revenue 13 11 8 2 5
Direct Channel 3 2 3 1 -
HP Channel 10 9 5 1 5
Source: Company, Angel Research
August 26, 2010 4
5. Mphasis | 3QFY2010 Result Update
Hiring spree continues to brace strong pipeline…
Mphasis added 524 employees in the application segment, with 302 people
onsite indicating impending kick-off in some projects. The ITO segment also
added 753 people offshore, envisaging a strong demand pipeline, and 211
people onsite, largely related to absorption of Fortify Infrastructure’s manpower.
Exhibit 6: Employee matrices
Net add. Net add.
No. of employees 3QFY2010 2QFY2010 3QFY2009
(qoq) (yoy)
Application Services 14,578 14,054 11,369 524 3,209
BPO Services 16,424 16,756 16,391 (332) 33
ITO Services 7,273 6,309 4,993 964 2,280
Total 38,275 37,119 32,753 1,156 5,522
Source: Company, Angel Research
Investment arguments
HP business to stabilise, as price uncertainty is now over
During the quarter, Mphasis demonstrated strong volume growth, primarily
because of the BFS spending wave. The company’s growth has been phenomenal
as it continues to enjoy the benefits of offshoring by HP. The flip side to this
Master-level Service Agreement is the kind of pricing cut witnessed by the
company in 3QFY2010 in the application business. However, increased pricing in
the ITO segment came in as a surprise for the company in 3QFY2010. The major
pricing review overhang is done and dusted and, going forward, management
expects a stable pricing arrangement with HP given that the 50% of rate card
pricing will remain fixed and 50% will be market driven. In case of the ITO
segment, which is primarily HP-driven, the rate card has proved favorable and,
with the acquisition of Fortify, will help to manage cost due to its remote
infrastructure services. Thus, we believe HP’s strong parentage would continue to
support and provide increased business opportunities to Mphasis.
Focus on Non-HP business and M&As vital for growth
Management has appointed Boston Consulting Group for reviewing the overall
organisational performance and for enhancing the company’s growth trajectory in
the Non-HP business going forward. This initiative coupled with the effective rate
card implementation, which has witnessed cost optimisation, would certainly see
improved operational performance for Mphasis going ahead. Mphasis has strong
cash position of Rs1,487cr as on date, which would help it to go for acquisitions of
strategic fit in the size of US $50mn–$100mn annual revenue run rate.
August 26, 2010 5
6. Mphasis | 3QFY2010 Result Update
Outlook and valuation
Mphasis has been consistently outperforming its peers on the back of a strong
pipeline from HP-EDS. We assume the company’s ITO business to be the major
beneficiary of HP’s restructuring exercise. Further, we expect the ITO business to
scale up due to the acquisition of Fortify Infrastructure, growing at a scorching
pace of 7% CQGR over 3QFY2010–4QFY2012E, followed by the application
business, which will likely grow at a 5% CQGR over the same period. Going
ahead, we expect the company to achieve steady volume growth of 4.5% CQGR,
with stable pricing across its business segments. With the new rate card in place
for its application business, gross margin will shift its orbit to the lower side, but
strong growth and robust profitability in the ITO segment will provide some
cushion. With fixed rate card in place for the ITO segment, cost pressures will play
out and EBIT margin will slip. Hence, we expect EBIT margin to settle to 22.3% for
FY2011E and FY2012E from 21.3% in FY2010. PAT is expected to increase at a
12% CAGR over FY2009–12E on the back of in-the-money hedges as well as yield
from a strong cash position setting off increased tax rates from 11% (FY2010) to
25% (FY2012E). We value the stock at 14.3x FY2012E EPS of Rs60.9 (at 32%
discount to Infosys’ target PE of 21x) and maintain our Buy rating on the stock with
a Target Price of Rs872.
Exhibit 7: Key assumptions
FY2011E FY2012E
Volume Growth (%) 19.6 16.7
Pricing Growth (%) 0.0 0.0
Revenue Growth - USD terms (%) 19.6 16.7
USD-INR Rate (realised) 46.5 46.5
Revenue Growth - INR terms (%) 20.7 16.7
EBITDA Margin (%) 25.5 24.2
Tax Rate (%) 17.0 25.0
EPS Growth (%) 13.7 3.4
Source: Company, Angel Research
Exhibit 8: Change in estimates
FY2011E FY2012E
Earlier Revised Earlier Revised
Var(%) Var(%)
estimates estimates estimates estimates
Net Revenues 5,990 6,083 1.5 7,043 7,101 0.8
EBITDA 1,511 1,546 2.3 1,795 1,717 (4.4)
PBT 1,377 1,493 8.4 1,649 1,706 3.4
Tax 234 256 9.2 297 426 43.7
PAT 1,143 1,237 8.3 1,352 1,279 (5.4)
Source: Company, Angel Research
We have changed our estimates for FY2011E from Rs54.5 to Rs59.0 and for
FY2012E from Rs64.5 to Rs61.0 as we expect strong volume growth in the ITO
segment and favorable price points to aid margins. In FY2012E, we believe strong
hiring with cost inflation and fixed rate card system will cease the cushion benefit
given by the ITO segment. Hence, profitability growth in FY2012E will be limited.
August 26, 2010 6
12. Mphasis | 3QFY2010 Result Update
Research Team Tel: 022 - 4040 3800 E-mail: research@angeltrade.com Website: www.angeltrade.com
DISCLAIMER
This document is solely for the personal information of the recipient, and must not be singularly used as the basis of any investment
decision. Nothing in this document should be construed as investment or financial advice. Each recipient of this document should make
such investigations as they deem necessary to arrive at an independent evaluation of an investment in the securities of the companies
referred to in this document (including the merits and risks involved), and should consult their own advisors to determine the merits and
risks of such an investment.
Angel Broking Limited, its affiliates, directors, its proprietary trading and investment businesses may, from time to time, make
investment decisions that are inconsistent with or contradictory to the recommendations expressed herein. The views contained in this
document are those of the analyst, and the company may or may not subscribe to all the views expressed within.
Reports based on technical and derivative analysis center on studying charts of a stock's price movement, outstanding positions and
trading volume, as opposed to focusing on a company's fundamentals and, as such, may not match with a report on a company's
fundamentals.
The information in this document has been printed on the basis of publicly available information, internal data and other reliable
sources believed to be true, but we do not represent that it is accurate or complete and it should not be relied on as such, as this
document is for general guidance only. Angel Broking Limited or any of its affiliates/ group companies shall not be in any way
responsible for any loss or damage that may arise to any person from any inadvertent error in the information contained in this report.
Angel Broking Limited has not independently verified all the information contained within this document. Accordingly, we cannot testify,
nor make any representation or warranty, express or implied, to the accuracy, contents or data contained within this document. While
Angel Broking Limited endeavours to update on a reasonable basis the information discussed in this material, there may be regulatory,
compliance, or other reasons that prevent us from doing so.
This document is being supplied to you solely for your information, and its contents, information or data may not be reproduced,
redistributed or passed on, directly or indirectly.
Angel Broking Limited and its affiliates may seek to provide or have engaged in providing corporate finance, investment banking or
other advisory services in a merger or specific transaction to the companies referred to in this report, as on the date of this report or in
the past.
Neither Angel Broking Limited, nor its directors, employees or affiliates shall be liable for any loss or damage that may arise from or in
connection with the use of this information.
Note: Please refer to the important `Stock Holding Disclosure' report on the Angel website (Research Section). Also, please
refer to the latest update on respective stocks for the disclosure status in respect of those stocks. Angel Broking Limited and
its affiliates may have investment positions in the stocks recommended in this report.
Disclosure of Interest Statement Mphasis
1. Analyst ownership of the stock No
2. Angel and its Group companies ownership of the stock Yes
3. Angel and its Group companies' Directors ownership of the stock No
4. Broking relationship with company covered No
Note: We have not considered any Exposure below Rs 1 lakh for Angel, its Group companies and Directors.
Ratings (Returns): Buy (> 15%) Accumulate (5% to 15%) Neutral (-5 to 5%)
Reduce (-5% to 15%) Sell (< -15%)
August 26, 2010 12