Interimreport1 January–31 March2024 Elo Mutual Pension Insurance Company
SpiceJet
1. 1QFY2011 Result Update | Airlines
July 28, 2010
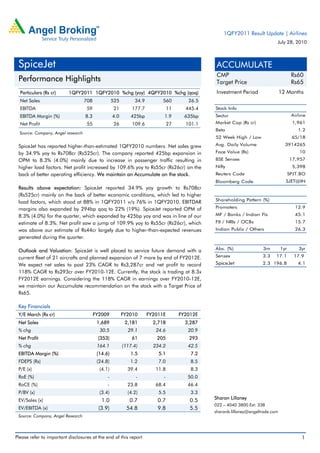
SpiceJet ACCUMULATE
CMP Rs60
Performance Highlights Target Price Rs65
Particulars (Rs cr) 1QFY2011 1QFY2010 %chg (yoy) 4QFY2010 %chg (qoq) Investment Period 12 Months
Net Sales 708 525 34.9 560 26.5
EBITDA 59 21 177.7 11 445.4 Stock Info
EBITDA Margin (%) 8.3 4.0 425bp 1.9 635bp Sector Airline
Net Profit 55 26 109.6 27 101.1 Market Cap (Rs cr) 1,961
Beta 1.2
Source: Company, Angel research
52 Week High / Low 65/18
SpiceJet has reported higher-than-estimated 1QFY2010 numbers. Net sales grew Avg. Daily Volume 3914265
by 34.9% yoy to Rs708cr (Rs525cr). The company reported 425bp expansion in Face Value (Rs) 10
OPM to 8.3% (4.0%) mainly due to increase in passenger traffic resulting in BSE Sensex 17,957
higher load factors. Net profit increased by 109.6% yoy to Rs55cr (Rs26cr) on the Nifty 5,398
back of better operating efficiency. We maintain an Accumulate on the stock. Reuters Code SPJT.BO
Bloomberg Code SJET@IN
Results above expectation: SpiceJet reported 34.9% yoy growth to Rs708cr
(Rs525cr) mainly on the back of better economic conditions, which led to higher
Shareholding Pattern (%)
load factors, which stood at 88% in 1QFY2011 v/s 76% in 1QFY2010. EBITDAR
margins also expanded by 294bp qoq to 22% (19%). SpiceJet reported OPM of Promoters 12.9
8.3% (4.0%) for the quarter, which expanded by 425bp yoy and was in line of our MF / Banks / Indian Fls 45.1
estimate of 8.3%. Net profit saw a jump of 109.9% yoy to Rs55cr (Rs26cr), which FII / NRIs / OCBs 15.7
was above our estimate of Rs44cr largely due to higher-than-expected revenues Indian Public / Others 26.3
generated during the quarter.
Abs. (%) 3m 1yr 3yr
Outlook and Valuation: SpiceJet is well placed to service future demand with a
current fleet of 21 aircrafts and planned expansion of 7 more by end of FY2012E. Sensex 3.3 17.1 17.9
We expect net sales to post 23% CAGR to Rs3,287cr and net profit to record SpiceJet 2.3 196.8 4.1
118% CAGR to Rs293cr over FY2010-12E. Currently, the stock is trading at 8.3x
FY2012E earnings. Considering the 118% CAGR in earnings over FY2010-12E,
we maintain our Accumulate recommendation on the stock with a Target Price of
Rs65.
Key Financials
Y/E March (Rs cr) FY2009 FY2010 FY2011E FY2012E
Net Sales 1,689 2,181 2,718 3,287
% chg 30.5 29.1 24.6 20.9
Net Profit (353) 61 205 293
% chg 164.1 (117.4) 234.2 42.5
EBITDA Margin (%) (14.6) 1.5 5.1 7.2
FDEPS (Rs) (24.8) 1.2 7.0 8.5
P/E (x) (4.1) 39.4 11.8 8.3
RoE (%) - - - 50.0
RoCE (%) - 23.8 68.4 46.4
P/BV (x) (3.4) (4.2) 5.5 3.3
Sharan Lillaney
EV/Sales (x) 1.0 0.7 0.7 0.5
022 – 4040 3800 Ext: 338
EV/EBITDA (x) (3.9) 54.8 9.8 5.5
sharanb.lillaney@angeltrade.com
Source: Company, Angel Research
Please refer to important disclosures at the end of this report 1
3. SpiceJet | 1QFY2011 Result Update
Revenues up 34.9%, substantially above expectation: The company’s net sales
grew by 34.9% yoy to Rs708cr (Rs525cr) for the quarter, driven by strong
passenger growth, which increased by 29% yoy to 2.06mn Pax (1.6mn Pax). On
qoq basis, the company managed a substantial 26.5% growth in revenues which
was above our estimates of Rs642cr. During the quarter, departures increased by
11% yoy to 12,181 (10.974) largely due to the addition of two new aircraft during
the year. The average number of aircraft increased from 19 to 20.3 during the
quarter.
Exhibit 4: Sales trend
(Rs cr) (%)
800 50
700 40
708
600 642 30
500 560
525 20
400 449
10
300
0
200
100 -10
- -20
1QFY2010 2QFY2010 3QFY2010 4QFY2010 1QFY2011
Net Sales (LHS) Growth qoq Growth yoy
Source: Company, Angel Research
OPM expanded yoy on back of higher load factors: SpiceJet reported OPM of
8.3% (4.0%) for the quarter, which expanded by 425bp and was in line with our
estimate of 8.3%. On a qoq basis too, the company managed to increase its OPM
by 635bp on back of higher load factors to 88% ( 80% in 4QFY2010 and 76% in
1QFY2010), which resulted in an increase in Revenue/ASKM, which stood at
Rs2.99 v/s Rs2.62 in 4QFY2010.
Exhibit 5: OPM trend
20
15
10
5
0
(%)
(5) 1QFY2010 2QFY2010 3QFY2010 4QFY2010 1QFY2011
(10)
(15)
(20)
(25)
(30)
Source: Company, Angel Research
July 28, 2010 3
4. SpiceJet | 1QFY2011 Result Update
Bottom-line increased on improved operating efficiency: In 1QFY2010, SpiceJet
reported net profit of Rs55cr (Rs26cr), up 109.6% yoy, on the back of higher
revenues generated during the quarter due to higher load factors. On a qoq basis
also net profit jumped by 101.1% as 4Q is usually the weakest quarter in a fiscal
for the airline industry.
Exhibit 6: Strong turnaround in net profit
(Rs cr) (%)
150 20
15
100
10
50 5
0
-
(5)
1QFY2010 2QFY2010 3QFY2010 4QFY2010 1QFY2011
(50) (10)
(15)
(100)
(20)
(150) (25)
Net Profit (LHS) NPM (RHS)
Source: Company, Angel Research
July 28, 2010 4
5. SpiceJet | 1QFY2011 Result Update
Investment Rationale
Load factors expected to remain healthy: Driven by huge losses, most airlines
reduced their fleet and no new capacities were added since FY2009. With FCCs
like Air India and Kingfisher still making huge losses, and Jet Airways barely
breaking even, we expect negligible fleet additions over FY2011-12E. But demand
had bounced back sharply in FY2010 and the low-cost carriers (LCCs) have been
reporting 80%+ load factors. Given that the demand is expected to outpace
supply, the load factor for the whole industry is expected to remain around 77% for
FY2011E.
Higher load factor to increase profitability: With the aviation industry is
characterised by very high operating leverage, an improvement in the load factor
is expected to drive a substantial spurt in profit. With 88% (76%) load factor,
SpiceJet's net profit shot up to Rs55cr in 1QFY2011 v/s Rs26cr in 1QFY2010.
Additionally, aided by strong fleet addition (19% CAGR over FY2010-12E), we
expect SpiceJet's net profit to post 118% CAGR in the mentioned period to
Rs293cr.
Increasing fleet and strengthening balance sheet: SpiceJet currently has 21 aircraft
and is one of the few airline companies that will expand its fleet size in the coming
years. It is expected to add another 7 aircraft by FY2012E - three in FY2011E and
four in FY2012E. The company has also placed an order for another 30 aircraft,
which will be delivered during 2014 - 2018. We also estimate the company to
build strong cash reserve of Rs535cr in FY2011E and Rs864cr by FY2012E. In a
worst-case scenario, even if SpiceJet witnesses a load factor of just 50% (lowest
load factor till date of 67% in FY2009), it would have enough cash to sustain its
operational expenditure for seven months, without diluting equity. As most of the
US $79.8mn FCCBs are converted and the remaining will be converted by
December 2010, the company’s balance sheet will only further strengthen, with a
net worth of Rs732cr in FY2012E.
Outlook and Valuation
SpiceJet is well placed to service future demand with its current fleet of 21 aircraft
and planned expansion of seven more by end of FY2012E. We expect net sales to
post 23% CAGR to Rs3,287cr and net profit to record 118% CAGR to Rs293cr over
FY2010-12E. Currently, the stock is trading at 8.3x FY2012E earnings.
Considering the 118% CAGR in earnings over FY2010-12E, we maintain an
Accumulate on the stock, with a Target Price of Rs65
Exhibit 7: Key assumptions
Estimates
(%) FY2011 FY2012
Sales Growth 24.6 20.9
Load Factor 79.0 79.0
EBITDAR Margins 23.3 24.8
EBITDA Margins 7.0 8.5
Net Profit Margins 7.6 8.9
Source: Company, Angel Research
July 28, 2010 5
10. SpiceJet | 1QFY2011 Result Update
Research Team Tel: 022 - 4040 3800 E-mail: research@angeltrade.com Website: www.angeltrade.com
DISCLAIMER
Research Team Tel: 022 - 4040 3800 E-mail: research@angeltrade.com Website: www.angeltrade.com
This document is solely for the personal information of the recipient, and must not be singularly used as the basis of any investment
DISCLAIMER
decision. Nothing in this document should be construed as investment or financial advice. Each recipient of this document should make
such investigations as they deem necessary to arrive at an independent evaluation of an investment in the securities of the companies
referred to in this document the personal information of the recipient, and must not be singularly advisors thedetermineany merits and
This document is solely for (including the merits and risks involved), and should consult their own used as to basis of the investment
risks of such an investment.
decision. Nothing in this document should be construed as investment or financial advice. Each recipient of this document should make
such investigations as they deem necessary to arrive at an independent evaluation of an investment in the securities of the companies
Angel Broking Limited, its affiliates, directors, its proprietary trading and investment businesses may, from time to time, make
referred to in this document (including the merits and risks involved), and should consult their own advisors to determine the merits and
investment decisions that are inconsistent with or contradictory to the recommendations expressed herein. The views contained in this
risks of such an investment.
document are those of the analyst, and the company may or may not subscribe to all the views expressed within.
Angel Broking Limited, its affiliates, directors, its proprietary trading and investment businesses may, from time to time, make
Reports based on technical and derivative analysis center on studying charts of a stock's price movement, outstanding positions and
investment decisions that are inconsistent with or contradictory to the recommendations expressed herein. The views contained in this
trading volume, as opposed to focusing on a company's fundamentals and, as such, may not match with a report on a company's
document are those of the analyst, and the company may or may not subscribe to all the views expressed within.
fundamentals.
Reports based on technical and derivative analysis center on studying charts of a stock's price movement, outstanding positions and
The information in this document has been printed on the basis of publicly available information, internal data and other reliable
trading volume, as opposed to focusing on a company's fundamentals and, as such, may not match with a report on a company's
sources believed to be true, but we do not represent that it is accurate or complete and it should not be relied on as such, as this
fundamentals.
document is for general guidance only. Angel Broking Limited or any of its affiliates/ group companies shall not be in any way
responsible for any loss or damage that may arise to any person from any inadvertent error in the information contained in this report.
The information in this document has been printed on the basis of publicly available information, internal data and other reliable
Angel Broking Limited has not independently verified all the information contained within this document. Accordingly, we cannot testify,
sources believed to be true, but we do not represent that it is accurate or complete and it should not be relied on as such, as this
nor make any representation or warranty, express or implied, to the accuracy, contents or data contained within this document. While
document is for general guidance only. Angel Broking Limited or any of its affiliates/ group companies shall not be in any way
Angel Broking Limited endeavours to update on a reasonable basis the information discussed in this material, there may be regulatory,
responsible for any loss or damage that may arise to any person from any inadvertent error in the information contained in this report.
compliance, or other reasons that prevent us from doing so.
Angel Broking Limited has not independently verified all the information contained within this document. Accordingly, we cannot testify,
This make any representation or warranty,solely foror implied, to the accuracy, contents, or data contained within this document. While
nor document is being supplied to you express your information, and its contents information or data may not be reproduced,
redistributed orLimited endeavours to update on a reasonable basis the information discussed in this material, there may be regulatory,
Angel Broking passed on, directly or indirectly.
compliance, or other reasons that prevent us from doing so.
Angel Broking Limited and its affiliates may seek to provide or have engaged in providing corporate finance, investment banking or
This document is being supplied to you solely for your information, and its contents, information or data may not be reproduced,
other advisory services in a merger or specific transaction to the companies referred to in this report, as on the date of this report or in
redistributed or passed on, directly or indirectly.
the past.
Angel Broking Limited and its affiliates may seek to provide or have engaged in providing corporate finance, investment banking or
Neither Angel Broking Limited, nor its directors, employees or affiliates shall be liable for any loss or damage that may arise from or in
other advisory services in a merger or specific transaction to the companies referred to in this report, as on the date of this report or in
connection with the use of this information.
the past.
Note: Please refer to the important `Stock Holding Disclosure' report on the Angel website (Research Section). Also, please
Neither Angel Broking Limited, nor its directors, employees or affiliates shall be liable for any loss or damage that may arise from or in
refer to the latest update on respective stocks for the disclosure status in respect of those stocks. Angel Broking Limited and
connection with the use of this information.
its affiliates may have investment positions in the stocks recommended in this report.
Note: Please refer to the important `Stock Holding Disclosure' report on the Angel website (Research Section). Also, please
Disclosure of Interest Statement SpiceJet
1. Analyst ownership of the stock No
2. Angel and its Group companies ownership of the stock Yes
3. Angel and its Group companies' Directors ownership of the stock No
4. Broking relationship with company covered No
Note: We have not considered any Exposure below Rs 1 lakh for Angel, its Group companies and Directors.
Ratings (Returns) : Buy (> 15%) Accumulate (5% to 15%) Neutral (-5 to 5%)
Reduce (-5% to 15%) Sell (< -15%)
July 28, 2010 10