Andheri Call Girls In 9825968104 Mumbai Hot Models
Tcs Result Update
1. 1QFY2011 Result Update | IT
July 16, 2010
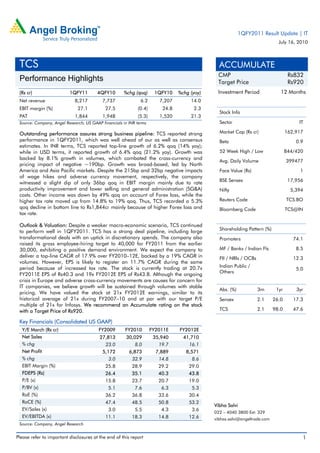
TCS ACCUMULATE
CMP Rs832
Performance Highlights Target Price Rs920
(Rs cr) 1QFY11 4QFY10 %chg (qoq) 1QFY10 %chg (yoy) Investment Period 12 Months
Net revenue 8,217 7,737 6.2 7,207 14.0
EBIT margin (%) 27.1 27.5 (0.4) 24.8 2.3
Stock Info
PAT 1,844 1,948 (5.3) 1,520 21.3
Source: Company, Angel Research; US GAAP financials in INR terms Sector IT
Outstanding performance assures strong business pipeline: TCS reported strong Market Cap (Rs cr) 162,917
performance in 1QFY2011, which was well ahead of our as well as consensus Beta 0.9
estimates. In INR terms, TCS reported top-line growth of 6.2% qoq (14% yoy);
while in USD terms, it reported growth of 6.4% qoq (21.2% yoy). Growth was 52 Week High / Low 844/420
backed by 8.1% growth in volumes, which combated the cross-currency and
Avg. Daily Volume 399477
pricing impact of negative ~190bp. Growth was broad-based, led by North
America and Asia Pacific markets. Despite the 215bp and 32bp negative impacts Face Value (Rs) 1
of wage hikes and adverse currency movement, respectively, the company
BSE Sensex 17,956
witnessed a slight dip of only 36bp qoq in EBIT margin mainly due to rate
productivity improvement and lower selling and general administration (SG&A) Nifty 5,394
costs. Other income was down by 49% qoq on account of Forex loss, while the
higher tax rate moved up from 14.8% to 19% qoq. Thus, TCS recorded a 5.3% Reuters Code TCS.BO
qoq decline in bottom line to Rs1,844cr mainly because of higher Forex loss and Bloomberg Code TCS@IN
tax rate.
Outlook & Valuation: Despite a weaker macro-economic scenario, TCS continued
Shareholding Pattern (%)
to perform well in 1QFY2011. TCS has a strong deal pipeline, including large
transformational deals with an uptick in discretionary spends. The company also Promoters 74.1
raised its gross employee-hiring target to 40,000 for FY2011 from the earlier
30,000, exhibiting a positive demand environment. We expect the company to MF / Banks / Indian Fls 8.5
deliver a top-line CAGR of 17.9% over FY2010–12E, backed by a 19% CAGR in FII / NRIs / OCBs 12.3
volumes. However, EPS is likely to register an 11.7% CAGR during the same
period because of increased tax rate. The stock is currently trading at 20.7x Indian Public /
5.0
Others
FY2011E EPS of Rs40.3 and 19x FY2012E EPS of Rs43.8. Although the ongoing
crisis in Europe and adverse cross-currency movements are causes for concern for
IT companies, we believe growth will be sustained through volumes with stable
Abs. (%) 3m 1yr 3yr
pricing. We have valued the stock at 21x FY2012E earnings, similar to its
historical average of 21x during FY2007–10 and at par with our target P/E Sensex 2.1 26.0 17.3
multiple of 21x for Infosys. We recommend an Accumulate rating on the stock
with a Target Price of Rs920. TCS 2.1 98.0 47.6
Key Financials (Consolidated US GAAP)
Y/E March (Rs cr) FY2009 FY2010 FY2011E FY2012E
Net Sales 27,813 30,029 35,940 41,710
% chg 23.0 8.0 19.7 16.1
Net Profit 5,172 6,873 7,889 8,571
% chg 3.0 32.9 14.8 8.6
EBIT Margin (%) 25.8 28.9 29.2 29.0
FDEPS (Rs) 26.4 35.1 40.3 43.8
P/E (x) 15.8 23.7 20.7 19.0
P/BV (x) 5.1 7.6 6.3 5.3
RoE (%) 36.2 36.8 33.6 30.4
RoCE (%) 47.4 48.5 50.8 53.2
Vibha Salvi
EV/Sales (x) 3.0 5.5 4.3 3.6
022 – 4040 3800 Ext: 329
EV/EBITDA (x) 11.1 18.3 14.8 12.6 vibhas.salvi@angeltrade.com
Source: Company, Angel Research
Please refer to important disclosures at the end of this report 1
2. TCS | 1QFY2011Result Update
Exhibit 1: 1QFY2011 performance (Consolidated, US GAAP)
Y/E March (Rs cr) FY2011 FY2010 % chg FY2010 % chg FY2010 FY2009 %chg
1Q 4Q (qoq) 1Q (yoy) (yoy)
Net revenue 8,217 7,737 6.2 7,207 14.0 30,029 27,813 8.0
Cost of revenue 4,398 3994 10.1 3,821 15.1 15,724 15,075 4.3
Gross profit 3,820 3,743 2.0 3,386 12.8 14,305 12,738 12.3
SG&A expenses 1,411 1,431 (1.4) 1,424 (1.0) 5,625 5,561 1.1
EBITDA 2,409 2,312 4.2 1,962 22.8 8,680 7,178 20.9
Other income 83 163 (48.9) 19 226 (467)
Depreciation 178 184 (3.2) 173 3.1 721 576 25.1
Income before income taxes 2,314 2,291 1.0 1,808 27.9 8,185 6,134 33.4
Minority interest 27 3 750.0 23 20.4 103 61 68.4
Tax 442 340 30.2 266 66.6 1,209 901 34.1
Net income 1,844 1,948 (5.3) 1,520 21.3 6,873 5,172 32.9
Diluted EPS (Rs) 9.4 10.0 (5.3) 7.8 21.2 35.1 26.4 32.9
Gross profit margin (%) 46.5 48.4 47.0 47.6 45.8
EBITDA margin (%) 29.3 29.9 27.2 28.9 25.8
EBIT margin (%) 27.1 27.5 24.8 26.5 23.7
Net profit margin (%) 22.4 25.2 21.1 22.9 18.6
Source: Company, Angel Research
Exhibit 2: 1QFY2011 – Actual v/s Angel estimates
(Rs cr) Estimates Actual Variation (%)
Net revenue 7,890 8,217 4.1
EBIT margin (%) 25.5 27.1 1.6
PAT 1,809 1,844 1.9
Source: Company, Angel Research
Strong volumes combated adverse cross-currency impact
Exhibit 3: INR revenue growth break-up (%)
1QFY11
(A) Positive factors
Volume growth 8.10
Total (A) 8.10
(B) Negative factors
Pricing & productivity 0.32
Offshore shift 0.48
Cross currency impact 1.09
Total (B) 1.89
(C) Revenue growth (A) - (B) 6.21
Source: Company, Angel Research
For 1QFY2011, TCS recorded top-line growth of 6.2% qoq (14% yoy), backed by
volume growth of 8.1% qoq. However, this positive impact on growth was largely
curtailed by the 1.1% qoq impact of cross-currency movement as the INR
continued to appreciate even against the euro and GBP by 8.6% and 5.1%,
respectively, during the quarter.
July 16, 2010 2
3. TCS | 1QFY2011Result Update
In 1QFY2011, the company’s international revenue grew by 6.3% qoq (14.4%
yoy) to Rs7,492.0cr. Domestic revenue during the quarter grew by 5.3% qoq
(9.8% yoy) to Rs725.2cr, sustaining the strong growth momentum.
TCS closed 10 large deals across the BFSI, hi-tech, manufacturing and lifesciences
verticals and added 36 new clients during the quarter. A large deal was also
closed in Europe during the quarter, despite the unstable environment. The
company’s Bancs product performed extremely well with eight implementations
going live in 1QFY2011 and 13 new large deals being signed for the same.
Amongst service lines, except for global consulting and asset leveraged solutions,
all services witnessed strong growth. Among verticals, except for manufacturing,
all verticals witnessed strong growth.
During the quarter, TCS added gross of 10,849 employees (net addition was
3,271), taking the total headcount (including subsidiaries) to 1,63,700 employees.
The total headcount excluding subsidiaries stood at 1,42,939, up 2,320 on a net
basis.
Exhibit 4: Service line break-up
Service line 1QFY11 4QFY10 1QFY10 %chg %chg
(Rs cr) (qoq) (yoy)
Application dvlpt.
3,936 3,683 3,510 6.9 12.1
& maintenance
Business intelligence 444 418 440 6.2 0.9
Enterprise solutions 805 781 786 3.1 2.5
Assurance services 526 449 317 17.2 65.8
Engineering
394 371 375 6.2 5.2
& industrial services
Infrastructure services 715 642 670 11.3 6.7
Global consulting 173 193 101 (10.8) 71.0
Asset leveraged solutions 304 309 187 (1.8) 62.3
BPO 920 890 822 3.4 12.0
Total revenue 8,217 7,737 7,207 6.2 14.0
Source: Company, Angel Research
Exhibit 5: Verticals split
Verticals 1QFY11 4QFY10 1QFY10 %chg %chg
(Rs cr) (qoq) (yoy)
BFSI 3,673 3,528 3,157 4.1 16.4
Telecom 1,044 944 951 10.6 9.7
Manufacturing 608 603 627 0.8 (3.0)
Retail & distribution 904 843 764 7.2 18.3
Hi-Tech 378 340 310 11.0 22.0
Lifesciences
427 402 353 6.2 21.0
& healthcare
Travel & hospitality 255 248 238 2.9 7.1
Energy & utilities 271 232 180 16.8 50.5
Media & entertainment 156 139 144 12.1 8.3
Others 501 456 483 9.8 3.8
Total revenue 8,217 7,737 7,207 6.2 14.0
Source: Company, Angel Research
July 16, 2010 3
4. TCS | 1QFY2011Result Update
Exhibit 6: Client contribution
% chg % chg
Client 1QFY11 4QFY10 1QFY10
(qoq) (yoy)
Top client 666 634 411 4.9 62.0
% of revenue 8.1 8.2 5.7
Top 5 clients 1,808 1,687 1,398 7.2 29.3
% of revenue 22.0 21.8 19.4
Top 10 clients 2,506 2,336 2,018 7.3 24.2
% of revenue 30.5 30.2 28.0
Source: Company, Angel Research
In terms of geography, growth was on the back of continued strong recovery in
North America, up 8.2% qoq (19.9% yoy), and robust growth in emerging
markets. In Europe, growth was led by 5.5% qoq growth in the UK; however,
Continental Europe witnessed a 5.5% qoq decline on account of the ongoing
crisis.
Exhibit 7: Geographical break-up
Geographies 1QFY11 4QFY10 1QFY10 % chg % chg
(Rs cr) (qoq) (yoy)
America
North America 4,520 4,178 3,769 8.2 19.9
Latin America 353 340 332 3.8 6.6
Europe
UK 1,241 1,176 1,218 5.5 1.9
Continental Europe 731 774 793 (5.5) (7.7)
Emerging Markets
India 723 689 656 5.0 10.3
Asia Pacific 485 433 310 11.9 56.4
MEA 164 147 130 11.8 26.7
Total revenue 8,217 7,737 7,207 6.2 14.0
Source: Company, Angel Research
SG&A leverage and improved productivity prevented margin erosion
Exhibit 8: Factors impacting EBIT margin
(A) Positive factors 1QFY11
Rate productivity improvement 0.57
Offshore shift 0.15
SG&A leverage 1.39
Total (A) 2.11
(B) Negative factors
Wage Hike 2.15
Cross currency impact 0.32
Total (B) 2.47
(C) Change in EBIT margin (A) - (B) (0.36)
Source: Company, Angel Research
July 16, 2010 4
5. TCS | 1QFY2011Result Update
The company provided offshore wage hike of around 10% and onsite hike of 2–
4%, which contracted EBIT margin by 215bp and 32bp on account of adverse
currency movements, respectively. This resulted in a slight dip of 36bp qoq in EBIT
margin, much lower than expected. Further margin erosion was mainly due to
improvement in rate productivity, lower SG&A costs and offshore shift.
Lower other income and higher taxes impact bottom line
The company’s other income declined by 49% qoq to Rs83.1cr in 1QFY2011 on
account of Forex loss of Rs47cr versus Forex gain witnessed in 4QFY2010. The tax
rate also moved up from 14.8% to 19% qoq. Thus, TCS recorded a decline of
5.3% qoq in bottom line to Rs1,844cr.
July 16, 2010 5
6. TCS | 1QFY2011Result Update
Investment Arguments
Strong deal pipeline and uptick in discretionary spends exhibit strong business
prospectus: Though Europe continues to be a spoilsport for the Indian IT industry,
TCS’s current bottom’s up statistics are in disconnect with the weak macro-
economic indicators, as the company is witnessing strong IT spends from the US,
UK and emerging markets. Though there are concerns related to business
prospects from Continental Europe, the same had witnessed growth of 1.2% qoq
in constant currency terms in 1QFY2011. Further, the company’s demand pipeline
is quite robust, comprising large transformational deals, and is witnessing an
uptick in discretionary IT spends with 15 such critical deals coming from new
clients, exhibiting strong improvement in the company’s business prospects.
Moreover, the company’s UK government’s pension-related project seems to be
on track with no major concerns seen in its ramp up. The company has also raised
its gross employee-hiring target to 40,000 for FY2011 from the earlier 30,000,
exhibiting a positive demand environment. Though TCS does not give direct
guidance, based on the current cues from the management and our analysis, we
believe TCS will witness strong volume-backed performance in FY2011. The
pricing for the company is expected to remain stable with an upward bias on
account of key transformational deals in the pipeline.
Adverse cross-currency and higher attrition impacts to be mitigated by other
operational levers: The adverse cross-currency movement remains a concern as
TCS has higher dependence on Europe. However, we believe the same would be
combated through hedges and strong growth in other markets. TCS’s total
outstanding hedge position as in 1QFY2011 stands at around US $455mn, at an
INR/USD strike rate of 46.3. TCS now focuses on smaller-tenure hedges in view of
volatile currency, which would prove helpful in the current business environment.
The higher attrition rate of 13.1% observed in 1QFY2011 was mainly on account
of overall buoyancy in the job market, driven by strong economic recovery and
employees leaving for higher studies, which generally happens in first quarter of a
financial year. However, the company’s promotional drives and focus on talent
retention are expected to restrain growth in attrition rate going forward. Though
we expect employee costs to increase going forward, management’s focus would
remain on capping non-employee costs through better managerial efficiency and
by growing its offshore leverage the way it did during 1QFY2011.
Outlook & Valuation: Despite a weaker macro-economic scenario, TCS continued
to perform well during the quarter. The company has a strong deal pipeline,
including large transformational deals with an uptick in discretionary spends. The
company also raised its gross employee-hiring target to 40,000 for FY2011 from
the earlier 30,000, exhibiting a positive demand environment.
July 16, 2010 6
7. TCS | 1QFY2011Result Update
We expect the company to deliver a top-line CAGR of 17.9% over FY2010–12E,
backed by a 19% CAGR in volumes. However, EPS is likely to register an 11.7%
CAGR during the same period on account of increased tax rate. The stock is
currently trading at 20.7x FY2011E EPS of Rs40.3 and 19x FY2012E EPS of
Rs43.8. Although the ongoing crisis in Europe and adverse cross-currency
movements are causes for concern for IT companies, we believe growth will be
sustained through volumes with stable pricing. We have valued the stock at 21x
FY2012E earnings, similar to its historical average of 21x during FY2007–10 and
at par with our target PE multiple of 21x for Infosys. We recommend an
Accumulate rating on the stock with a Target Price of Rs920
Exhibit 9: Key assumptions
FY2011E FY2012E
Volume growth 21.4 16.3
Pricing growth 0.7 2.2
Revenue growth (in USD terms) 22.2 14.7
USD-INR rate (realised) 46.5 47.0
Revenue growth (in INR terms) 19.7 16.1
EBIT margin (%) 27.0 26.8
Tax rate (%) 19.0 24.0
EPS growth (%) 14.8 8.6
Source: Company, Angel Research
Exhibit 10: Change in estimates
FY2011E FY2012E
Parameter Earlier Revised Var. Earlier Revised Var.
(Rs cr) estimates estimates (%) estimates estimates (%)
Net revenue 33,351 35,940 7.8 38,821 41,710 7.4
EBIT (ex. other
8,391 9,695 15.5 9,442 11,196 18.6
income)
PBT 9,064 9,865 8.8 10,533 11,455 8.8
Tax 1,541 1,861 20.7 2,212 2,749 24.3
PAT 7,413 7,889 6.4 8,200 8,571 4.5
Source: Company, Angel Research
We have upgraded our FY2011E and FY2012E top-line estimates, in line with
strong cues from the management and the expected higher infusion of gross
manpower. However, we expect other income to be lower on account of the
expected unfavorable cross-currency movement. We estimate PAT to be higher
in FY2011E and FY2012E, compared to the earlier estimates, on the back of
upgraded growth in volumes and better margins.
Exhibit 11: Angel EPS forecast v/s consensus
Bloomberg Variation
Year (%) Angel forecast
consensus (%)
FY2011E 40.3 40.0 0.8
FY2012E 43.8 45.0 (2.7)
Source: Company, Angel Research
July 16, 2010 7
12. TCS | 1QFY2011Result Update
Research Team Tel: 022 - 4040 3800 E-mail: research@angeltrade.com Website: www.angeltrade.com
DISCLAIMER
This document is solely for the personal information of the recipient, and must not be singularly used as the basis of any investment
decision. Nothing in this document should be construed as investment or financial advice. Each recipient of this document should make
such investigations as they deem necessary to arrive at an independent evaluation of an investment in the securities of the companies
referred to in this document (including the merits and risks involved), and should consult their own advisors to determine the merits and
risks of such an investment.
Angel Broking Limited, its affiliates, directors, its proprietary trading and investment businesses may, from time to time, make
investment decisions that are inconsistent with or contradictory to the recommendations expressed herein. The views contained in this
document are those of the analyst, and the company may or may not subscribe to all the views expressed within.
Reports based on technical and derivative analysis center on studying charts of a stock's price movement, outstanding positions and
trading volume, as opposed to focusing on a company's fundamentals and, as such, may not match with a report on a company's
fundamentals.
The information in this document has been printed on the basis of publicly available information, internal data and other reliable
sources believed to be true, but we do not represent that it is accurate or complete and it should not be relied on as such, as this
document is for general guidance only. Angel Broking Limited or any of its affiliates/ group companies shall not be in any way
responsible for any loss or damage that may arise to any person from any inadvertent error in the information contained in this report.
Angel Broking Limited has not independently verified all the information contained within this document. Accordingly, we cannot testify,
nor make any representation or warranty, express or implied, to the accuracy, contents or data contained within this document. While
Angel Broking Limited endeavours to update on a reasonable basis the information discussed in this material, there may be regulatory,
compliance, or other reasons that prevent us from doing so.
This document is being supplied to you solely for your information, and its contents, information or data may not be reproduced,
redistributed or passed on, directly or indirectly.
Angel Broking Limited and its affiliates may seek to provide or have engaged in providing corporate finance, investment banking or
other advisory services in a merger or specific transaction to the companies referred to in this report, as on the date of this report or in
the past.
Neither Angel Broking Limited, nor its directors, employees or affiliates shall be liable for any loss or damage that may arise from or in
connection with the use of this information.
Note: Please refer to the important `Stock Holding Disclosure' report on the Angel website (Research Section). Also, please
refer to the latest update on respective stocks for the disclosure status in respect of those stocks. Angel Broking Limited and
its affiliates may have investment positions in the stocks recommended in this report.
Disclosure of Interest Statement (Company name) TCS
1. Analyst ownership of the stock No
2. Angel and its Group companies ownership of the stock Yes
3. Angel and its Group companies' Directors ownership of the stock No
4. Broking relationship with company covered No
Note: We have not considered any Exposure below Rs 1 lakh for Angel, its Group companies and Directors.
Ratings (Returns) : Buy (> 15%) Accumulate (5% to 15%) Neutral (-5 to 5%)
Reduce (-5% to 15%) Sell (< -15%)
July 16, 2010 12