HCL Technologies Delivers 11.4% Revenue Growth in 4QFY2010
1. 4QFY2010 Result Update | IT
August 5, 2010
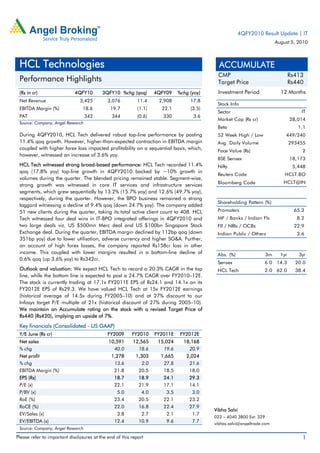
HCL Technologies ACCUMULATE
CMP Rs413
Performance Highlights Target Price Rs440
(Rs in cr) 4QFY10 3QFY10 %chg (qoq) 4QFY09 %chg (yoy) Investment Period 12 Months
Net Revenue 3,425 3,076 11.4 2,908 17.8
Stock Info
EBITDA Margin (%) 18.6 19.7 (1.1) 22.1 (3.5)
Sector IT
PAT 342 344 (0.6) 330 3.6
Market Cap (Rs cr) 28,014
Source: Company, Angel Research
Beta 1.1
During 4QFY2010, HCL Tech delivered robust top-line performance by posting 52 Week High / Low 449/240
11.4% qoq growth. However, higher-than-expected contraction in EBITDA margin Avg. Daily Volume 293455
coupled with higher forex loss impacted profitability on a sequential basis, which, Face Value (Rs) 2
however, witnessed an increase of 3.6% yoy.
BSE Sensex 18,173
HCL Tech witnessed strong broad-based performance: HCL Tech recorded 11.4% Nifty 5,448
qoq (17.8% yoy) top-line growth in 4QFY2010 backed by ~10% growth in
Reuters Code HCLT.BO
volumes during the quarter. The blended pricing remained stable. Segment-wise,
Bloomberg Code HCLT@IN
strong growth was witnessed in core IT services and infrastructure services
segments, which grew sequentially by 13.2% (15.7% yoy) and 12.6% (49.7% yoy),
respectively, during the quarter. However, the BPO business remained a strong
Shareholding Pattern (%)
laggard witnessing a decline of 9.4% qoq (down 24.7% yoy). The company added
51 new clients during the quarter, taking its total active client count to 408. HCL Promoters 65.3
Tech witnessed four deal wins in IT-BPO integrated offerings in 4QFY2010 and MF / Banks / Indian Fls 8.2
two large deals viz. US $500mn Merc deal and US $100bn Singapore Stock FII / NRIs / OCBs 22.9
Exchange deal. During the quarter, EBITDA margin declined by 112bp qoq (down Indian Public / Others 3.6
351bp yoy) due to lower utilisation, adverse currency and higher SG&A. Further,
on account of high forex losses, the company reported Rs158cr loss in other
income. This coupled with lower margins resulted in a bottom-line decline of Abs. (%) 3m 1yr 3yr
0.6% qoq (up 3.6% yoy) to Rs342cr.
Sensex 6.0 14.3 20.0
Outlook and valuation: We expect HCL Tech to record a 20.3% CAGR in the top HCL Tech 2.0 62.0 38.4
line, while the bottom line is expected to post a 24.7% CAGR over FY2010–12E.
The stock is currently trading at 17.1x FY2011E EPS of Rs24.1 and 14.1x on its
FY2012E EPS of Rs29.3. We have valued HCL Tech at 15x FY2012E earnings
(historical average of 14.5x during FY2005–10) and at 27% discount to our
Infosys target P/E multiple of 21x (historical discount of 27% during 2005–10).
We maintain an Accumulate rating on the stock with a revised Target Price of
Rs440 (Rs420), implying an upside of 7%.
Key financials (Consolidated - US GAAP)
Y/E June (Rs cr) FY2009 FY2010 FY2011E FY2012E
Net sales 10,591 12,565 15,024 18,168
% chg 40.0 18.6 19.6 20.9
Net profit 1,278 1,303 1,665 2,024
% chg 13.6 2.0 27.8 21.6
EBITDA Margin (%) 21.8 20.5 18.5 18.0
EPS (Rs) 18.7 18.9 24.1 29.3
P/E (x) 22.1 21.9 17.1 14.1
P/BV (x) 5.0 4.0 3.5 3.0
RoE (%) 23.4 20.5 22.1 23.2
RoCE (%) 22.0 16.8 22.4 27.9
Vibha Salvi
EV/Sales (x) 3.8 2.7 2.1 1.7
022 – 4040 3800 Ext: 329
EV/EBITDA (x) 12.4 10.9 9.6 7.7 vibhas.salvi@angeltrade.com
Source: Company, Angel Research
Please refer to important disclosures at the end of this report 1
2. HCL Technologies | 4Q FY2010 Result Update
Exhibit 1: 4QFY2010 - Consolidated financial performance (US GAAP)
Y/E June (Rs cr) 4QFY10 3QFY10 % chg 4QFY09 % chg FY2010 FY2009 % chg
(qoq) (yoy)
Revenue 3,425 3,076 11.4 2,908 17.8 12,565 10,591 18.6
Direct Costs 2,292 2,038 12.5 1,814 26.4 8,196 6,548 25.2
Gross Profit 1,133 1,038 9.2 1,095 3.5 4,369 4,043 8.1
SG&A Expenses 495 430 15.0 451 9.8 1,796 1,736 3.5
Operating Profit (EBITDA) 638 607 5.1 644 (0.9) 2,573 2,307 11.5
Other Income (158) (77) (101) 56.9 (529) (326) 62.4
Depreciation & Amortization 113 110 2.9 120 (5.6) 501 449 11.5
Income before Income Taxes 367 421 (12.7) 424 (13.3) 1,543 1,532 0.7
Tax 25 77 (67.0) 94 (72.8) 240 254 (5.5)
Share of Equity Investment & Minority Int. - - - - -
Net Income 342 344 (0.6) 330 3.6 1,303 1,277 2.0
Diluted EPS (Rs) 19.8 19.9 (0.5) 19.6 1.0 18.9 19.1 (1.0)
Gross Profit Margin (%) 33.1 33.7 37.6 34.8 38.2
EBITDA Margin (%) 18.6 19.7 22.1 20.5 21.8
Net Profit Margin (%) 10.0 11.2 11.3 10.4 12.1
Source: Company, Angel Research
Exhibit 2: 4QFY2010 – Actual v/s Angel estimates
(Rs in cr) Estimates Actual Variation
Net Revenue 3,109 3,425 10.2
EBITDA Margin (%) 19.5 18.6 (0.9)
PAT 348 342 (1.8)
Source: Company, Angel Research
Top-line growth led by strong volume
HCL Tech posted 11.4% qoq (17.8% yoy) top-line growth in 4QFY2010, backed
by ~10% growth in volumes during the quarter. However, the blended pricing
remained stable. Segment-wise, strong growth was witnessed in the core IT
services and infrastructure services segments, which grew sequentially by 13.2%
(15.7% yoy) and 12.6% (49.7% yoy), respectively. However, the BPO business
remained a strong laggard witnessing a decline of 9.4% qoq (24.7% yoy). In US
Dollar terms, the core IT services and infrastructure services business reported
revenue of US $527mn and US $165mn, witnessing 9.4% and 8.9% qoq growth,
respectively; while the BPO segment registered revenue of US $45.5mn,
witnessing a 12.5% qoq decline qoq.
HCL Tech witnessed strong growth of 15% and 12% qoq in North America and
Asia Pacific, respectively, with Europe being a laggard but still witnessing growth
of 2.6% qoq. The company witnessed growth across all its verticals, with the retail
and healthcare verticals witnessing stupendous qoq growth of 22% each. The
energy and utilities and financial services verticals also witnessed strong growth of
~9% each.
August 5, 2010 2
3. HCL Technologies | 4Q FY2010 Result Update
HCL Tech added 51 new clients during 4QFY2010, taking its total active client
count to 408 and witnessed ~10–12% qoq growth each in its in Top-5 to Top-20
client accounts. The company witnessed four deal wins in IT-BPO integrated
offerings in 4QFY2010 and two large deals viz. US $500mn Merc deal and US
$100bn Singapore Stock Exchange deal.
Adverse currency, lower utilisation, higher SG&A hurt margins
During the quarter, onsite utilisation dipped from 97% to 95% qoq in 4QFY2010,
which negatively impacted margins by 71bp. Further, the adverse currency
movement had a 43bp negative impact on margins. Incremental marketing costs
led to an increase in SG&A during the quarter, thereby impacting margins by
another 47bp qoq. However, other operational efficiency gains had a positive
impact of 48bp qoq on margins. Thus, the EBITDA margin witnessed a 112bp qoq
dip (down 351bp yoy).
Segment-wise, the EBITDA margin in the core IT services and BPO segments
dipped by 160bp and 690bp qoq (down 260bp and 2640bp yoy), respectively.
The company continued to report loss at the EBITDA level in the BPO segment,
which stood at Rs24cr v/s Rs10cr in 3QFY2010. However, the infrastructure
services segment witnessed a 50bp qoq increase in margins (down 50bp yoy).
Exhibit 3: EBITDA margin trend
24
23
22
21
20
(%)
19
18
17
16
15
1QFY08
2QFY08
3QFY08
4QFY08
1QFY09
2QFY09
3QFY09
4QFY09
1QFY10
2QFY10
3QFY10
4QFY10
Source: Company, Angel Research
Bottom line declined due to higher forex loss
HCL Tech reported forex loss during the quarter, on account of old hedges at
lower rates and because of US $4.2mn forex hit on foreign assets and liabilities.
Thus, net forex loss was up at Rs137cr v/s Rs62.6cr in 3QFY2010, while other
income stood at negative Rs20.8cr v/s Rs13.9cr in 3QFY2010. Thus, on account
of higher forex and other income losses, the company reported Rs158cr net loss in
other income. Moreover, the effective tax rate during the quarter was low at 6.9%
compared to 18% in 3QFY2010 because of one-time tax reversal. Accordingly,
the bottom line declined 0.6% qoq (up 3.6% yoy) to Rs342cr.
August 5, 2010 3
4. HCL Technologies | 4Q FY2010 Result Update
Strong lateral hiring exhibiting positive business environment
During the quarter, HCL Tech made total gross addition of 7,136 employees,
while it made net addition of 6,428 employees. Thus, the company’s total
headcount stood at 64,557 as of 4QFY2010. HCL Tech added 5,409 (added
3,152 in 3QFY2010) net employees in the IT services segment and 1,019 in the
BPO segment (net down by 711 in 3QFY2010) during the quarter.
During the quarter, the company’s attrition rate in the IT services segment
increased to 15.7% qoq from 14%. However, the attrition rate in the BPO segment
declined to 15.3% from 20.3%.
1QFY2011E revenue guidance
Going forward, top-line growth would be volume-led, with pricing. The company
has given salary hikes with effect from July 2010. Thus, we believe salary hikes,
robust lateral hiring and adverse currency movement will lead to a 300bp decline
in HCL Tech’s margins in 1QFY2011. However, through other operational levers,
the company expects to absorb this margin pressure to some extent towards the
end of FY2011.
Investment arguments
Growth led by higher demand pipeline, discretionary spends
HCL Tech’s total deal wins in FY2010 aggregated to US $2bn, which includes two
large deals viz. Merc and Singapore Stock Exchange. Of all these, deals won
through Axon were from new client accounts, whereas the others were from
existing clients. Discretionary spends are witnessing a pick-up in demand on
account of integration work required for mergers and demergers by corporates
mainly in the financial services vertical. Also, large-scale transformation projects,
viz. the entire data centre migration of clients, are being signed up. A strong deal
pipeline is been witnessed in the media, healthcare, retail and manufacturing
verticals through new client wins, whereas in the financial services vertical, strong
traction is been witnessed from existing client accounts.
BPO repositioning to yield better prospects in the long run
The BPO business witnessed a decline for a couple of consecutive quarters and for
FY2010. Hence, the company is evaluating its overall BPO business operations,
with plans to grow core BPO operations by investing in them. On the other hand,
non-core and non-strategic BPO operations are expected to be downsized over a
period.
Currently the IBS contract, which is in the insurance space, is making losses, but it
is a strategically important business. Hence, HCL Tech plans to continue investing
in it for a couple of quarters going ahead. Further, through the new ELAS
contract, the company aims to gain critical scale and use ELAS to further develop
its BPO platform. Thus, with the ongoing huge investments, we believe the BPO
business will continue to witness muted growth and depressed margins even in the
next six quarters; however, it would see a turnaround in the long run.
August 5, 2010 4
5. HCL Technologies | 4Q FY2010 Result Update
Revised hedges to mitigate adverse currency movement impact
The old hedges (taken more than two years ago) are tailing off, which will take
another 1–2 quarters by recording US $15mn of hedge losses.
The new hedging policy would, henceforth, cover the company’s revenue for the
next three months. HCL Tech’s hedge position now stands at US $362mn. The
average booked rate has improved with US $95mn of hedges at Rs47.37. Thus,
we believe the company’s forex losses as witnessed in the past couple of quarters
on account of the old hedging policy at lower INR-USD rate would come down,
thereby improving profitability.
Margins to be maintained through various operational levers
HCL Tech plans to add freshers at an appropriate time whenever required.
Another margin lever for the company would be its increased focus on campus
hiring and SEZ operations.
In the infrastructure services segment, the company’s margin has expanded to
18% from 10%, with growth in scale of operations in the last six years. The same
could be demonstrated in the company’s other businesses, mainly the BPO,
through timely investments in the right areas and business propositions. Thus, the
company’s long-term strategy is to remain constant on margins and then use
some of these margin levers to make up for any exchange impact.
Outlook and valuation
We expect HCL Tech to record a 20.3% CAGR in the top line, while the bottom
line is expected to post a 24.7% CAGR over FY2010–12E. The stock is currently
trading at 17.1x FY2011E EPS of Rs24.1 and 14.1x on its FY2012E EPS of Rs29.3.
We have valued HCL Tech at 15x FY2012E earnings (historical average of 14.5x
during FY2005–10) and at 27% discount to our Infosys target P/E multiple of 21x
(historical discount of 27% during 2005–10). We maintain an Accumulate rating
on the stock with a revised Target Price of Rs440 (Rs420), implying an upside
of 7%.
Exhibit 4: Key assumptions
FY2011E FY2012E
Volume Growth - IT services (%) 14.8 13.6
Pricing Growth - IT services (%) 0.0 0.2
Revenue Growth - US $ terms (%) 19.5 19.6
USD-INR Rate (realised) 46.5 47
Revenue Growth - INR terms (%) 19.6 20.9
EBITDA Margin (%) 18.5 18.0
Tax Rate (%) 22.0 24.0
EPS Growth (%) 27.8 21.6
Source: Company, Angel Research
August 5, 2010 5
6. HCL Technologies | 4Q FY2010 Result Update
Exhibit 5: Change in estimates
FY2011E FY2012E
Earlier Revised Earlier Revised
Rs in cr Var. (%) Var. (%)
Estimates Estimates Estimates Estimates
Net Revenues 13,611 15,024 10.4 15,903 18,168 14.2
EBIDTA 2,858 2,779 (2.8) 3,260 3,270 0.3
PBT 1,996 2,135 7.0 2,421 2,663 10.0
Tax 362 470 29.7 487 639 31.3
PAT 1,637 1,665 1.7 1,936 2,024 4.6
Source: Company, Angel Research
We have upgraded our FY2011E and FY2012E top-line estimates, in line with
strong cues from the management in terms of volume-driven growth with robust
manpower infusion, both laterals and freshers. However, we expect the EBITDA
margin to be lower than our earlier expectations on account of higher opex and
personnel costs along with the unfavorable cross-currency movement. As guided
by the management, we have assumed higher tax rates of 22% and 24% (earlier
18% and 20%, respectively) in FY2011E and FY2012E, respectively. In line with
the overall strong upgradation of our top-line estimates and because of lowering
of forex losses on account of the new hedging policy, our PAT estimates are also
expected to be better than our earlier estimates for FY2011E and FY2012E.
Exhibit 6: Angel EPS forecast v/s consensus
Bloomberg
Year (%) Angel forecast Var. (%)
consensus
FY2011E 24.1 25.0 (3.6)
FY2012E 29.3 30.0 (2.3)
Source: Company, Angel Research
Exhibit 7: One-year forward P/E band
800
700 26x
600
Share Price (Rs)
19x
500
400 15x
300
8x
200
100
0
Apr-06
Apr-07
Apr-08
Apr-09
Apr-10
Oct-05
Oct-06
Oct-07
Oct-08
Oct-09
Jan-06
Jan-07
Jan-08
Jan-09
Jan-10
Jul-05
Jul-06
Jul-07
Jul-08
Jul-09
Jul-10
Source: Company, Angel Research
August 5, 2010 6
12. HCL Technologies | 4Q FY2010 Result Update
Research Team Tel: 022 - 4040 3800 E-mail: research@angeltrade.com Website: www.angeltrade.com
DISCLAIMER
This document is solely for the personal information of the recipient, and must not be singularly used as the basis of any investment
decision. Nothing in this document should be construed as investment or financial advice. Each recipient of this document should make
such investigations as they deem necessary to arrive at an independent evaluation of an investment in the securities of the companies
referred to in this document (including the merits and risks involved), and should consult their own advisors to determine the merits and
risks of such an investment.
Angel Broking Limited, its affiliates, directors, its proprietary trading and investment businesses may, from time to time, make
investment decisions that are inconsistent with or contradictory to the recommendations expressed herein. The views contained in this
document are those of the analyst, and the company may or may not subscribe to all the views expressed within.
Reports based on technical and derivative analysis center on studying charts of a stock's price movement, outstanding positions and
trading volume, as opposed to focusing on a company's fundamentals and, as such, may not match with a report on a company's
fundamentals.
The information in this document has been printed on the basis of publicly available information, internal data and other reliable
sources believed to be true, but we do not represent that it is accurate or complete and it should not be relied on as such, as this
document is for general guidance only. Angel Broking Limited or any of its affiliates/ group companies shall not be in any way
responsible for any loss or damage that may arise to any person from any inadvertent error in the information contained in this report.
Angel Broking Limited has not independently verified all the information contained within this document. Accordingly, we cannot testify,
nor make any representation or warranty, express or implied, to the accuracy, contents or data contained within this document. While
Angel Broking Limited endeavours to update on a reasonable basis the information discussed in this material, there may be regulatory,
compliance, or other reasons that prevent us from doing so.
This document is being supplied to you solely for your information, and its contents, information or data may not be reproduced,
redistributed or passed on, directly or indirectly.
Angel Broking Limited and its affiliates may seek to provide or have engaged in providing corporate finance, investment banking or
other advisory services in a merger or specific transaction to the companies referred to in this report, as on the date of this report or in
the past.
Neither Angel Broking Limited, nor its directors, employees or affiliates shall be liable for any loss or damage that may arise from or in
connection with the use of this information.
Note: Please refer to the important `Stock Holding Disclosure' report on the Angel website (Research Section). Also, please
refer to the latest update on respective stocks for the disclosure status in respect of those stocks. Angel Broking Limited and
its affiliates may have investment positions in the stocks recommended in this report.
Disclosure of Interest Statement HCL Tech
1. Analyst ownership of the stock No
2. Angel and its Group companies ownership of the stock No
3. Angel and its Group companies' Directors ownership of the stock No
4. Broking relationship with company covered No
Note: We have not considered any Exposure below Rs 1 lakh for Angel, its Group companies and Directors.
Ratings (Returns) : Buy (> 15%) Accumulate (5% to 15%) Neutral (-5 to 5%)
Reduce (-5% to 15%) Sell (< -15%)
August 5, 2010 12