20240429 Calibre April 2024 Investor Presentation.pdf
Hindalco Novelis
1. 1QFY2011 Result Update | Base Metals
August 10, 2010
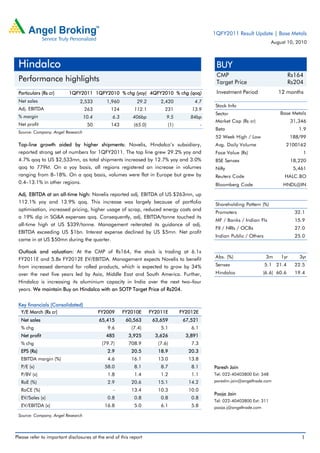
Hindalco BUY
CMP Rs164
Performance highlights Target Price Rs204
Particulars (Rs cr) 1QFY2011 1QFY2010 % chg (yoy) 4QFY2010 % chg (qoq) Investment Period 12 months
Net sales 2,533 1,960 29.2 2,420 4.7
Stock Info
Adj. EBITDA 263 124 112.1 231 13.9
Sector Base Metals
% margin 10.4 6.3 406bp 9.5 84bp
Market Cap (Rs cr) 31,346
Net profit 50 143 (65.0) (1) -
Beta 1.9
Source: Company, Angel Research
52 Week High / Low 188/99
Top-line growth aided by higher shipments: Novelis, Hindalco’s subsidiary, Avg. Daily Volume 2100162
reported strong set of numbers for 1QFY2011. The top line grew 29.2% yoy and Face Value (Rs) 1
4.7% qoq to US $2,533mn, as total shipments increased by 12.7% yoy and 3.0% BSE Sensex 18,220
qoq to 779kt. On a yoy basis, all regions registered an increase in volumes Nifty 5,461
ranging from 8–18%. On a qoq basis, volumes were flat in Europe but grew by Reuters Code HALC.BO
0.4–13.1% in other regions. Bloomberg Code HNDL@IN
Adj. EBITDA at an all-time high: Novelis reported adj. EBITDA of US $263mn, up
112.1% yoy and 13.9% qoq. This increase was largely because of portfolio Shareholding Pattern (%)
optimisation, increased pricing, higher usage of scrap, reduced energy costs and
Promoters 32.1
a 19% dip in SG&A expenses qoq. Consequently, adj. EBITDA/tonne touched its
MF / Banks / Indian Fls 15.9
all-time high at US $339/tonne. Management reiterated its guidance of adj.
FII / NRIs / OCBs 27.0
EBITDA exceeding US $1bn. Interest expense declined by US $5mn. Net profit
Indian Public / Others 25.0
came in at US $50mn during the quarter.
Outlook and valuation: At the CMP of Rs164, the stock is trading at 6.1x
Abs. (%) 3m 1yr 3yr
FY2011E and 5.8x FY2012E EV/EBITDA. Management expects Novelis to benefit
from increased demand for rolled products, which is expected to grow by 34% Sensex 5.1 21.4 22.5
over the next five years led by Asia, Middle East and South America. Further, Hindalco (6.6) 60.6 19.4
Hindalco is increasing its aluminium capacity in India over the next two–four
years. We maintain Buy on Hindalco with an SOTP Target Price of Rs204.
Key financials (Consolidated)
Y/E March (Rs cr) FY2009 FY2010E FY2011E FY2012E
Net sales 65,415 60,563 63,659 67,521
% chg 9.6 (7.4) 5.1 6.1
Net profit 485 3,925 3,626 3,891
% chg (79.7) 708.9 (7.6) 7.3
EPS (Rs) 2.9 20.5 18.9 20.3
EBITDA margin (%) 4.6 16.1 13.0 13.8
P/E (x) 58.0 8.1 8.7 8.1 Paresh Jain
P/BV (x) 1.8 1.4 1.2 1.1 Tel: 022-40403800 Ext: 348
RoE (%) 2.9 20.6 15.1 14.2 pareshn.jain@angeltrade.com
RoCE (%) - 13.4 10.3 10.0
Pooja Jain
EV/Sales (x) 0.8 0.8 0.8 0.8
Tel: 022-40403800 Ext: 311
EV/EBITDA (x) 16.8 5.0 6.1 5.8 pooja.j@angeltrade.com
Source: Company, Angel Research
Please refer to important disclosures at the end of this report 1
2. Hindalco | 1QFY2011 Result Update
Exhibit 1: Novelis 1QFY2011 performance
(US $mn) 1QFY11 1QFY10 % yoy FY2010 FY2009 % yoy
Net revenue 2,533 1,960 29.2 8,673 10,177 (15)
Cost of goods sold 2,208 1,533 44.0 7,190 9,251 (22.3)
(% of Net Sales) 87.2 78.2 82.9 90.9
Gross profit 325 427 (23.9) 1,483 926 60.2
(% of Net Sales) 12.8 21.8 17.1 9.1
Selling, general and
81 78 3.8 360 319 12.9
administrative expenses
(% of Net Sales) 3.2 4.0 4.2 3.1
Research and development
9 8 12.5 38 41 (7.3)
expenses
(% of Net Sales) 0.4 0.4 0.4 0.4
EBITDA 235 341 (31.1) 1,085 566 92
EBITDA margin (%) 9.3 17.4 12.5 5.6
Restructuring charges 6 3 100.0 14 95 (85.3)
Depreciation 103 100 3.0 384 439 (12.5)
EBIT 126 238 (47.1) 687 32 2,046.9
(% of Net Sales) 5.0 12.1 7.9 0.3
Other income/(Expense) (7) 13 - 25 (86) -
Net Interest expense 36 40 (10.0) 164 168 (2.4)
Unrealised gain/(loss) on
(6) 72 - 194 (556) -
derivative
Exceptional items 0 0 - 0 (1,218) -
PBT 77 283 (72.8) 742 (1,996) -
(% of Net Sales) 3.0 14.4 8.6 (19.6)
Taxes 15 112 (86.6) 262 (246) -
(% of PBT) 19.5 39.6 35.3 12.3
PAT 62 171 (63.7) 480 (1,750) -
(% of Net Sales) 2.4 8.7 5.5 (17.2)
Less: Profit from associates 3 10 (70.0) 15 172 (91.3)
Less: Minority interest 9 18 (50.0) 60 (12) -
Net Income 50 143 (65.0) 405 (1,910) -
Source: Company, Angel Research
Key conference call takeaways
Capex for the quarter stood at US $23mn. The full year capex guidance is
US $250mn. While US $120mn will be used as maintenance capex,
US $50mn will be spent on strategic projects, including de-bottlenecking of
existing capacities. The balance will be spent on capacity expansion plan in
South America, where the company is increasing capacity by 50% by FY2013E
at a cost of US $300mn.
The management indicated that it is operating at ~100% utilisation levels. In
the near term, volume growth of ~4–5% will be led by de-bottlenecking.
Free cash flow was lower at US $34mn in 1QFY2011 as compared to US
$213mn in 4QFY2010, as working capital requirements increased due to
higher LME prices and volumes. However, management expects free cash flow
in FY2011E to exceed US $355mn.
August 10, 2010 2
3. Hindalco | 1QFY2011 Result Update
Exhibit 2: EBITDA margin trend Exhibit 3: Net profit trend
300 12 250 10
250 10 200 8
200 8
150 6
(US $ mn)
(US $ mn)
150 6
(%)
100 4
(%)
100 4
50 2
50 2
0 0
0 0
1QFY10 2QFY10 3QFY10 4QFY10 1QFY11
1QFY10 2QFY10 3QFY10 4QFY10 1QFY11 (50) (2)
Adj. EBITDA (LHS) Adj. EBITDA margin (RHS) Net profit (LHS) Net profit margin (RHS)
Source: Company, Angel Research Source: Company, Angel Research
Exhibit 4: Adj. EBITDA/tonne at an all-time high
300 400
350
250
300
200
(US $/tonne)
250
(US $mn)
150 200
150
100
100
50
50
0 0
1QFY08 3QFY08 1QFY09 3QFY09 1QFY10 3QFY10 1QFY11
Adj. EBITDA (LHS) Adj. EBITDA/tonne (RHS)
Source: Company, Angel Research
Exhibit 5: Shipments across geographies higher yoy
(kt) 1QFY10 2QFY10 3QFY10 4QFY10 1QFY11 % yoy % qoq
Total sales 691 724 683 756 779 12.7 3.0
North America 261 266 254 282 283 8.4 0.4
Europe 212 218 204 250 249 17.5 (0.4)
Asia 130 140 134 130 147 13.1 13.1
South America 88 100 91 94 100 13.6 6.4
Source: Company, Angel Research
Exhibit 6: Average realisation
(US $/tonne) 1QFY10 2QFY10 3QFY10 4QFY10 1QFY11 % yoy % qoq
Average realisation 2,836 3,012 3,092 3,201 3,252 14.6 1.6
North America 2,939 3,090 3,094 3,252 3,389 15.3 4.2
Europe 3,137 3,372 3,554 3,400 3,382 7.8 (0.5)
Asia 2,508 2,729 2,910 3,100 3,109 24.0 0.3
South America 2,318 2,520 2,582 2,734 2,770 19.5 1.3
Source: Company, Angel Research
August 10, 2010 3
4. Hindalco | 1QFY2011 Result Update
Investment rationale
Aluminium capacity to increase 2–3 folds in the next 2–4 years
Hindalco is increasing its aluminium capacity by two–three folds in the next
two–four years. The first commissioning is expected at Hirakud in 2QFY2011E,
where capacity is being increased to 161ktpa in Phase-1 and to 213ktpa in
Phase-2 by 4QFY2012E. Moreover, capacities at Mahan Aluminium and Aditya
Aluminium are expected to come on stream by FY2012E. Consequently, we expect
sales volume to grow at a 26.6% CAGR over FY2010–13E. Further, the company’s
Jharkhand Aluminium project is expected to be commissioned in 1QFY2014E.
On the alumina front, with the commissioning of the Utkal refinery in FY2012E, we
expect alumina sales volume to grow at a 42.9% CAGR over FY2010–12E.
Moreover, these new capacities are coming at the lower end of the cost curve, and
this is likely to further benefit the company in terms of cost reduction.
Exhibit 7: Expansion plans
Project Timeline
Smelter Hirakud Phase I (115kt–161kt) 2QFY11E
Phase II (161kt–213kt) 4QFY12E
Phase III (213kt–316kt) -
Mahan Aluminim 2QFY12E
Aditya Aluminium 3QFY12E
Jharkhand Aluminium 1QFY14E
Refinery Utkal Alumina 2QFY12E
Aditya Alumina 1QFY14E
Belgaum Special Alumina Project -
Source: Company, Angel Research
Turnaround at Novelis
Management expects Novelis to benefit from increased demand for rolled
products, which is expected to grow by 34% over the next five years led by Asia,
Middle East and South America. Further, Novelis is expanding its rolling capacity in
Brazil at a capex of US $300mn.
August 10, 2010 4
5. Hindalco | 1QFY2011 Result Update
Outlook and valuation
At the CMP of Rs165, the stock is trading at 6.1x FY2011E and 5.8x FY2012E
EV/EBITDA. We believe Hindalco is well placed to benefit from a) its aluminium
expansion plans (capacity increasing by nearly two–three folds in the next two–four
years), b) low production cost at its new capacities and c) as management expects
Novelis to benefit from increased demand for rolled products, which is expected to
grow by 34% over the next five years led by Asia, Middle East and South America.
We maintain Buy on the stock with a SOTP Target Price of Rs204.
Exhibit 8: SOTP valuation
FY2012E EV/ EBITDA (Rs cr) Multiple EV (Rs cr) Stake (%) Attributable EV Value (Rs/share)
Hindalco (Standalone) 4,380 6.5 28,471 100 28,471 149
Novelis 4,945 5.5 27,196 100 27,196 142
Total EV 55,667 55,667 291
Less: Net debt (FY2011E) 18,896 99
Value of investments @25% discount 2,280 12
Value per share 204
Source: Angel Research
Exhibit 9: Key assumptions
FY2011E FY2012E
Sales volume (tonnes)
Aluminium 517,313 663,492
Copper 370,684 370,626
Alumina 280,000 316,650
LME prices (US $/tonne)
Aluminium 2,100 2,200
Copper 6,500 6,500
Alumina 315 330
Source: Company, Angel Research
August 10, 2010 5
12. Hindalco | 1QFY2011 Result Update
Research Team Tel: 022 - 4040 3800 E-mail: research@angeltrade.com Website: www.angeltrade.com
DISCLAIMER
This document is solely for the personal information of the recipient, and must not be singularly used as the basis of any investment
decision. Nothing in this document should be construed as investment or financial advice. Each recipient of this document should make
such investigations as they deem necessary to arrive at an independent evaluation of an investment in the securities of the companies
referred to in this document (including the merits and risks involved), and should consult their own advisors to determine the merits and
risks of such an investment.
Angel Broking Limited, its affiliates, directors, its proprietary trading and investment businesses may, from time to time, make
investment decisions that are inconsistent with or contradictory to the recommendations expressed herein. The views contained in this
document are those of the analyst, and the company may or may not subscribe to all the views expressed within.
Reports based on technical and derivative analysis center on studying charts of a stock's price movement, outstanding positions and
trading volume, as opposed to focusing on a company's fundamentals and, as such, may not match with a report on a company's
fundamentals.
The information in this document has been printed on the basis of publicly available information, internal data and other reliable
sources believed to be true, but we do not represent that it is accurate or complete and it should not be relied on as such, as this
document is for general guidance only. Angel Broking Limited or any of its affiliates/ group companies shall not be in any way
responsible for any loss or damage that may arise to any person from any inadvertent error in the information contained in this report.
Angel Broking Limited has not independently verified all the information contained within this document. Accordingly, we cannot testify,
nor make any representation or warranty, express or implied, to the accuracy, contents or data contained within this document. While
Angel Broking Limited endeavours to update on a reasonable basis the information discussed in this material, there may be regulatory,
compliance, or other reasons that prevent us from doing so.
This document is being supplied to you solely for your information, and its contents, information or data may not be reproduced,
redistributed or passed on, directly or indirectly.
Angel Broking Limited and its affiliates may seek to provide or have engaged in providing corporate finance, investment banking or
other advisory services in a merger or specific transaction to the companies referred to in this report, as on the date of this report or in
the past.
Neither Angel Broking Limited, nor its directors, employees or affiliates shall be liable for any loss or damage that may arise from or in
connection with the use of this information.
Note: Please refer to the important `Stock Holding Disclosure' report on the Angel website (Research Section). Also, please
refer to the latest update on respective stocks for the disclosure status in respect of those stocks. Angel Broking Limited and
its affiliates may have investment positions in the stocks recommended in this report.
Disclosure of Interest Statement Hindalco
1. Analyst ownership of the stock No
2. Angel and its Group companies ownership of the stock Yes
3. Angel and its Group companies' Directors ownership of the stock No
4. Broking relationship with company covered No
Note: We have not considered any Exposure below Rs 1 lakh for Angel, its Group companies and Directors.
Ratings (Returns) : Buy (> 15%) Accumulate (5% to 15%) Neutral (-5 to 5%)
Reduce (-5% to 15%) Sell (< -15%)
August 10, 2010 12