Monthly Economic Monitoring of Ukraine No 231, April 2024
Hcl tech 1 qfy2011-211010
1. 1QFY2011 Result Update | IT
October 21, 2010
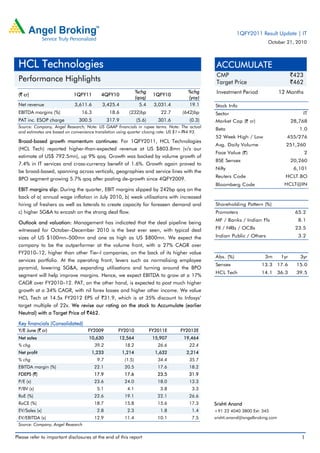
HCL Technologies ACCUMULATE
CMP `423
Performance Highlights Target Price `462
(` cr) 1QFY11 4QFY10
%chg
1QFY10
%chg Investment Period 12 Months
(qoq) (yoy)
Net revenue 3,611.6 3,425.4 5.4 3,031.4 19.1 Stock Info
EBITDA margins (%) 16.3 18.6 (232)bp 22.7 (642)bp Sector IT
PAT inc. ESOP charge 300.5 317.9 (5.6) 301.6 (0.3) Market Cap (` cr) 28,768
Source: Company, Angel Research; Note: US GAAP financials in rupee terms. Note: The actual
Beta 1.0
and estimates are based on convenience translation using quarter closing rate: US $1=`44.93.
52 Week High / Low 455/276
Broad-based growth momentum continues: For 1QFY2011, HCL Technologies
Avg. Daily Volume 251,260
(HCL Tech) reported higher-than-expected revenue at US $803.8mn (v/s our
Face Value (`) 2
estimate of US$ 792.5mn), up 9% qoq. Growth was backed by volume growth of
BSE Sensex 20,260
7.4% in IT services and cross-currency benefit of 1.6%. Growth again proved to
Nifty 6,101
be broad-based, spanning across verticals, geographies and service lines with the
Reuters Code HCLT.BO
BPO segment growing 5.7% qoq after posting de-growth since 4QFY2009.
Bloomberg Code HCLT@IN
EBIT margins slip: During the quarter, EBIT margins slipped by 242bp qoq on the
back of a) annual wage inflation in July 2010, b) weak utilisations with increased
hiring of freshers as well as laterals to create capacity for foreseen demand and Shareholding Pattern (%)
c) higher SG&A to encash on the strong deal flow. Promoters 65.2
MF / Banks / Indian Fls 8.1
Outlook and valuation: Management has indicated that the deal pipeline being
witnessed for October–December 2010 is the best ever seen, with typical deal FII / NRIs / OCBs 23.5
sizes of US $100mn–500mn and one as high as US $800mn. We expect the Indian Public / Others 3.2
company to be the outperformer at the volume front, with a 27% CAGR over
FY2010–12, higher than other Tier-I companies, on the back of its higher value
Abs. (%) 3m 1yr 3yr
services portfolio. At the operating front, levers such as normalising employee
Sensex 13.3 17.6 15.0
pyramid, lowering SG&A, expanding utilisations and turning around the BPO
HCL Tech 14.1 36.3 39.5
segment will help improve margins. Hence, we expect EBITDA to grow at a 17%
CAGR over FY2010–12. PAT, on the other hand, is expected to post much higher
growth at a 34% CAGR, with nil forex losses and higher other income. We value
HCL Tech at 14.5x FY2012 EPS of `31.9, which is at 35% discount to Infosys’
target multiple of 22x. We revise our rating on the stock to Accumulate (earlier
Neutral) with a Target Price of `462.
Key financials (Consolidated)
Y/E June (` cr) FY2009 FY2010 FY2011E FY2012E
Net sales 10,630 12,564 15,907 19,464
% chg 39.2 18.2 26.6 22.4
Net profit 1,233 1,214 1,632 2,214
% chg 9.7 (1.5) 34.4 35.7
EBITDA margin (%) 22.1 20.5 17.6 18.2
FDEPS (`) 17.9 17.6 23.5 31.9
P/E (x) 23.6 24.0 18.0 13.3
P/BV (x) 5.1 4.1 3.8 3.3
RoE (%) 22.6 19.1 22.1 26.6
RoCE (%) 18.7 15.8 15.6 17.3 Srishti Anand
EV/Sales (x) 2.8 2.3 1.8 1.4 +91 22 4040 3800 Ext: 345
EV/EBITDA (x) 12.9 11.4 10.1 7.5 srishti.anand@angelbroking.com
Source: Company, Angel Research
Please refer to important disclosures at the end of this report 1
2. HCL Technologies | 1QFY2011 Result Update
Exhibit 1: 1QFY2011 performance(Consolidated, US GAAP)
Y/E June (` cr) 1QFY2011* 4QFY2010 % chg 1Q FY2010 % chg
Revenue 3,612 3,425 5.4 3,031 19.1
Direct costs 2,469 2,292 7.7 1,915 28.9
Gross profit 1,143 1,133 0.9 1,117 2.3
SG&A 555 495 12.2 428 29.8
EBITDA 588 638 (7.9) 689 (14.7)
Depreciation 104 101 2.6 98 5.7
Amortisation 18 12 50.8 44 (58.6)
EBIT 466 525 (11.3) 547 (14.8)
Forex gain/(loss) (64) (137) (150)
Other income, net 0 (21) (6)
Provision for tax 80 25 215.7 70 14.2
Share of minority interest (0) (0)
Net income 323 342 (5.6) 320 0.7
ESOP charges 22 24 (6.4) 19 18.3
Net income after ESOP charges 301 318 (5.6) 302 (0.3)
Basic (`) 4.42 4.70 (5.9) 4.50 (1.6)
Diluted (`) 4.33 4.60 (5.9) 4.40 (1.7)
Gross margin (%) 31.6 33.1 (143)bp 36.8 (376)bp
EBITDA margin (%) 16.3 18.6 (236)bp 22.7 (409)bp
EBIT margin (%) 12.9 15.3 (243)bp 18.0 (272)bp
Source: Company, Angel Research; Note:* Numbers based on convenience translation using closing rate as of the last day of quarter: US $1=`44.93
Exhibit 2: 1QFY2011 – Actual v/s Angel estimates
(` cr) Estimates Actual % Variation
Net revenue 3562.9 3,611.6 1.4
EBIT margins 12.9 12.9 0.0
PAT * 269.1 300.5 11.7
Source: Company, Angel Research; Note: *After ESOP charges
Strong revenue growth continues led by high volume momentum
For 1QFY2011, HCL Tech reported higher-than-expected revenue at
US $803.8mn (v/s our estimate of US$ 792.5mn), up 9% qoq. Growth was
backed by volume growth of 7.4% in IT services and cross-currency benefit of
1.6%. Growth again proved to be broad-based, spanning across verticals,
geographies and service lines.
During the quarter, the company witnessed persistent volume growth of 7.9% qoq
in core software services even on the back of double-digit volume growth seen in
4QFY2010. Volume growth was strong for the onsite as well as offshore segments,
up 7.7% and 7.9%, respectively.
October 21, 2010 2
4. HCL Technologies | 1QFY2011 Result Update
Exhibit 5: Trend in revenue growth (service wise in constant currency)
15.0
5.0
%
(5.0)
1QFY10 2QFY10 3QFY10 4QFY10 1QFY11
(15.0)
Enterprise Application Services(EAS) Engineering and R&D Services (ERD)
Custom Application Infrastructure Services (IMS)
BPO Services
Source: Company, Angel Research
During the quarter, growth in core software was strong at 9.3% qoq due to decent
growth in EAS (4.7% qoq) and ERD (3.2% qoq) services, respectively, even on the
back of double-digit growth witnessed in 4QFY2010. Demand for ERD across
industries was driven by increased demand for electronics to enhance device
intelligence and processing as well as to address the customisation needs of
emerging markets. Primarily, the spend in product engineering is going strong on
the back of ’hope-based investments’ in the US i.e., to tap the future consumer
spending opportunity and cost savings drive initiated by clients in Japan. Growth in
consumer electronics is driving growth in sectors like semi conductor. In addition,
custom applications, the highest revenue contributor (30.4%), posted whopping
12.9% qoq growth during the quarter.
The infrastructure services segment grew by 7.6% qoq in constant currency and
was further aided by favourable cross-currency movement, resulting in 8.9% qoq
revenue growth to US $180mn. Currently, the segment is witnessing demand from
transformational outsourcing and system integration/life cycle management.
Europe and US continue to accelerate traction for reducing operations cost, which
is driving transformational outsourcing. A large part of the deal flow is due to the
churn in contract renewals.
The BPO segment returned to its growth path, after five quarters of free fall. During
the quarter, the segment grew by 2.9% qoq in constant currency. The demand
environment is heating up as clients are looking at globalisation of delivery
capabilities, which is driving transformation and enterprise-wide cost efficiency.
Change in business offerings has also led to growth in non-traditional verticals like
1) banking and 2) media, publishing and entertainment (MPE).
The anchor verticals, including financial services (25.2% to revenue) and
manufacturing (27.2% to revenue), continued their growth momentum. In the
financial services space, sectors such as banking in Asia and Europe; capital
markets in the US; and insurance in Europe emerged as IT spenders.
In addition, the telecom sector (11% to revenue), which has been the troubled
vertical in the past, posted growth in line with the company’s average. The retail
and consumer product group (CPG) sector (8.5% to revenue) was the outperformer
with 11.2% qoq revenue growth because of clients going in for vendor
rationalisation. The life sciences sector (8.4% to revenue) emerged as the primary
October 21, 2010 4
5. HCL Technologies | 1QFY2011 Result Update
growth driver, posting double-digit revenue growth of 10.5% qoq during the
quarter.
Exhibit 6: Trend in revenue growth (industry wise in constant currency)
Growth by vertical (%) 1QFY10 2QFY10 3QFY10 4QFY10 1QFY11
Financial services 7.3 0.4 5.5 8.3 7.2
Hi-tech and manufacturing (8.3) (4.1) 10.5 10.4 7.9
Telecom 5.3 (0.9) 0.4 2.9 7.2
Retail & CPG 7.5 16.5 1.0 19.6 11.2
MPE 26.4 10.1 16.3 1.5 1.3
Life sciences 3.5 16.2 10.2 19.3 10.5
Energy, utilities & public sector (EPU) (7.3) 10.0 1.8 6.8 6.5
Others 12.8 (0.1) 10.3 5.7 4.5
Source: Company, Angel Research
Since 4QFY2009, US has been the primary growth driver for HCL Tech, while
Europe remained a soft spender. However, with business for manufacturing as well
as energy and utilities clients in Europe returning to normalcy, clients in these
industries are back to spending on higher value-added services like EAS and ERD.
The business motive of European clients to spend on IT is primarily related to drive
cost efficiencies by outsourcing run-the-business (RTB) type of work and through
rationalisation of existing multiple applications and systems. US has been the
frontrunner in awarding transformational deals to the company, as industries such
as insurance and retail are focusing on digital consumer behaviour and, hence,
are investing in customer relationship management solutions. Asia, on the other
hand, is witnessing more of greenfield projects, relating to clients looking out for
global expansion.
Exhibit 7: Revenue growth trend (geography wise in constant currency)
18
14
10
(%)
6
2
-2 1QFY10 2QFY10 3QFY10 4QFY10 1QFY11
US Europe Asia Pacific
Source: Company, Angel Research
October 21, 2010 5
6. HCL Technologies | 1QFY2011 Result Update
Hiring spree continues, but drift to freshers hampers utilisation
During the quarter, HCL Tech, in line with its peers, reported strong net additions
of 4,347 employees in the software services segment. The aggressive hiring
indicates that the company foresees a strong deal pipeline for transformational
projects. The infrastructure segment, which has been growing at a scorching pace,
reported net addition of 980 employees in 1QFY2011 itself. The BPO segment,
which was witnessing employee rationalisation in the past quarters, gained
momentum during 1QFY2011 and continued to hire more employees.
Exhibit 8: Trend in hiring (net addition, service wise)
1QFY10 2QFY10 3QFY10 4QFY10 1QFY11
Software services (52) 1,143 2,714 4,944 4,347
Infrastructure services 717 548 438 465 980
BPO (438) (446) (711) 1,019 334
Source: Company, Angel Research
Utilisations, including and excluding trainees, dropped by 290bp qoq each during
the quarter. The decline in utilisations was because of 1) the hiring mix having
relatively higher proportion of trainees in 1QFY2011 v/s 4QFY2010 and 2) the
company hiring in laterals with specific skill sets to address future assignments.
Exhibit 9: Trend in utilisation (%)
100
90
(%)
80
70
Q4FY09 1QFY10 2QFY10 3QFY10 4QFY10 1QFY11
Offshore-Including trainees Offshore-Excluding trainees Onsite
Source: Company, Angel Research
EBIT margins slip
During 1QFY2011, the company’s EBIT margins slipped by 242bp qoq to 12.9%,
in line with our expectation. The decline in EBIT margins was on account of
1) wage inflation, which led to a 294bp qoq decline in margins and 2) higher
SG&A investment due to an increase in sales headcount, which was deployed to
tap emerging geographies like continental Europe, south Africa and middle east
and verticals like public services, which impacted margins by 33bp qoq and
3) lower utilisation due to creation of the bench, including freshers and laterals, to
map any surge in volumes from the robust deal pipeline, which led to a 20bp
margin decline.
These factors overshadowed the margin gains of 53bp and 52bp on account of
improved operational efficiency and better exchange rate, respectively.
October 21, 2010 6
7. HCL Technologies | 1QFY2011 Result Update
Segment wise, the BPO segment managed to pull up its gross margins by 560bp
qoq. However, at the EBIT level, the segment reported losses and will continue to
do so, as it is expected to be in the investment mode for the next five quarters.
Exhibit 10: BPO segment – Margin trend
40
30
20
(%)
10
0
1QFY10 2QFY10 3QFY10 4QFY10 1QFY11
(10)
(20)
Gross Margin EBITDA margin EBIT margin
Source: Company, Angel Research
Client pyramid strengthens
During the quarter, HCL Tech witnessed a qualitative client addition, as clients in
the higher bracket migrated to higher billing segments. For instance, one of the
clients migrated from US $40mn–50mn to the US $50mn–100mn bracket.
In addition, out of the 48 new clients added, nine clients were added in the
US $1mn plus bracket; further, out of these nine clients, two were directly added in
the US $30mn–40mn bracket and three were added in the US $5mn–20mn
bracket. This is because the company added five new clients belonging to the
Fortune 500 league. Also, the top clients are registering strong growth, with the
top 5, top 10 and top 20 growing by 9.7%, 10.4% and 11.2% qoq, respectively.
Exhibit 11: Client pyramid
Client 2QFY10 3QFY10 4QFY10 1QFY11
Active clients 399 404 408 426
New clients 36 39 51 48
US $1–5mn 177 175 176 180
US $5–10mn 53 51 49 48
US $10–20mn 30 33 34 38
US $20–30mn 12 12 12 12
US $30–40mn 2 3 5 7
US $40–50mn 3 2 2 1
US $50–100mn 3 4 4 5
US $100mn plus 1 1 1 1
Source: Company, Angel Research
October 21, 2010 7
8. HCL Technologies | 1QFY2011 Result Update
Outlook and valuation
HCL Tech is witnessing a strong deal pipeline for October–December 2010, which
is almost 25% higher than that witnessed in October–December 2008, which
witnessed total contract value (TCV) of almost US $1bn.
The typical TCV of the deal pipeline is US $100mn–500mn, with one of the deal
as high as US $800mn. This pipeline again is more broad-based, with higher
proportion of transformational type of projects. The company has been witnessing
an 8.5% volume CQGR over 2QFY2010–1QFY2011 in its core software business
on the back of the return of discretionary type of spending i.e., more
transformational engagements with increasing components of enterprise
application services. Also, clients are increasingly looking at outsourcing
engineering and R&D services to encash the surge in consumer spending.
Infrastructure management, which proved to be the growth driver even in the
downturn, has also witnessed double-digit revenue growth at a 10% CQGR over
1QFY2010–1QFY2011. Further, management is witnessing a rise in outsourcing
infrastructure and applications by clients to derive cost efficiencies.
We expect HCL Tech to be the outperformer at the volume front amongst Tier-I
companies on the back of higher value services portfolio, which is gaining
momentum with clients’ businesses getting to normalcy. We expect revenue in
dollar terms to grow at a 27% CAGR over FY2010–12, with a 24% CAGR in rupee
terms over the same period. At the operating front, the company has many levers
such as 1) normalising employee pyramid (i.e. hiring more low-cost freshers),
2) reaping the benefits of high investments in SG&A planned in 1HFY2011,
3) increasing utilisation (including trainees), which was as low as 70.1% (end of
1QFY2011) and 4) turning around the BPO business by returning it to profitability
by 2HFY2012. Thus, we expect EBITDA margins to remain subdued in FY2011 at
17.6% (v/s 20.5% in FY2010) and expand to 18.2% in FY2012 on the back of the
mentioned levers. Going forward, we expect EBITDA to grow at a 17% CAGR over
FY2010–12, but PAT growth will be much higher at a 34% CAGR over the same
period on the back of nil forex losses, improved profitability in FY2012 and better
other income to be accrued from higher liquid investments.
At the CMP of `423, the stock is trading at 13.4x FY2012 EPS of `31.9 at a 37%
discount to Infosys (as compared to its one-year historical discount of 35%).
We value the stock at 14.5x FY2012 EPS. We revise our rating on the stock to
Accumulate (earlier Neutral) with a Target Price of `462.
October 21, 2010 8
9. HCL Technologies | 1QFY2011 Result Update
Exhibit 12: Key assumption
FY2011E FY2012E
Volume growth 30.1 24.7
Pricing growth 0 0
Revenue growth (US $) 30.1 24.7
USD-INR rate (realised) 45.2 44.4
Revenue growth (%) 26.6 22.4
EBITDA margin (%) 17.6 18.2
Tax rate (%) 21.8 24.0
EPS growth (%) 33.2 35.7
Source: Company, Angel Research
Exhibit 13: Change in estimates
FY2011E FY2012E
Parameter Earlier Revised Variation Earlier Revised Variation
(` cr) estimates estimates (%) estimates estimates (%)
Net revenue 15,276 15,907 4.1 18,063 19,464 7.8
EBITDA 2,816 2,803 (0.4) 3,437 3,537 2.9
Other income 25 12 (51.3) 107 81 (24.5)
PBT 2,329 2,280 (2.1) 2,939 2,976 1.3
Tax 499 497 (0.4) 735 714 (2.8)
PAT 1,653 1,632 (1.3) 2,157 2,214 2.7
Source: Company, Angel Research
We have revised our revenue estimates upwards on the back of strong growth
momentum registered yet again by the company as well as robust deal pipeline.
EBITDA for FY2011 has been scaled down due to stronger rupee assumption,
higher SG&A and lower utilisation in 1HFY2011.
For FY2012, we expect SG&A to come back to its normal levels and utilisations to
increase on the back of better lateral-fresher mix. This along with BPO turnaround
and favourable employee pyramid (hiring more low-cost freshers) will cushion
margins from 2HFY2011. PAT for FY2012 has been revised upwards on the back
of better profitability, lower tax rate and nil forex losses.
October 21, 2010 9
15. HCL Technologies | 1QFY2011 Result Update
Research Team Tel: 022 - 4040 3800 E-mail: research@angeltrade.com Website: www.angeltrade.com
DISCLAIMER
This document is solely for the personal information of the recipient, and must not be singularly used as the basis of any investment
decision. Nothing in this document should be construed as investment or financial advice. Each recipient of this document should make
such investigations as they deem necessary to arrive at an independent evaluation of an investment in the securities of the companies
referred to in this document (including the merits and risks involved), and should consult their own advisors to determine the merits and
risks of such an investment.
Angel Broking Limited, its affiliates, directors, its proprietary trading and investment businesses may, from time to time, make
investment decisions that are inconsistent with or contradictory to the recommendations expressed herein. The views contained in this
document are those of the analyst, and the company may or may not subscribe to all the views expressed within.
Reports based on technical and derivative analysis center on studying charts of a stock's price movement, outstanding positions and
trading volume, as opposed to focusing on a company's fundamentals and, as such, may not match with a report on a company's
fundamentals.
The information in this document has been printed on the basis of publicly available information, internal data and other reliable
sources believed to be true, but we do not represent that it is accurate or complete and it should not be relied on as such, as this
document is for general guidance only. Angel Broking Limited or any of its affiliates/ group companies shall not be in any way
responsible for any loss or damage that may arise to any person from any inadvertent error in the information contained in this report.
Angel Broking Limited has not independently verified all the information contained within this document. Accordingly, we cannot testify,
nor make any representation or warranty, express or implied, to the accuracy, contents or data contained within this document. While
Angel Broking Limited endeavours to update on a reasonable basis the information discussed in this material, there may be regulatory,
compliance, or other reasons that prevent us from doing so.
This document is being supplied to you solely for your information, and its contents, information or data may not be reproduced,
redistributed or passed on, directly or indirectly.
Angel Broking Limited and its affiliates may seek to provide or have engaged in providing corporate finance, investment banking or
other advisory services in a merger or specific transaction to the companies referred to in this report, as on the date of this report or in
the past.
Neither Angel Broking Limited, nor its directors, employees or affiliates shall be liable for any loss or damage that may arise from or in
connection with the use of this information.
Note: Please refer to the important `Stock Holding Disclosure' report on the Angel website (Research Section). Also, please
refer to the latest update on respective stocks for the disclosure status in respect of those stocks. Angel Broking Limited and
its affiliates may have investment positions in the stocks recommended in this report.
Disclosure of Interest Statement HCL Tech
1. Analyst ownership of the stock No
2. Angel and its Group companies ownership of the stock Yes
3. Angel and its Group companies' Directors ownership of the stock No
4. Broking relationship with company covered No
Note: We have not considered any Exposure below `1 lakh for Angel, its Group companies and Directors
Ratings (Returns): Buy (> 15%) Accumulate (5% to 15%) Neutral (-5 to 5%)
Reduce (-5% to 15%) Sell (< -15%)
October 21, 2010 15