1. 4QFY2010 Result Update I Pharmaceutical
May 10, 2010
Cipla ACCUMULATE
CMP Rs320
Performance Highlights Target Price Rs360
Cipla’s 4QFY2010 results were subdued owing to the lower-than-expected Investment Period 12 Months
technical know-how fees (tech fees), which stood at Rs13.6cr, down 86.4%
yoy. The company reported in-line Net Sales of Rs1,318cr driven by the Stock Info
Domestic and Export Formulations Segments, while OPM (excluding the tech Sector Pharmaceutical
fees) stood at 15.2%, down by 270bp. As a result, Net Profit for the quarter,
excluding the one-off income from sale of the i-pill brand, fell 28.6%. Cipla Market Cap (Rs cr) 25,681
has guided for 8-10% Revenue growth for FY2011 and maintain OPM at Beta 0.5
current levels of 20% (excluding tech fees), which does not factor in upside
from the Inhaler business in the EU region and potential supply contracts with 52 WK High / Low 363 / 211
global MNC players. We maintain an Accumulate on the stock as we expect
Avg. Daily Volume 349,117
the company to reap benefits of the capex incurred over the last three years
from FY2012E onwards. Face Value (Rs) 2
Disappointing quarter: Cipla’s Net Sales at Rs1,318 increased 6.7% and was BSE Sensex 17,331
in line with our estimate. The Domestic Formulation business grew 8.5% to
Rs568.8cr (Rs524.5cr) on volume growth. However, the Exports Segment grew Nifty 5,194
a mere 5.0% to Rs760.2cr (Rs724.2cr) following de-growth on the API front, Reuters Code CIPL.BO
which fell 13.4% to Rs146.3cr (Rs168.9cr) impacted by Rupee appreciation
and seasonality. Cipla reported OPM of 15.2% (17.9%) (excluding the tech Bloomberg Code CIPLA@IN
fees), down by 270bp due to higher Employee expenses. Net Profit at Shareholding Pattern (%)
Rs275.5cr (252.9cr) was buoyed by the one-time income of Rs95cr from sale
of the I-pill brand. Excluding the one-off, Net Profit de-grew 28.6% to Promoters 36.8
Rs180.5cr (Rs252.9cr) on the back of lower tech fees. For FY2010, Net Sales
MF/Banks/Indian FIs 20.6
stood at Rs5,358cr (Rs4,961cr), up 8.0%, while OPM stood at 20.3% (19.1%)
(excluding tech fees) and Net Profit came in at Rs1,082cr (Rs771.0cr), up FII/NRIs/OCBs 21.0
40.3%.
Indian Public 21.6
Outlook and Valuation: Cipla is likely to be on growth trajectory following its
entry into the EU Inhaler market and potential of new long-term Abs. (%) 3m 1yr 3yr
manufacturing contracts with global MNC players. Further, aggressive capex Sensex 8.8 45.9 25.8
rollout indicates the company’s comfort levels on its future growth prospects.
We expect Net Sales to post CAGR of 12.2% to Rs6,744cr and its EPS to clock Cipla 2.4 41.3 53.8
a CAGR of 12.7% to Rs17.1 over FY2010-12E. At current levels, the stock is
trading at 23.0x and 18.7x FY2011E and FY2012E Earnings, respectively. We
maintain an Accumulate on the stock, with a Target Price of Rs360, valuing
the company at 21x FY2012E Earnings.
Key Financials (Consolidated)
Y/E March (Rs cr) FY2009 FY2010E FY2011E FY2012E
Net Sales 4,961 5,358 5,857 6,744
% chg 23.7 8.0 9.3 15.2
Net Profit 771 1,082 1,119 1,375
% chg 9.9 40.3 3.4 22.9
EPS (Rs) 9.9 13.5 13.9 17.1
EBITDA Margin (%) 19.1 20.3 20.2 21.1
P/E (x) 32.3 23.7 23.0 18.7 Sarabjit Kour Nangra
RoE (%) 24.8 19.4 17.9 19.1 Tel: 022 – 4040 3800 Ext: 343
RoCE (%) 16.1 15.0 13.8 15.3 E-mail: sarabjit@angeltrade.com
P/BV (x) 5.7 4.4 3.9 3.3
Sushant Dalmia
EV/Sales (x) 5.2 4.8 4.4 3.8 Tel: 022 – 4040 3800 Ext: 320
EV/EBITDA (x) 27.2 23.8 21.7 18.0 E-mail: sushant.dalmia@angeltrade.com
Source: Company, Angel Research.
1
Please refer to important disclosures at the end of this report Sebi Registration No: INB 010996539
2. Cipla I 4QFY2010 Result Update
Exhibit 1: 4QFY2010 Performance
Y/E March (Rs cr) 4QFY10 4QFY09 % chg FY10 FY09 % chg
Net Sales 1,318 1,235 6.7 5,358 4,961 8.0
Other Income 102.3 143.0 (28.5) 359.6 365.4 (1.6)
Total Income 1,420 1,378 3.0 5,718 5,326 7.4
PBIDT 200.8 221.6 (9.4) 1088.2 948.1 14.8
OPM (%) 15.2 17.9 20.3 19.1
Interest 0.5 13.3 (96.5) 23.7 32.9 (28.2)
Depreciation 49.5 55.7 (11.1) 188.8 151.8 24.4
PBT 253.1 295.7 (14.4) 1,235 1,129 9.4
Provision for Taxation 72.6 42.8 69.8 248.5 124.5 99.6
PAT before Extra-ordinary
180.5 252.9 (28.6) 987 1,004 (1.7)
item
Extra-ordinary
(95.0) 0.0 (95.0) 233.3
Items/(Income)
PAT after Extra-ordinary item 275.5 252.9 8.9 1,082 771.0 40.3
EPS (Rs) 3.4 3.3 13.5 9.9
Source: Company, Angel Research
Key Highlights
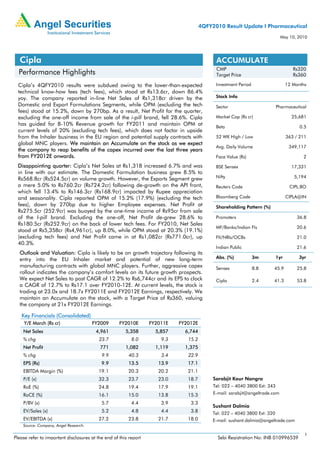
Revenue in line driven by Domestic Formulations: For the quarter, Cipla reported
Net Sales of Rs1,318cr (Rs1,235cr), up 6.7% yoy. Domestic Formulation business
grew 8.5% to Rs568.8cr (Rs524.5cr) on volume growth. However, the Export
Segment grew by a mere 5.0% to Rs760.2cr (Rs724.2cr) following de-growth on the
API front, which fell 13.4% to Rs146.3cr (Rs168.9cr) impacted by Rupee
appreciation and seasonality. The Export Formulation Segment grew 10.6% to
Rs613.9cr (Rs555.3cr). Cipla launched Salbutamol inhalers in the UK, has received
approvals for Budesonide inhalers in Germany and Portugal and Beclomethasone in
Portugal. Cipla has developed 8 HFA inhalers for the EU region of which six have
been submitted for regulatory approvals. In the US, the company has 57 approved
ANDAs of which 35 have been launched, while 41 are pending approval. For
FY2010, the company reported Net Sales of Rs5,358cr (Rs4,961cr), up 8.0%
meeting the lower end of the guidance of 8-10% growth.
Exhibit 2: Sales Break-up
800 752 760
724
688 699
652 659
631
600 569
524
Rs cr
400
200
0
4QFY2009 1QFY2010 2QFY2010 3QFY2010 4QFY2010
Domestic Export
Source: Company, Angel Research
May 10, 2010 2
3. Cipla I 4QFY2010 Result Update
OPM contracts on high Employee Expenses: Cipla reported OPM of 15.2% (17.9%)
(excluding the tech fees) for 4QFY2010, down by 270bp on higher Employee
Expenses, which increased 28.4% to Rs99.9cr (Rs77.8cr). For FY2010, the company
reported OPM of 20.3% (19.1%), expanding by 120bp.
Exhibit 3: OPM Trend
25.0
22.5
21.9 21.2
20.0
17.9
15.0 15.2
%
10.0
5.0
4QFY2009 1QFY2010 2QFY2010 3QFY2010 4QFY2010
Source: Company, Angel Research
Recurring Bottom-line impacted by lower Technical know-how fees: Cipla reported
Net Profit of Rs275.5cr (Rs252.9cr) buoyed by one-time income of Rs95cr from sale
of the I-pill brand. Excluding the one-off, Net Profit de-grew 28.6% to Rs180.5cr
(Rs252.9cr) on lower tech fees. Cipla reported tech fees of Rs13.6cr (Rs99.9cr),
down 86.4% yoy on a high base. While Interest cost decreased 96.5% to Rs0.5cr
(Rs13.3cr) on he back of re-payment of Debt and lower Interest rate. For FY2010
the company reported Net Profit of Rs1,082cr (Rs771.0cr), up 40.3% yoy driven by
one-off income.
Other Takeaways
• For FY2011, Cipla has guided for 8-10% overall Revenues including Domestic
growth of 8-10% and Export growth of 10-12%. The company expects to
maintain current OPMs of 20% (excluding the tech fees) for FY2011 also.
The guidance however excludes any significant upside from launch of Inhalers
in the EU region and contracts from global MNCs. Further, the company has
guided for total Operating Income in the range of Rs250-300cr (including tech
fees of Rs150cr). Forex covers, as on March 2010, stands at US $200mn
booked at Rs47/US $.
• Cipla incurred capex of Rs600cr in FY2010. In FY2011, the company plans to
incur additional capex of Rs600cr towards the Patalganga API and R&D facility,
Vikroli R&D unit and normal capex. Capacity utilisation for the company stands
at 75% (excluding the recently commenced Indore facility).
• Cipla has also indicated that it is in talks with the global MNCs for potential
supply agreements covering various geographies.
May 10, 2010 3
4. Cipla I 4QFY2010 Result Update
Outlook and Valuation
Cipla is a leading Pharma player in India, with a strong presence in both the Export
and Domestic markets. On the Export front, where it follows the Partnership model,
it has 5,700 product registrations in around 180 countries. Cipla is a market leader
in the Domestic Formulation market with over 5% market share. Thus, the company
is one of the better defensive picks in the Pharma Sector given its low-risk
Partnership-based and Geographically-diversified model, which has proved to be a
robust and sustainable growth engine.
Cipla is likely to be on growth trajectory owing to its entry into the Inhaler market in
the EU and potential new long-term manufacturing contracts with the global MNC
players. Moreover, Cipla almost doubled its GFA in the last three years, which would
bear fruits from FY2012E onwards. We expect Net Sales to post a CAGR of 12.2%
to Rs6,744cr and EPS to clock a CAGR of 12.7% to Rs17.1 over FY2010-12E. The
stock is trading at 23.0x and 18.7x FY2011E and FY2012E Earnings, respectively.
We maintain an Accumulate on the stock, with a Target Price of Rs360, valuing the
company at 21x FY2012E Earnings.
Exhibit 4: One-year forward PE Band
500
400
25x
300 20x
Rs
15x
200
10x
100
-
Jul-05
Jul-06
Jul-07
Jul-08
Jul-09
Jan-06
Jan-07
Jan-08
Jan-09
Jan-10
Apr-05
Apr-06
Apr-07
Apr-08
Apr-09
Apr-10
Oct-05
Oct-06
Oct-07
Oct-08
Oct-09
Source: C-line, Angel Research
May 10, 2010 4
8. Cipla I 4QFY2010 Result Update
Research Team Tel: 022- 4040 3800 E-mail: research@angeltrade.com Website: www.angeltrade.com
DISCLAIMER
This document is solely for the personal information of the recipient, and must not be singularly used as the basis of any investment decision. Nothing in this
document should be construed as investment or financial advice. Each recipient of this document should make such investigations as they deem necessary to
arrive at an independent evaluation of an investment in the securities of the companies referred to in this document (including the merits and risks involved),
and should consult their own advisors to determine the merits and risks of such an investment.
Angel Securities Limited, its affiliates, directors, its proprietary trading and investment businesses may, from time to time, make investment decisions that are
inconsistent with or contradictory to the recommendations expressed herein. The views contained in this document are those of the analyst, and the company
may or may not subscribe to all the views expressed within.
Reports based on technical and derivative analysis center on studying charts of a stock's price movement, outstanding positions and trading volume, as
opposed to focusing on a company's fundamentals and, as such, may not match with a report on a company's fundamentals.
The information in this document has been printed on the basis of publicly available information, internal data and other reliable sources believed to be true,
and is for general guidance only. Angel Securities Limited has not independently verified all the information contained within this document. Accordingly, we
cannot testify, nor make any representation or warranty, express or implied, to the accuracy, contents or data contained within this document. While Angel
Securities Limited endeavours to update on a reasonable basis the information discussed in this material, there may be regulatory, compliance, or other
reasons that prevent us from doing so.
This document is being supplied to you solely for your information, and its contents, information or data may not be reproduced, redistributed or passed on,
directly or indirectly.
Angel Securities Limited and its affiliates may seek to provide or have engaged in providing corporate finance, investment banking or other advisory services
in a merger or specific transaction to the companies referred to in this report, as on the date of this report or in the past.
Neither Angel Securities Limited, nor its directors, employees or affiliates shall be liable for any loss or damage that may arise from or in connection with the
use of this information.
Note: Please refer to the important `Stock Holding Disclosure' report on the Angel website (Research Section).
Disclosure of Interest Statement Cipla
1. Analyst ownership of the stock No
2. Angel and its Group companies ownership of the stock Yes
3. Angel and its Group companies’ Directors ownership of the stock No
4. Broking relationship with company covered No
Note: We have not considered any Exposure below Rs 1 lakh for Angel and its Group companies.
Address: Acme Plaza, ‘A’ Wing, 3rd Floor, M.V. Road, Opp. Sangam Cinema, Andheri (E), Mumbai - 400 059.
Tel : (022) 3952 4568 / 4040 3800
Angel Broking Ltd: BSE Sebi Regn No : INB 010996539 / CDSL Regn No: IN - DP - CDSL - 234 - 2004 / PMS Regn Code: PM/INP000001546 Angel Securities Ltd:BSE: INB010994639/INF010994639 NSE:
INB230994635/INF230994635 Membership numbers: BSE 028/NSE:09946
Angel Capital & Debt Market Ltd: INB 231279838 / NSE FNO: INF 231279838 / NSE Member code -12798 Angel Commodities Broking (P) Ltd: MCX Member ID: 12685 / FMC Regn No: MCX / TCM /
CORP / 0037 NCDEX : Member ID 00220 / FMC Regn No: NCDEX / TCM / CORP / 0302
May 10, 2010 8