1. 4QFY2010 Result Update I Telecom
April 30, 2010
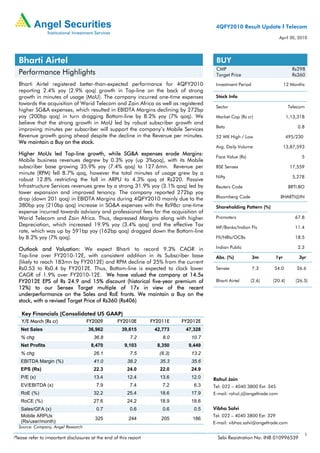
Bharti Airtel BUY
CMP Rs298
Performance Highlights Target Price Rs360
Bharti Airtel registered better-than-expected performance for 4QFY2010 Investment Period 12 Months
reporting 2.4% yoy (2.9% qoq) growth in Top-line on the back of strong
growth in minutes of usage (MoU). The company incurred one-time expenses Stock Info
towards the acquisition of Warid Telecom and Zain Africa as well as registered
Sector Telecom
higher SG&A expenses, which resulted in EBIDTA Margins declining by 272bp
yoy (200bp qoq) in turn dragging Bottom-line by 8.2% yoy (7% qoq). We Market Cap (Rs cr) 1,13,318
believe that the strong growth in MoU led by robust subscriber growth and
Beta 0.8
improving minutes per subscriber will support the company’s Mobile Services
Revenue growth going ahead despite the decline in the Revenue per minutes. 52 WK High / Low 495/230
We maintain a Buy on the stock.
Avg. Daily Volume 13,87,593
Higher MoUs led Top-line growth, while SG&A expenses erode Margins:
Face Value (Rs) 5
Mobile business revenues degrew by 0.3% yoy (up 3%qoq), with its Mobile
subscriber base growing 35.9% yoy (7.4% qoq) to 127.6mn. Revenue per BSE Sensex 17,559
minute (RPM) fell 8.7% qoq, however the total minutes of usage grew by a
Nifty 5,278
robust 12.8% restricting the fall in ARPU to 4.3% qoq at Rs220. Passive
Infrastructure Services revenues grew by a strong 31.9% yoy (3.1% qoq) led by Reuters Code BRTI.BO
tower expansion and improved tenancy. The company reported 272bp yoy
drop (down 201 qoq) in EBIDTA Margins during 4QFY2010 mainly due to the Bloomberg Code BHARTI@IN
380bp yoy (210bp qoq) increase in SG&A expenses with the Rs98cr one-time Shareholding Pattern (%)
expense incurred towards advisory and professional fees for the acquisition of
Warid Telecom and Zain Africa. Thus, depressed Margins along with higher Promoters 67.8
Depreciation, which increased 19.9% yoy (3.4% qoq) and the effective Tax MF/Banks/Indian FIs 11.4
rate, which was up by 591bp yoy (162bp qoq) dragged down the Bottom-line
by 8.2% yoy (7% qoq). FII/NRIs/OCBs 18.5
Outlook and Valuation: We expect Bharti to record 9.3% CAGR in Indian Public 2.3
Top-line over FY2010-12E, with consistent addition in its Subscriber base Abs. (%) 3m 1yr 3yr
(likely to reach 183mn by FY2012E) and RPM decline of 25% from the current
Rs0.53 to Rs0.4 by FY2012E. Thus, Bottom-line is expected to clock lower Sensex 7.3 54.0 26.6
CAGR of 1.9% over FY2010-12E. We have valued the company at 14.5x
FY2012E EPS of Rs 24.9 and 15% discount (historical five-year premium of Bharti Airtel (2.6) (20.4) (26.5)
12%) to our Sensex Target multiple of 17x in view of the recent
underperformance on the Sales and RoE fronts. We maintain a Buy on the
stock, with a revised Target Price of Rs360 (Rs406)
Key Financials (Consolidated US GAAP)
Y/E March (Rs cr) FY2009 FY2010E FY2011E FY2012E
Net Sales 36,962 39,615 42,773 47,328
% chg 36.8 7.2 8.0 10.7
Net Profits 8,470 9,103 8,350 9,449
% chg 26.1 7.5 (8.3) 13.2
EBITDA Margin (%) 41.0 38.2 35.3 35.6
EPS (Rs) 22.3 24.0 22.0 24.9
P/E (x) 13.4 12.4 13.6 12.0 Rahul Jain
EV/EBITDA (x) 7.9 7.4 7.2 6.3 Tel: 022 – 4040 3800 Ext: 345
RoE (%) 32.2 25.4 18.6 17.9 E-mail: rahul.j@angeltrade.com
RoCE (%) 27.6 24.2 18.9 18.6
Sales/GFA (x) 0.7 0.6 0.6 0.5 Vibha Salvi
Mobile ARPUs Tel: 022 – 4040 3800 Ext: 329
325 244 205 186
(Rs/user/month) E-mail: vibhas.salvi@angeltrade.com
Source: Company, Angel Research
1
Please refer to important disclosures at the end of this report Sebi Registration No: INB 010996539
2. Bharti Airtel I 4QFY2010 Result Update
Exhibit 1: 4QFY2010 Performance (Consolidated)
Y/E March (Rs cr) 4QFY2010 4QFY2009 % chg 3QFY2010 % chg FY2010 FY2009 % chg
(yoy) (qoq) (yoy)
Net Revenues 10,056 9,825 2.4 9,772 2.9 39,615 36,962 7.2
Operating Expenditure 6,234 5,823 7.0 5,861 6.4 23,588 21,794 8.2
Operating Profit (EBITDA) 3,822 4,001 (4.5) 3,911 (2.3) 16,027 15,168 5.7
Other Income 46 43 7.5 22 104.9 127 152 (16.3)
Interest Earned (Net) 184 (214) 177 3.9 578 (1,161)
Depreciation 1,593 1,329 19.9 1,540 3.4 6,046 4,758 27.1
Share of Profits in Associates/JVs 0 (6) 6 29 (71)
Non-Operating Expenses 0 6 4 18 22
Income before Income Taxes 2,459 2,491 (1.3) 2,572 (4.4) 10,698 9,307 14.9
Tax 345 202 70.7 319 8.1 1,396 662 111.0
Minority Interest 58 49 18.8 43 36.9 199 176
Net Income 2,055 2,239 (8.2) 2,210 (7.0) 9,103 8,470 7.5
Diluted EPS (Rs) 5.4 5.9 (8.1) 5.8 (7.0) 24.0 22.3 7.5
EBITDA Margin (%) 38.0 40.7 40.0 40.5 41.0 78.9
Net Profit Margin (%) 20.4 22.8 22.6 23.0 22.9
Mobile ARPUs (Rs/user/month) 220 305 (27.9) 231 (4.3) 247 328 (24.8)
Source: Company, Angel Research
Highest ever Subscriber addition, increase in MoU aids Top-line growth
Bharti Airtel recorded 2.4% yoy (2.9% qoq) growth in Net Revenue for 4QFY2010
mainly on account of the strong growth in its Tower business and other businesses
(DTH, IPTV) that registered 31.9% and 121.6% yoy growth. Though the Mobile
business de-grew by a marginal 0.3% yoy, it witnessed a recovery of 3% qoq
supported by the 12.8% growth in total MoUs. Mobile revenues per user per month
(ARPUs) declined 27.4% yoy (4.2% qoq) to Rs220 on account of ongoing competitive
tariff wars and new low-cost pricing plans, which also resulted in increase in the
subscriber base and MoUs during the quarter. Substantial subscribers migrated from
the existing to the new pricing plans during the quarter. The Mobile subscriber base
was up 35.9% yoy (7.4% qoq) and stood at 127.6mn as on 4QFY2010. MoU per
month fell 3.5% yoy, but recovered 4.9% qoq to 468 mainly due to the new pricing
plans giving customers the leeway to opt either for the per minute or per second
billing, which was met with good response across circles mainly from the rural
areas. During the quarter, the company integrated operations of the Bangladesh-
based Warid Telecom, which currently has a subscriber base of 3mn, while
integration of the recently acquired African assets of Zain Telecom is currently
underway.
Among the other segments, Telemedia Services de-grew by 0.9% yoy (0.5% qoq)
mainly on account of the drag in voice revenues. However Data and Broadband
Services (part of Telemedia Services) witnessed strong ramp up with the subscriber
base in the latter witnessing 21.1% yoy (4.6% qoq) growth in 4QFY2010 to 1.3mn.
Enterprise Services witnessed de-growth of 4.1% yoy (0.9% qoq growth). However,
Passive Infrastructure Services led the growth during the quarter by clocking 31.9%
yoy (3.1% qoq) growth led by the increase in the number of towers (11% yoy) and
higher tenancy ratio.
The company incurred consolidated capex of around Rs1,500cr in 4QFY2010, while
for FY2010 it incurred capex of Rs8,200cr. For FY2011E, the company has planned
capex of around Rs10,000cr (excluding Zain) to be incurred primarily towards 3G
spectrum and tower expansion.
April 30, 2010 2
3. Bharti Airtel I 4QFY2010 Result Update
Exhibit 2: Growth in Total MoUs
(Mn minutes )
200,000
180,000
160,000
140,000
120,000
100,000
80,000
60,000
40,000
20,000
0
1QFY08
2QFY08
3QFY08
4QFY08
1QFY09
2QFY09
3QFY09
4QFY09
1QFY10
2QFY10
3QFY10
4QFY10
Source: Company, Angel Research
Margins impacted by higher SG&A, Network operation costs
Bharti Airtel reported 272bp yoy (201 qoq) drop in EBIDTA Margins during
4QFY2010 mainly on account of the 380bp yoy (210bp qoq) increase in SG&A
expenses including the Rs98cr one-time expense incurred towards advisory and
professional fees for the acquisition of Warid Telecom and Zain Africa and the
market promotional activities for the new subscribers acquisition. Network operating
costs also increased by 250bp yoy (down 60bp qoq) due to the expansion in
operations overseas and new circles. Declining revenues per minutes have been
impacting the company’s overall Margins.
Depressed Margins erode Bottom-line
The company earned Net Interest of Rs184cr, up 3.9% qoq during 4QFY2010 as
against Net Interest Expense of Rs214cr in 4QFY2009. Other Income increased
7.5% yoy (105% qoq). However, depressed Margins, increase in Depreciation (up
19.9% yoy and 3.4% qoq) and higher effective Tax rate (up 591bp yoy and 162bp
qoq) dragged Bottom-line by 8.2% yoy (7% qoq). Profitability is further likely to be
impacted as the spread between Revenue and cost per minute has been diminishing
quarter after quarter and there is a likelihood of the price war extending in the high
value corporate segment.
Exhibit 3: Segment-wise Gross Revenue Break-Up
Particulars (Rs cr) 4QFY10 4QFY09 3QFY10 % chg % chg
yoy qoq
Mobile Services 8,198 8,222 7,962 (0.3) 3.0
Telemedia Services 851 859 855 (0.9) (0.5)
Enterprise Services 2,074 2,163 2,055 (4.1) 0.9
Others (Corporate Office) 209 95 141 121.6 48.1
Passive Infrastructure Services 955 724 927 31.9 3.1
Gross Revenues 12,287 12,062 11,940 1.9 2.9
Less: Eliminations 2,231 2,237 2,167 (0.3) 2.9
Net Revenues 10,056 9,825 9,772 2.4 2.9
Source: Company, Angel Research
April 30, 2010 3
5. Bharti Airtel I 4QFY2010 Result Update
Outlook and Valuation
Bharti Airtel plans to grow strategically both in the overseas and domestic markets.
The recent acquisitions of Warid and Zain demonstrate the company’s vision and
strategy regards its overseas foray. The company has integrated operations of Warid
Telecom, while that of Zain Africa, which ended CY2009E with Revenues of US
$3.6bn and EBIDTA of under US $1.2bn, is likely to get integrated by May 2010. In
the domestic market, the company plans to tap the less penetrated areas, viz. Value
Added Services, huge Broadband opportunity, focus on the data and non-voice
portion of services and grow its presence in the rural areas and small towns where
the current teledensity is still low at around 20%.
We believe that competitive intensity will ease as the smaller players (price
destroyers) are virtually not earning any revenues despite the strong subscriber
additions. The revenue per minute is likely to bottom out at around Rs0.40 and
would gradually start up-move once the new players burn out all their planned
investments (estimated to be US $10bn by FY2012). We believe that the future
business growth would be driven by strong traction in the total MoU propelled by
low tariffs and sustained subscriber additions. Also, the Zain acquisition post
integration would take the total business to an all together new scale and spread.
We expect Bharti Airtel to record 9.3% CAGR in Top-line over FY2010-12E, with
consistent addition in its Subscriber base (likely to reach 183mn by FY2012E) and
Revenue per minute decline of 25% from the current Rs0.53 to Rs0.4 by FY2012E.
Thus, Bottom-line is expected to clock lower CAGR of 1.9% over FY2010-12E. We
have not factored in Zain’s estimates pending its integration with the company. We
have valued the company at 14.5x FY2012E EPS of Rs 24.9 and 15% discount
(historical five-year premium of 12%) to our Sensex Target multiple of 17x in view of
the recent underperformance on the Sales and RoE fronts. We maintain a Buy on the
stock, with a revised Target Price of Rs360 (Rs406), implying an upside of 21%.
Exhibit 8: One year forward P/E Band
700
600 27x
500
22x
Share Price (Rs)
400 17x
300 12x
200
100
0
Oct-05
Oct-06
Oct-07
Oct-08
Oct-09
Apr-05
Jan-06
Apr-06
Jan-07
Apr-07
Jan-08
Apr-08
Jan-09
Apr-09
Jan-10
Apr-10
Jul-05
Jul-06
Jul-07
Jul-08
Jul-09
Source: Company, Angel Research
April 30, 2010 5
10. Bharti Airtel I 4QFY2010 Result Update
Research Team Tel: 022-4040 3800 E-mail: research@angeltrade.com Website: www.angeltrade.com
DISCLAIMER
This document is solely for the personal information of the recipient, and must not be singularly used as the basis of any investment decision. Nothing in this
document should be construed as investment or financial advice. Each recipient of this document should make such investigations as they deem necessary to
arrive at an independent evaluation of an investment in the securities of the companies referred to in this document (including the merits and risks involved),
and should consult their own advisors to determine the merits and risks of such an investment.
Angel Securities Limited, its affiliates, directors, its proprietary trading and investment businesses may, from time to time, make investment decisions that are
inconsistent with or contradictory to the recommendations expressed herein. The views contained in this document are those of the analyst, and the company
may or may not subscribe to all the views expressed within.
Reports based on technical and derivative analysis center on studying charts of a stock's price movement, outstanding positions and trading volume, as
opposed to focusing on a company's fundamentals and, as such, may not match with a report on a company's fundamentals.
The information in this document has been printed on the basis of publicly available information, internal data and other reliable sources believed to be true,
and are for general guidance only. Angel Securities Limited has not independently verified all the information contained within this document. Accordingly,
we cannot testify, nor make any representation or warranty, express or implied, to the accuracy, contents or data contained within this document. While
Angel Securities Limited endeavours to update on a reasonable basis the information discussed in this material, there may be regulatory, compliance, or
other reasons that prevent us from doing so.
This document is being supplied to you solely for your information, and its contents, information or data may not be reproduced, redistributed or passed on,
directly or indirectly.
Angel Securities Limited and its affiliates may seek to provide or have engaged in providing corporate finance, investment banking or other advisory services
in a merger or specific transaction to the companies referred to in this report, as on the date of this report or in the past.
Neither Angel Securities Limited nor its directors, employees and affiliates shall be liable for any loss or damage that may arise from or in connection with the
use of this information.
Note: Please refer to the important `Stock Holding Disclosure' report on the Angel website (Research Section).
Disclosure of Interest Statement Bharti Airtel
1. Analyst ownership of the stock No
2. Angel and its Group companies ownership of the stock Yes
3. Angel and its Group companies’ Directors ownership of the stock Yes
4. Broking relationship with company covered No
Note: We have not considered any Exposure below Rs 1 lakh for Angel and its Group companies.
Address: Acme Plaza, ‘A’ Wing, 3rd Floor, M.V. Road, Opp. Sangam Cinema, Andheri (E), Mumbai - 400 059.
Tel : (022) 3952 4568 / 4040 3800
Angel Broking Ltd: BSE Sebi Regn No : INB 010996539 / CDSL Regn No: IN - DP - CDSL - 234 - 2004 / PMS Regn Code: PM/INP000001546 Angel Securities Ltd:BSE: INB010994639/INF010994639 NSE:
INB230994635/INF230994635 Membership numbers: BSE 028/NSE:09946
Angel Capital & Debt Market Ltd: INB 231279838 / NSE FNO: INF 231279838 / NSE Member code -12798 Angel Commodities Broking (P) Ltd: MCX Member ID: 12685 / FMC Regn No: MCX / TCM /
CORP / 0037 NCDEX : Member ID 00220 / FMC Regn No: NCDEX / TCM / CORP / 0302
April 30, 2010 10