1. Market Outlook
India Research
June 2, 2010
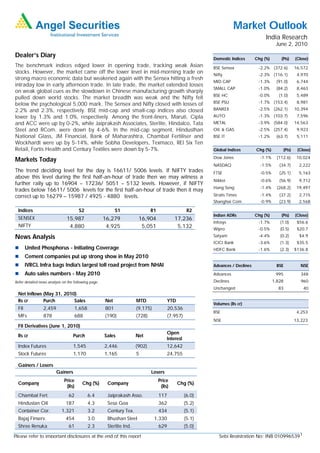
Dealer’s Diary Domestic Indices Chg (%) (Pts) (Close)
The benchmark indices edged lower in opening trade, tracking weak Asian BSE Sensex -2.2% (372.6) 16,572
stocks. However, the market came off the lower level in mid-morning trade on Nifty -2.3% (116.1) 4,970
strong macro economic data but weakened again with the Sensex hitting a fresh
MID CAP -1.3% (91.0) 6,744
intraday low in early afternoon trade. In late trade, the market extended losses
SMALL CAP -1.0% (84.2) 8,463
on weak global cues as the slowdown in Chinese manufacturing growth sharply
BSE HC -0.0% (1.0) 5,489
pulled down world stocks. The market breadth was weak and the Nifty fell
below the psychological 5,000 mark. The Sensex and Nifty closed with losses of BSE PSU -1.7% (153.4) 8,981
2.2% and 2.3%, respectively. BSE mid-cap and small-cap indices also closed BANKEX -2.5% (262.1) 10,394
lower by 1.3% and 1.0%, respectively. Among the front-liners, Maruti, Cipla AUTO -1.3% (103.7) 7,596
and ACC were up by 0-2%, while Jaiprakash Associates, Sterlite, Hindalco, Tata METAL -3.9% (584.0) 14,563
Steel and RCom. were down by 4-6%. In the mid-cap segment, Hindusthan OIL & GAS -2.5% (257.4) 9,923
National Glass, JM Financial, Bank of Maharashtra, Chambal Fertiliser and BSE IT -1.2% (63.7) 5,111
Wockhardt were up by 5-14%, while Sobha Developers, Texmaco, REI Six Ten
Retail, Fortis Health and Century Textiles were down by 5-7%. Global Indices Chg (%) (Pts) (Close)
Dow Jones -1.1% (112.6) 10,024
Markets Today
NASDAQ -1.5% (34.7) 2,222
The trend deciding level for the day is 16611/ 5006 levels. If NIFTY trades FTSE -0.5% (25.1) 5,163
above this level during the first half-an-hour of trade then we may witness a
Nikkei -0.6% (56.9) 9,712
further rally up to 16904 – 17236/ 5051 – 5132 levels. However, if NIFTY
Hang Seng -1.4% (268.2) 19,497
trades below 16611/ 5006 levels for the first half-an-hour of trade then it may
correct up to 16279 – 15987 / 4925 - 4880 levels. Straits Times -1.4% (37.2) 2,715
Shanghai Com -0.9% (23.9) 2,568
Indices S2 S1 R1 R2
Indian ADRs Chg (%) (Pts) (Close)
SENSEX 15,987 16,279 16,904 17,236
Infosys -1.7% (1.0) $56.6
NIFTY 4,880 4,925 5,051 5,132 Wipro -0.5% (0.5) $20.7
News Analysis Satyam -4.4% (0.2) $4.9
ICICI Bank -3.6% (1.3) $35.5
United Phosphorus - Initiating Coverage HDFC Bank -1.6% (2.3) $136.8
Cement companies put up strong show in May 2010
IVRCL Infra bags India's largest toll road project from NHAI Advances / Declines BSE NSE
Auto sales numbers - May 2010 Advances 995 348
Refer detailed news analysis on the following page. Declines 1,828 960
Unchanged 83 40
Net Inflows (May 31, 2010)
Rs cr Purch Sales Net MTD YTD
Volumes (Rs cr)
FII 2,459 1,658 801 (9,175) 20,536
BSE 4,253
MFs 878 688 (190) (728) (7,957)
NSE 13,223
FII Derivatives (June 1, 2010)
Open
Rs cr Purch Sales Net
Interest
Index Futures 1,545 2,446 (902) 12,642
Stock Futures 1,170 1,165 5 24,755
Gainers / Losers
Gainers Losers
Price Price
Company Chg (%) Company Chg (%)
(Rs) (Rs)
Chambal Fert. 62 6.4 Jaiprakash Asso. 117 (6.0)
Hindustan Oil 187 4.3 Sesa Goa 362 (5.2)
Container Cor. 1,321 3.2 Century Tex. 434 (5.1)
Bajaj Finserv. 454 3.0 Bhushan Steel 1,330 (5.1)
Shree Renuka 61 2.3 Sterlite Ind. 629 (5.0)
Please refer to important disclosures at the end of this report Sebi Registration No: INB 0109965391
2. Market Outlook | India Research
United Phosphorus - Initiating Coverage
United Phosphorus (UPL) ranks among the Top-5 generic agrichemical manufacturers in
the world. The US $40bn (CY2008) global agrichemical industry is dominated by Top-6
innovators, with a large share of patented (28%) and off-patent market (32%), with global
generic players accounting for the balance 40%. Additionally, with patents for products
worth US $3bn-4bn expiring during 2009-14, global generic players are likely to benefit
further. We expect UPL to post CAGRs of 9% and 17% in sales and PAT over FY2010-12E,
respectively. At the current valuation of 10.1x FY2012E EPS , the stock is attractively valued
as compared to its global (10.4x) and domestic peers (12.0x) and historic average (15.0x).
We Initiate Coverage on the stock, with a Buy rating and a Target Price of Rs226, valuing
the stock at 13x FY2012E EPS.
Global Generic Play: With innovators controlling US $13bn of the total off-patent market
worth US $29bn, we believe there is vast opportunity for generic players to increase their
market share. Moreover, with patents for products worth US $3bn-4bn expiring over 2009-
14, there exists ample growth opportunity for generic players. The industry also has high
entry barriers by way of investments, evident from the fact that 84% of the market is
controlled by the Top-11 players; while in the generic space, 61% is controlled by the Top-
5 players, including UPL. Amidst this scenario, we believe UPL, an integrated global
generic player, is well placed to capitalise on the upcoming opportunity.
Improving Profitability + Attractive Valuation = Good Value Buy: Over FY2010-12E, we
expect UPL to post CAGRs of 9% and 17% in sales and PAT, respectively. UPL's profitability
is set to improve with EBITDA margins improving on account of stable raw material prices,
pick-up in demand and restructuring of Cerexagri. We expect RoCE and RoE to improve
from 15% and 19% in FY2010 to 19% and 20% in FY2012E, respectively. At the current
valuation of 10.5x FY2012E EPS, the stock is attractively valued as compared to its global
(10.4x) and domestic peers (12.0x) and historic average (15.0x).
Cement companies put up strong show in May 2010
Cement dispatches during May 2010 signaled healthy demand from the real estate and
infrastructure sectors. Aditya Birla Group’s cement shipments in May 2010 rose 5.6% on a
yoy basis to 3.35mn tonnes, aided by capacity additions. However, the company’s sales
volume remained flat on an mom basis. Ambuja Cement, dispatched 12.5% more in May
2010 at 1.8mn tonnes against 1.6mn tonnes in May 2009. However, the company’s sales
volume declined by 5.3% on an mom basis. Jaiprakash Associates posted a 63% yoy jump
in sales in May 2010 to 1.3mn tonnes, aided by substantial capacity addition. JK Lakshmi
Cement reported a 12.5% yoy increase in sales at 0.36mn tonnes for May 2010 against
0.32mn tonnes in May 2009. On an mom basis, its sales volume grew by 5.9%.
IVRCL Infra bags India's largest toll road project from NHAI
IVRCL Group has bagged India’s largest toll road project of nearly Rs3,100cr from
National Highway Authority of India (NHAI). The length of the project is 122km and the
work scope includes 4/6 laning of H-17 section between Maharashtra-Goa Border to
Panaji-Goa-Karnataka Border. The project has a concession period of 23 years, with a
positive grant of Rs665cr. The highway project constitutes six-laning and four-laning works
to be carried out and building of several major structures, including a new and iconic six-
laned cable stayed bridge over river Zuari, spanning across 900mt comprising main span
of 500mt supported on 130mt high pylons and adjacent span of 200mt on either side and
approach via-duct on either side, totaling to overall length of 1,500mt. Highway-related
work of the project is scheduled for completion in 36 months, and Zuari bridge-related
work is scheduled to be completed in 48 months. Toll will start after the completion of the
highway. Currently, IVRCL Group has 11 projects in its BOT portfolio, of which three are
operational, two have been completed and awaiting COD and six are in various stages of
development and construction, totaling nearly Rs11,150cr of project value. We maintain a
Buy view on the stock.
June 2, 2010 2
3. Market Outlook | India Research
Auto sales numbers - May 2010
Maruti Suzuki
For the first time, car market leader Maruti Suzuki India Limited sold over one lakh units in
a month. The company’s total sales stood at 102,175 units in May 2010, up 27.9% yoy.
This included 12,134 units of exports, up 33.5% yoy. The previous highest number in total
monthly sales was 96,650 units, achieved in February 2010. In May 2010, the company
sold 90,041 units in the domestic market, up 27.2% yoy—the highest ever domestic sales
in a month. The previous highest monthly domestic sales were reported at 84,765 units, in
February 2010. The company registered the highest-ever domestic sales in the A2, A3 and
C segments, up 16.6%, 60.5% and 70% yoy, respectively.
Mahindra & Mahindra (M&M)
M&M reported healthy 50.6% yoy growth in total sales to 45,744 units (30,366 units) in
May 2010, aided by 68.9% yoy growth in auto volumes and 27.8% yoy growth in tractor
sales. The utility vehicle segment recorded strong growth of 50% yoy in May 2010 to
18,940 units (12,620 units). Three-wheelers, including the newly launched GIO and
Maximmo, posted robust 146% yoy growth in volumes to 6,641 units (2,703 units) in
4QFY2010.
Tata Motors
Tata Motors’ total sales (including exports) of its commercial and passenger vehicles in
May 2010 stood at 56,779 vehicles, reporting growth of 41% yoy. Domestic sales of Tata
commercial and passenger vehicles for May 2010 were reported at 52,801 units,
increasing 38% yoy. Sales of commercial vehicles in May 2010 in the domestic market
were at 31,475 units, growing 37% yoy. LCV sales increased 22% yoy to 17,615 units.
M&HCV sales stood at 13,860 units, increasing 61% yoy. The passenger vehicles business
reported total sales and distribution off-take of 23,489 units (21,326 Tata + 2,163 Fiat) in
the domestic market in May 2010, a 42% increase compared to 16,563 units (15,388
Tata + 1,175 Fiat) in May 2009. Sales of Tata passenger vehicles were at 21,326 units,
growing 39%yoy. Sales of Tata Nano were reported at 3,550 units. Sales from the Indica
range were at 8,468 units, lower by 15% yoy. The Indigo range recorded sales of 6,600
units, growing of 133% yoy. The Sumo/Safari range accounted for sales of 2,708 units,
higher by 6% yoy.
Two-wheelers
Hero Honda reported a 13.9% yoy increase in volumes in May 2010 to 4,35,933 units
(3,82,678 units), the highest-ever monthly sales in the history of the company, aided by
healthy growth in the motorcycle segment and significant (growth of 65% in the scooter
segment (Pleasure has reported sales of over 24,000 in May 2010).
Bajaj Auto posted substantial growth of 60.7% yoy in May 2010 to 299,442 units
(185,341 units), aided by 63.3% yoy growth in the motorcycle segment and 52.5% yoy
growth in the three-wheeler segment.
TVS Motor posted significant growth in May 2010 on low base of last year and on the
success of its new launches. Total two-wheeler sales for the company grew 30% yoy in May
2010 to 154,667 units (118,574 units). Domestic sales (two-wheeler) registered 27%
growth yoy, increasing 136,621 units (107,439 units), in May 2010. Motorcycle sales grew
by 27% yoy in May 2010, with sales of 67,906 units (53,495 units). Sales of scooters
continued their spectacular run, growing by 42% to 31,884 units in the May 2010 from
22,486 units in May 2009. Maintaining its upward growth trend, the company's three-
wheeler business registered sales of 2,313 units in May 2010 as compared to 707 units in
May 2009. Exports posted sizeable growth of 62% yoy in May 2010, with two-wheeler
sales reported at 18,046 units (11,135 units).
June 2, 2010 3
4. Market Outlook | India Research
Economic and Political News
Govt. hikes price of natural gas by more than double to US $4.20 per mmBtu
Govt. gets Rs67,719cr for 3G spectrum from 9 telcos
India's exports rose by over 36% in April 2010
Corporate News
ITC raises stake in Leela to 10%
R-Infra wins Rs2,960cr Delhi-Agra project from NHAI
Hero Honda raises bike prices by up to Rs1,000
SAIL cuts prices by up to Rs1,500/t
Source: Economic Times, Business Standard, Business Line, Financial Express, Mint
June 2, 2010 4
5. Market Outlook | India Research
Research Team Tel: 022-4040 3800 E-mail: research@angeltrade.com Website: www.angeltrade.com
DISCLAIMER
This document is solely for the personal information of the recipient, and must not be singularly used as the basis of any investment decision. Nothing in
this document should be construed as investment or financial advice. Each recipient of this document should make such investigations as they deem
necessary to arrive at an independent evaluation of an investment in the securities of the companies referred to in this document (including the merits and
risks involved), and should consult their own advisors to determine the merits and risks of such an investment.
Angel Securities Limited, its affiliates, directors, its proprietary trading and investment businesses may, from time to time, make investment decisions that
are inconsistent with or contradictory to the recommendations expressed herein. The views contained in this document are those of the analyst, and the
company may or may not subscribe to all the views expressed within.
Reports based on technical and derivative analysis center on studying charts of a stock's price movement, outstanding positions and trading volume, as
opposed to focusing on a company's fundamentals and, as such, may not match with a report on a company's fundamentals.
The information in this document has been printed on the basis of publicly available information, internal data and other reliable sources believed to be
true, and is for general guidance only. Angel Securities Limited has not independently verified all the information contained within this document.
Accordingly, we cannot testify, nor make any representation or warranty, express or implied, to the accuracy, contents or data contained within this
document. While Angel Securities Limited endeavours to update on a reasonable basis the information discussed in this material, there may be
regulatory, compliance, or other reasons that prevent us from doing so.
This document is being supplied to you solely for your information, and its contents, information or data may not be reproduced, redistributed or passed
on, directly or indirectly.
Angel Securities Limited and its affiliates may seek to provide or have engaged in providing corporate finance, investment banking or other advisory
services in a merger or specific transaction to the companies referred to in this report, as on the date of this report or in the past.
Neither Angel Securities Limited, nor its directors, employees or affiliates shall be liable for any loss or damage that may arise from or in connection with
the use of this information.
Note: Please refer to the important `Stock Holding Disclosure' report on the Angel website (Research Section).
Address: Acme Plaza, ‘A’ Wing, 3rd Floor, M.V. Road, Opp. Sangam Cinema, Andheri (E), Mumbai - 400 059.
Tel : (022) 3952 4568 / 4040 3800
Angel Broking Ltd: BSE Sebi Regn No : INB 010996539 / CDSL Regn No: IN - DP - CDSL - 234 - 2004 / PMS Regn Code: PM/INP000001546 Angel Securities Ltd:BSE: INB010994639/INF010994639 NSE:
INB230994635/INF230994635 Membership numbers: BSE 028/NSE:09946
Angel Capital & Debt Market Ltd: INB 231279838 / NSE FNO: INF 231279838 / NSE Member code -12798 Angel Commodities Broking (P) Ltd: MCX Member ID: 12685 / FMC Regn No: MCX / TCM /
CORP / 0037 NCDEX : Member ID 00220 / FMC Regn No: NCDEX / TCM / CORP / 0302
June 2, 2010 5