1. 4QFY2010 Result Update I FMCG
May 22, 2010
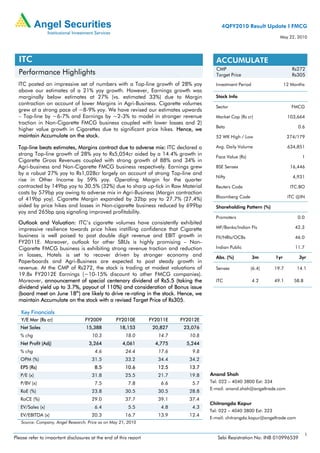
ITC ACCUMULATE
CMP Rs272
Performance Highlights Target Price Rs305
ITC posted an impressive set of numbers with a Top-line growth of 28% yoy Investment Period 12 Months
above our estimates of a 21% yoy growth. However, Earnings growth was
marginally below estimates at 27% (vs. estimated 33%) due to Margin Stock Info
contraction on account of lower Margins in Agri-Business. Cigarette volumes
Sector FMCG
grew at a strong pace of ~8-9% yoy. We have revised our estimates upwards
– Top-line by ~6-7% and Earnings by ~2-3% to model in stronger revenue Market Cap (Rs cr) 103,664
traction in Non-Cigarette FMCG business coupled with lower losses and 2)
Beta 0.6
higher value growth in Cigarettes due to significant price hikes. Hence, we
maintain Accumulate on the stock. 52 WK High / Low 274/179
Top-line beats estimates, Margins contract due to adverse mix: ITC declared a Avg. Daily Volume 634,851
strong Top-line growth of 28% yoy to Rs5,054cr aided by a 14.4% growth in
Face Value (Rs) 1
Cigarette Gross Revenues coupled with strong growth of 88% and 34% in
Agri-business and Non-Cigarette FMCG business respectively. Earnings grew BSE Sensex 16,446
by a robust 27% yoy to Rs1,028cr largely on account of strong Top-line and
Nifty 4,931
rise in Other Income by 59% yoy. Operating Margin for the quarter
contracted by 149bp yoy to 30.5% (32%) due to sharp up-tick in Raw Material Reuters Code ITC.BO
costs by 579bp yoy owing to adverse mix in Agri-Business (Margin contraction
Bloomberg Code ITC @IN
of 419bp yoy). Cigarette Margin expanded by 32bp yoy to 27.7% (27.4%)
aided by price hikes and losses in Non-cigarette business reduced by 699bp Shareholding Pattern (%)
yoy and 265bp qoq signaling improved profitability.
Promoters 0.0
Outlook and Valuation: ITC’s cigarette volumes have consistently exhibited
impressive resilience towards price hikes instilling confidence that Cigarette MF/Banks/Indian FIs 42.3
business is well poised to post double digit revenue and EBIT growth in FII/NRIs/OCBs 46.0
FY2011E. Moreover, outlook for other SBUs is highly promising – Non-
Cigarette FMCG business is exhibiting strong revenue traction and reduction Indian Public 11.7
in losses, Hotels is set to recover driven by stronger economy and Abs. (%) 3m 1yr 3yr
Paperboards and Agri-Business are expected to post steady growth in
revenue. At the CMP of Rs272, the stock is trading at modest valuations of Sensex (6.4) 19.7 14.1
19.8x FY2012E Earnings (~10-15% discount to other FMCG companies).
Moreover, announcement of special centenary dividend of Rs5.5 (taking the ITC 4.2 49.1 58.8
dividend yield up to 3.7%, payout of 110%) and consideration of Bonus issue
(board meet on June 18th) are likely to drive re-rating in the stock. Hence, we
maintain Accumulate on the stock with a revised Target Price of Rs305.
Key Financials
Y/E Mar (Rs cr) FY2009 FY2010E FY2011E FY2012E
Net Sales 15,388 18,153 20,827 23,076
% chg 10.3 18.0 14.7 10.8
Net Profit (Adj) 3,264 4,061 4,775 5,244
% chg 4.6 24.4 17.6 9.8
OPM (%) 31.5 33.2 34.4 34.2
EPS (Rs) 8.5 10.6 12.5 13.7
P/E (x) 31.8 25.5 21.7 19.8 Anand Shah
P/BV (x) 7.5 7.8 6.6 5.7 Tel: 022 – 4040 3800 Ext: 334
E-mail: anand.shah@angeltrade.com
RoE (%) 23.8 30.5 30.5 28.8
RoCE (%) 29.0 37.7 39.1 37.4
Chitrangda Kapur
EV/Sales (x) 6.4 5.5 4.8 4.3
Tel: 022 – 4040 3800 Ext: 323
EV/EBITDA (x) 20.3 16.7 13.9 12.4
E-mail: chitrangda.kapur@angeltrade.com
Source: Company, Angel Research; Price as on May 21, 2010
1
Please refer to important disclosures at the end of this report Sebi Registration No: INB 010996539
2. ITC I 4QFY2010 Result Update
Exhibit 1: Financial Performance Update
Y/E March (Rs cr) 4QFY10 4QFY09 % chg FY2010 FY2009 % chg
Net Sales 5,053.8 3,950.3 27.9 18,153.2 15,611.9 16.3
Consumption of RM 2,178.5 1,474.2 47.8 6,971.4 5,957.9 17.0
(% of Sales) 43.1 37.3 38.4 38.2
Staff Cost 255.8 222.2 15.2 1,002.8 890.9 12.6
(% of Sales) 5.1 5.6 5.5 5.7
Other Expenses 1,079.3 991.2 8.9 4,105.0 3,904.6 5.1
(% of Sales) 21.4 25.1 22.6 25.0
Total Expenditure 3,513.7 2,687.6 30.7 12,079.2 10,753.4 12.3
Operating Profit 1,540.1 1,262.7 22.0 6,074.0 4,858.5 25.0
OPM (%) 30.5 32.0 33.5 31.1
Interest 18.5 13.7 35.3 53.4 18.3 191.3
Depreciation 153.9 145.1 6.0 608.7 549.4 10.8
Other Income 137.0 87.9 56.0 603.4 534.9 12.8
PBT (excl Ext) 1,504.8 1,191.8 26.3 6,015.3 4,825.7 24.7
Extr Income/(Exp) - - - -
PBT (incl Ext) 1,504.8 1,191.8 26.3 6,015.3 4,825.7 24.7
(% of Sales) 29.8 30.2 33.1 30.9
Prov. for Taxation 476.6 382.8 24.5 1,954.3 1,562.2 25.1
(% of PBT) 31.7 32.1 32.5 32.4
Reported PAT 1,028.2 809.0 27.1 4,061.0 3,263.6 24.4
PATM (%) 20.3 20.5 22.4 20.9
Equity Shares (cr) 381.8 377.4 381.8 377.4
Adjusted EPS (Rs) 2.7 2.1 25.6 10.6 8.6 23.0
Source: Company, Angel Research
Top-line beats estimates, Non-cigarette FMCG and Agri-Business aid growth
ITC declared a strong Top-line growth of 28% yoy to Rs5,054cr (Rs3,950cr), ahead
of our estimates of a 21% growth to Rs4,708cr. The Cigarette Division, for the
quarter, registered 14.4% growth in Gross Revenues (18.5% yoy growth in Net
Revenues) on the back of better realisation (price hikes) and improved product mix
(up-trading to filter cigarettes). In terms of volumes, we expect ITC registered a
~8-9% volume growth for the quarter, ahead of our expectations. Amongst other
segments, Agri-Business and Non-cigarette FMCG business posted strong growth of
88% and 34% respectively while Hotels and Paperboards registered a modest growth
to 14% and 12% yoy respectively.
Earnings miss estimates, Margin contraction in Agri-Business to blame
Earnings for the quarter grew by a robust 27% yoy to Rs1,028cr (Rs809cr)
marginally below our expectation of a 33% yoy growth to Rs1,077cr, despite strong
Top-line and higher Other Income (up 56% yoy), largely on account of Margin
contraction in Agri-business (419bp yoy). Hence, Operating Margin for the quarter
contracted by 149bp yoy to 30.5% (32%) due to sharp up-tick in Raw Material costs
by 579bp yoy. However, lower staff costs (down 56bp yoy) and significant savings in
Other expenditure (down 374bp yoy, largely due to reduction of losses in
Non-cigarette FMCG) arrested further Margin contraction.
In terms of segmental performance, Cigarette Margin expanded by 32bp yoy to
27.7% (27.4%) aided by price hikes and losses in Non-cigarette business reduced by
699bp yoy and 265bp qoq signaling improved profitability. However, Hotels and
Paperboard business registered a contraction in Margin by 95bp and 14bp yoy
respectively.
May 22, 2010 2
3. ITC I 4QFY2010 Result Update
Segment-wise Performance
Exhibit 2: Segment-wise Performance
Y/E March (Rs cr) 4QFY10 4QFY09 % chg FY2010 FY2009 % chg
Cigarettes 4,516.8 3,949.3 14.4 17,283.0 15,115.1 14.3
Others 1,125.3 838.8 34.1 3,641.7 3,014.0 20.8
Hotels 274.3 241.3 13.6 910.8 1,020.3 (10.7)
Agri Business 988.1 525.9 87.9 3,862.1 3,846.0 0.4
Paperboards & Packg. 836.0 747.0 11.9 3,233.6 2,822.0 14.6
Less: Inter-Seg. Rev. 581.7 431.7 34.8 2,671.7 2,673.8 (0.1)
Total Gross Income 7,158.7 5,870.7 21.9 26,259.6 23,143.5 13.5
Cigarettes 1,251.2 1,081.4 15.7 4,938.1 4,183.8 18.0
Others (78.7) (117.3) (349.5) (483.5)
Hotels 78.2 71.1 10.0 216.6 316.2 (31.5)
Agri Business 58.3 53.1 9.9 436.4 256.2 70.3
Paperboards & Packg. 168.8 151.9 11.1 684.3 508.6 34.5
Total PBIT 1,477.9 1,240.1 19.2 5,925.9 4,781.3 23.9
Less: Interest Exp 18.5 13.7 53.4 18.3
Less: Other Exp (45.4) 34.7 (142.8) (62.8)
PBT 1,504.8 1,191.8 26.3 6,015.3 4,825.7 24.7
PBIT Margin (%)
Cigarettes 27.7 27.4 28.6 27.7
Others (7.0) (14.0) (9.6) (16.0)
Hotels 28.5 29.5 23.8 31.0
Agri Business 5.9 10.1 11.3 6.7
Paperboards & Packg. 20.2 20.3 21.2 18.0
Source: Company, Angel Research
Cigarette Business – Steady volume growth continues
ITC’s Cigarette Division, for the quarter, registered 14.4% growth in Gross Revenues
(18.5% yoy growth in Net Revenues) on the back of robust volume growth and better
realisation (price hikes). In terms of volumes, we expect ITC registered a ~8-9%
volume growth for the quarter, ahead of our expectations. On the Margin front, ITC
registered a 32bp expansion in PBIT Margins on a Gross level (123bp contraction on
Net level) in its Cigarette Division to 27.7% partially impacted by higher one-time
packaging costs (to pass on revised prices).
ITC’s cigarette volumes have consistently exhibited impressive resilience towards
price hikes instilling confidence that FY2011 will be no exception. Hence, we have
modeled in a 2% volume growth in Cigarette volumes for FY2011, despite ~13%
weighted average price hike which is likely to fully offset – 1) ~15% excise hike in
Budget and 2) Rise in VAT announced in several states. We believe the Cigarette
business is well poised to post double digit revenue and EBIT growth in FY2011E.
However, we will keenly monitor the volume growth in 1QFY2011E to ascertain full
impact of recent price hikes on volumes (hikes affected post budget only in March).
Non-Cigarette FMCG business – Strong Revenue traction
ITC’s Non-Cigarette FMCG business registered a strong uptick in revenue growth to
34% yoy to Rs1,125cr (Rs834cr) driven by impressive performance from its Branded
packaged foods business and Stationery business. Moreover, losses continued to
witness moderation dropping to Rs79cr (Rs117cr) yoy due to softening of input costs
and increased focus on profitability. Going ahead we expect, revenue traction in the
segment to continue and losses to reduce significantly, though break-even is likely to
be achieved only in FY2013. We expect ITC to enter a new category (Skin care) in
FY2011.
May 22, 2010 3
4. ITC I 4QFY2010 Result Update
Hotel Business – On the road to recovery
ITC’s Hotel business registered modest growth during the quarter of 14.4% yoy to
Rs274cr (Rs241cr). However, EBIT Margins contracted by 95bp yoy to 28.5%
resulting into a muted growth in EBIT by 10% largely attributed to Bangalore
property launch. Construction activity of the new super luxury properties at Chennai
and Kolkata are progressing satisfactorily. In addition, several new projects including
joint ventures and management contracts are on the anvil to rapidly scale up the
business across all the four market segments. We believe the Hotel’s business is well
on track to post a 21% CAGR in revenues during FY2010-12E aided by low base
and up-tick in economic activity. Moreover, Margins should improve as ARRs
recover.
Paperboard and Packaging – Modest growth
The segment registered a modest growth in Revenue of 12% yoy (12.5% on a Net
level) to Rs836cr (Rs747cr). However, EBIT Margins of the segment registered a dip
of 14bp yoy to 20.2%. Going forward, we expect the segment to post a modest 13%
CAGR in revenues during FY2010-12E driven by commencement of new units and
Margins to stabilize at current levels aided largely by better product mix.
Agri Business – Strong Revenue growth, Margins dip due to adverse mix
ITC’s Agri Business registered a strong 88% yoy growth in revenues to Rs988cr
(Rs526cr), partially aided by low base, driven by the continuing strong performance
of the leaf tobacco portfolio. The business maintained its position as the foremost
exporter of leaf tobacco, leveraging the growing demand for Indian tobaccos.
However, EBIT Margins contracted 419bp yoy to 5.1% resulting into a muted 10%
yoy growth in segmental EBIT largely due to adverse product mix (higher volumes of
soya in the quarter). Going ahead, we expect this segment to 8% CAGR in revenues
over FY2010-12E and Margins to remain stable at 10% levels owing to
Management’s focus to shift to higher profitability products and firm leaf tobacco
prices.
May 22, 2010 4
5. ITC I 4QFY2010 Result Update
Outlook and Valuation
Post strong Top-line growth in 4QFY2010, we have revised our Top-line estimates
upwards by 6-7% modeling in – 1) higher value growth in Cigarette business due to
recent round of price hikes and 2) higher revenues from Non-Cigarette FMCG
business (We expect ITC to enter new categories like Skin Care in FY2011).
However, at the operating front, we have revised our Margin estimates downwards,
despite higher Margins in cigarettes and Hotels, to model in deterioration in revenue
mix (higher contribution from low Margin Agri-business) and pressure in
Paperboards business (due to rise in input costs). Nonetheless, our Earnings
estimates have been revised upwards by ~2-3%, despite modeling in lower Other
Income (due to significant outflow of cash on account of special centenary dividend),
largely due to higher Top-line.
Exhibit 3: Revision in Estimates
Old Estimate New Estimate % chg
(Rs cr) FY11E FY12E FY11E FY12E FY11E FY12E
Revenue 19,671 21,673 20,827 23,076 5.9 6.5
OPM (%) 34.7 34.8 34.4 34.2 (23bp) (55bp)
EPS 12.1 13.4 12.5 13.7 3.2 2.8
Source: Angel Research
ITC’s cigarette volumes have consistently exhibited impressive resilience towards
price hikes instilling confidence that FY2011 will be no exception. Hence, we have
modeled in a 2% volume growth in Cigarette volumes for FY2011, despite ~13%
weighted average price hike which is likely to fully offset – 1) ~15% excise hike in
Budget and 2) Rise in VAT announced in several states. We believe the Cigarette
business is well poised to post double digit revenue and EBIT growth in FY2011E.
Moreover, outlook for other SBUs is highly promising – Non-Cigarette FMCG
business is exhibiting strong revenue traction and reduction in losses, Hotels is
expected to recover driven by improving economic environment and Paperboards
and Agri-Business are expected to post modest growth in revenue (though EBIT
growth might be under pressure).
At the CMP of Rs272, the stock is trading at modest valuations of 19.8x FY2012E
Earnings (~10-15% discount to other FMCG companies). Moreover, announcement
of special centenary dividend of Rs5.5 (taking the dividend yield up to 3.7%, payout
of 110%) and consideration of Bonus issue (board meet on June 18th) are likely to
drive re-rating in the stock. Hence, we maintain Accumulate on the stock with a
revised Target Price of Rs305. Key downside risks to our estimates include – 1)
Negative volume growth in Cigarettes, 2) Margin deterioration in Paperboards or
Agri-Business and 3) Slower-than-anticipated improvement in Hotels Business.
Exhibit 4: 1-year forward P/E band
350 14x 18x 22x 26x
300
250
Share Price (Rs)
200
150
100
50
-
Dec-05
Dec-06
Dec-07
Dec-08
Dec-09
Apr-05
Apr-06
Apr-07
Apr-08
Apr-09
Apr-10
Oct-05
Oct-06
Oct-07
Oct-08
Oct-09
Aug-05
Feb-06
Aug-06
Feb-07
Aug-07
Feb-08
Aug-08
Feb-09
Aug-09
Feb-10
Jun-05
Jun-06
Jun-07
Jun-08
Jun-09
Source: Bloomberg, Angel Research; Note: Red-line indicates 5-year average
May 22, 2010 5
10. ITC I 4QFY2010 Result Update
Research Team Tel: 4040 3800 E-mail: research@angeltrade.com Website: www.angeltrade.com
DISCLAIMER
This document is solely for the personal information of the recipient, and must not be singularly used as the basis of any investment decision. Nothing in this
document should be construed as investment or financial advice. Each recipient of this document should make such investigations as they deem necessary to
arrive at an independent evaluation of an investment in the securities of the companies referred to in this document (including the merits and risks involved),
and should consult their own advisors to determine the merits and risks of such an investment.
Angel Securities Limited, its affiliates, directors, its proprietary trading and investment businesses may, from time to time, make investment decisions that are
inconsistent with or contradictory to the recommendations expressed herein. The views contained in this document are those of the analyst, and the company
may or may not subscribe to all the views expressed within.
Reports based on technical and derivative analysis center on studying charts of a stock's price movement, outstanding positions and trading volume, as
opposed to focusing on a company's fundamentals and, as such, may not match with a report on a company's fundamentals.
The information in this document has been printed on the basis of publicly available information, internal data and other reliable source believed to be true,
and is for general guidance only. Angel Securities Limited has not independently verified all the information contained within this document. Accordingly, we
cannot testify, nor make any representation or warranty, express or implied, to the accuracy, contents or data contained within this document. While Angel
Securities Limited endeavours to update on a reasonable basis the information discussed in this material, there may be regulatory, compliance, or other
reasons that prevent us from doing so.
This document is being supplied to you solely for your information, and its contents, information or data may not be reproduced, redistributed or passed on,
directly or indirectly.
Angel Securities Limited and its affiliates may seek to provide or have engaged in providing corporate finance, investment banking or other advisory services
in a merger or specific transaction to the companies referred to in this report, as on the date of this report or in the past.
Neither Angel Securities Limited, nor its directors, employees or affiliates shall be liable for any loss or damage that may arise from or in connection with the
use of this information.
Note: Please refer to the important `Stock Holding Disclosure' report on the Angel website (Research Section).
Disclosure of Interest Statement ITC
1. Analyst ownership of the stock No
2. Angel and its Group companies ownership of the stock No
3. Angel and its Group companies’ Directors ownership of the stock No
4. Broking relationship with company covered No
Note: We have not considered any Exposure below Rs 1 lakh for Angel and its Group companies.
Address: Acme Plaza, ‘A’ Wing, 3rd Floor, M.V. Road, Opp. Sangam Cinema, Andheri (E), Mumbai - 400 059.
Tel : (022) 3952 4568 / 4040 3800
Angel Broking Ltd: BSE Sebi Regn No : INB 010996539 / CDSL Regn No: IN - DP - CDSL - 234 - 2004 / PMS Regn Code: PM/INP000001546 Angel Securities Ltd:BSE: INB010994639/INF010994639 NSE:
INB230994635/INF230994635 Membership numbers: BSE 028/NSE:09946
Angel Capital & Debt Market Ltd: INB 231279838 / NSE FNO: INF 231279838 / NSE Member code -12798 Angel Commodities Broking (P) Ltd: MCX Member ID: 12685 / FMC Regn No: MCX / TCM /
CORP / 0037 NCDEX : Member ID 00220 / FMC Regn No: NCDEX / TCM / CORP / 0302
May 22, 2010 10