VIP Call Girls LB Nagar ( Hyderabad ) Phone 8250192130 | ₹5k To 25k With Room...
GSKCH
1. 2QCY2010 Result Update | FMCG
August 2, 2010
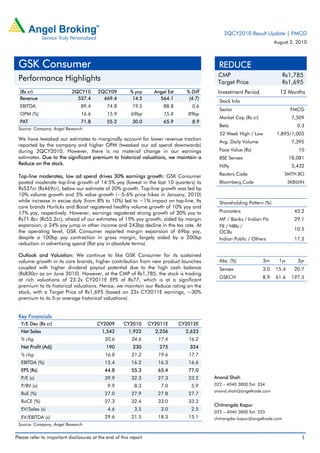
GSK Consumer REDUCE
CMP Rs1,785
Performance Highlights Target Price Rs1,695
(Rs cr) 2QCY10 2QCY09 % yoy Angel Est % Diff Investment Period 12 Months
Revenue 537.4 469.4 14.5 564.1 (4.7)
Stock Info
EBITDA 89.4 74.8 19.5 88.8 0.6
Sector FMCG
OPM (%) 16.6 15.9 69bp 15.8 89bp
Market Cap (Rs cr) 7,509
PAT 71.8 55.2 30.0 65.9 8.9
Beta 0.3
Source: Company, Angel Research
52 Week High / Low 1,895/1,005
We have tweaked our estimates to marginally account for lower revenue traction
Avg. Daily Volume 7,395
reported by the company and higher OPM (tweaked our ad spend downwards)
during 2QCY2010. However, there is no material change in our earnings Face Value (Rs) 10
estimates. Due to the significant premium to historical valuations, we maintain a BSE Sensex 18,081
Reduce on the stock. Nifty 5,432
Top-line moderates, low ad spend drives 30% earnings growth: GSK Consumer Reuters Code SMTH.BO
posted moderate top-line growth of 14.5% yoy (lowest in the last 10 quarters) to Bloomberg Code SKB@IN
Rs537cr (Rs469cr), below our estimate of 20% growth. Top-line growth was led by
10% volume growth and 5% value growth (~5-6% price hikes in January, 2010)
while increase in excise duty (from 8% to 10%) led to ~1% impact on top-line. Its Shareholding Pattern (%)
core brands Horlicks and Boost registered healthy volume growth of 10% yoy and
17% yoy, respectively. However, earnings registered strong growth of 30% yoy to Promoters 43.2
Rs71.8cr (Rs55.2cr), ahead of our estimates of 19% yoy growth, aided by margin MF / Banks / Indian Fls 29.1
expansion, a 24% yoy jump in other income and 243bp decline in the tax rate. At FII / NRIs /
the operating level, GSK Consumer reported margin expansion of 69bp yoy, 10.5
OCBs
despite a 100bp yoy contraction in gross margin, largely aided by a 200bp Indian Public / Others 17.2
reduction in advertising spend (flat yoy in absolute terms).
Outlook and Valuation: We continue to like GSK Consumer for its sustained
volume growth in its core brands, higher contribution from new product launches Abs. (%) 3m 1yr 3yr
coupled with higher dividend payout potential due to the high cash balance Sensex 3.0 15.4 20.7
(Rs830cr as on June 2010). However, at the CMP of Rs1,785, the stock is trading
GSKCH 8.9 61.6 197.5
at rich valuations of 23.2x CY2011E EPS of Rs77, which is at a significant
premium to its historical valuations. Hence, we maintain our Reduce rating on the
stock, with a Target Price of Rs1,695 (based on 22x CY2011E earnings, ~30%
premium to its 5-yr average historical valuations).
Key Financials
Y/E Dec (Rs cr) CY2009 CY2010 CY2011E CY2012E
Net Sales 1,542 1,922 2,256 2,623
% chg 20.6 24.6 17.4 16.2
Net Profit (Adj) 190 230 275 324
% chg 16.8 21.2 19.6 17.7
EBITDA (%) 15.4 16.2 16.3 16.6
EPS (Rs) 44.8 55.3 65.4 77.0
P/E (x) 39.9 32.3 27.3 23.2 Anand Shah
P/BV (x) 9.9 8.3 7.0 5.9 022 – 4040 3800 Ext: 334
anand.shah@angeltrade.com
RoE (%) 27.0 27.9 27.8 27.7
RoCE (%) 27.3 32.4 33.0 33.2
Chitrangda Kapur
EV/Sales (x) 4.6 3.5 3.0 2.5
022 – 4040 3800 Ext: 323
EV/EBITDA (x) 29.6 21.5 18.3 15.1 chitrangdar.kapur@angeltrade.com
Source: Company, Angel Research
Please refer to important disclosures at the end of this report 1
2. GSK Consumer |2QCY2010 Result Update
Exhibit 1: Quarterly Performance
Y/E Dec (Rs cr) 2QCY10 2CFY09 % yoy CY2010 CY2009 % chg
Net Sales 537.4 469.4 14.5 1,185.8 1,008.3 17.6
Consumption of RM 202.5 172.2 17.6 458.6 386.2 18.8
(% of Sales) 37.7 36.7 38.7 38.3
Staff Costs 58.9 52.3 12.5 110.5 102.1 8.3
(% of Sales) 11.0 11.2 9.3 10.1
Advertising 74.9 74.7 0.2 173.1 135.3 28.0
(% of Sales) 13.9 15.9 14.6 13.4
Other Expenses 111.7 95.3 17.2 221.1 191.4 15.5
(% of Sales) 20.8 20.3 18.6 19.0
Total Expenditure 448.0 394.6 13.5 963.3 814.9 18.2
Operating Profit 89.4 74.8 19.5 222.4 193.5 15.0
OPM (%) 16.6 15.9 18.8 19.2
Interest 0.6 1.1 (41.0) 1.2 2.3 (47.1)
Depreciation 9.3 10.5 (11.9) 18.9 21.1 (10.8)
Other Income 28.1 22.6 24.1 51.6 48.2 7.2
PBT (excl. Extr. Items) 107.6 85.9 25.3 254.0 218.2 16.4
Extr. Income/(Expense) - - - -
PBT (incl. Extr. Items) 107.6 85.9 25.3 254.0 218.2 16.4
(% of Sales) 20.0 18.3 21.4 21.6
Provision for Taxation 35.8 30.7 16.8 86.1 79.1 8.8
(% of PBT) 33.3 35.7 33.9 36.3
Reported PAT 71.8 55.2 30.0 167.9 139.1 20.7
PATM(%) 13.4 11.8 14.2 13.8
Equity shares (cr) 4.2 4.2 4.2 4.2
EPS (Rs) 17.0 13.1 30.0 39.9 33.0 20.7
Source: Company, Angel Research
Top-line growth moderates to 14.5%, lowest in last 10 quarters
GSK Consumer posted moderate top-line growth of 14.5% yoy (lowest in the last 10
quarters) to Rs537cr (Rs469cr), below our estimates of 20% growth. Top-line growth
was led by 10% volume growth and 5% value growth (~5-6% price hikes in January,
2010) while increase in excise duty (from 8% to 10%) led to ~1% impact on top-line.
Exhibit 2: ~1% excise duty impact and lower exports impact top-line
700 35.0
600 30.0
500 25.0
(yoy %)
400 20.0
(Rs cr)
300 15.0
200 10.0
100 5.0
- -
2QCY08 4QCY08 2QCY09 4QCY09 2QCY10
Top-line (LHS) YoY growth (RHS)
Source: Company, Angel Research
August 2, 2010 2
3. GSK Consumer |2QCY2010 Result Update
While the company’s core brands Horlicks and Boost registered healthy volume
growth of 10% yoy and 17% yoy respectively, exports (contribute ~8% to top-line)
grew at a muted 3% yoy due to higher competitive intensity in Sri Lanka. Biscuits
continued its strong growth momentum, registering a growth of 15% yoy.
Management indicated that Boost has gained 1% market share in overall MFD
(Malted Foods) category led by gains from stronger distribution network and higher
marketing activity. In the noodles category, Horlicks Foodles has received
encouraging response and has already gained 5% market share in the south and 4%
market share in the east. GSK Consumer will be launching the product in the
north/west market in 3QCY2010. According to management, the noodles market is
growing at a strong 25% and expects the entry of new players to further drive market
expansion.
Exhibit 3: Volume growth moderates to ~10% Exhibit 4: Core brands maintain double-digit growth
25 12.0 25 21
20
10.0 20 16 1615 17
20
14 13
8.0 15 12 11
15 (%) 10 10 99 10
(yoy %)
10 8 8
6.0
(%)
6
10 5
4.0
5 -
2.0 2QCY08
3QCY08
4QCY08
1QCY09
2QCY09
3QCY09
4QCY09
1QCY10
2QCY10
- -
2QCY08 4QCY08 2QCY09 4QCY09 2QCY10
Volume (LHS) Value (RHS) Horlicks Boost
Source: Company, Angel Research Source: Company, Angel Research
Lower ad spends drive strong 30% yoy earnings growth
GSK Consumer registered a strong 30% yoy earnings growth to Rs71.8cr (Rs55.2cr),
ahead of our estimates of 19% yoy growth, aided by margin expansion, a 24% yoy
jump in other income and 243bp decline in tax rate. At the operating level, GSK
Consumer reported margin expansion of 69bp yoy, despite the 100bp yoy
contraction in gross margin, largely aided by a 200bp reduction in advertising
spends (flat yoy in absolute terms). According to management, liquid milk price
increased by ~25% yoy and 10% qoq, while powder milk price increased by ~15%
yoy and 9% qoq for the quarter. While the sugar prices have corrected, management
expects malt and barley prices to rise in 2HCY2010 led by lower supply constraints.
In terms of ad spend, management expects it to rise in 2HCY2010 due to national
roll out of Horlicks Foodles and has guided for ~14-15% of sales for the entire year.
Exhibit 5: Low ad spend drive earnings growth Exhibit 6: Gross margins dip 100bp yoy
110 60.0 80.0
65.1 67.0
70.0 61.3 59.7 60.3 63.3 62.3 60.5 62.3
90 50.0
60.0
40.0 50.0
70
(Rs cr)
40.0
(yoy %)
30.0
(%)
50 30.0 22.0 20.5
20.0 14.5 14.9 11.8 15.9 15.9 16.6
20.0 8.8
30 10.0 10.0
10 - -
2QCY08 4QCY08 2QCY09 4QCY09 2QCY10 2QCY08 4QCY08 2QCY09 4QCY09 2QCY10
PAT (LHS) YoY growth (RHS) OPM Gross Margin
Source: Company, Angel Research Source: Company, Angel Research
August 2, 2010 3
4. GSK Consumer |2QCY2010 Result Update
Investment Rationale
Core brands on strong footing, new launches hold potential: GSK Consumer
continues to post double-digit growth in its core brands Horlicks and Boost
driven by steady 8-10% volume growth and ~5% from price hikes. Moreover,
recent launches (Women’s Horlicks, Horlicks Nutribar, Actibase, Actigrow and
Horlicks Foodles) have started gaining traction and hold significant potential. In
the noodles category, Horlicks Foodles has received encouraging response and
already gained 5% market share in the south and 4% market share in East. GSK
Consumer will be launching the product in north/west market in 3QCY2010.
Margins to sustain driving robust 18% earnings CAGR over CY2009-11E:
During CY2009-11E, we expect GSK Consumer to sustain its margins at ~16-
16.5%, despite lower gross margins, driven largely by higher operating leverage
and lower ad-spend (expected to be maintained at ~15% of sales). Hence, we
expect earnings to post robust 18% CAGR driven by steady top-line growth,
higher other income (cash balance at Rs820cr as at the end of CY2009) and
sustained margins.
Unjustified valuations of ~60% premium to Sensex: Over the last couple of
years, GSK Consumer has witnessed significant re-rating in its valuations driven
by strong earnings growth, new variant launches under Horlicks and entry into
new product categories like noodles. However, the stock currently trades at
~60% premium to the Sensex (in line with HUL), which we believe is unjustified
given: 1) still ~90%+ revenues depend on single category malted foods, 2)
lower return ratios at ~30%, and 3) lower dividend payout at ~40%.
Outlook and Valuation
We have tweaked our estimates to marginally account for lower revenue traction
exhibited during the quarter and higher OPM (tweaked our ad spends downwards).
However, there is no material change in our earnings estimates.
Exhibit 7: Change in Estimates
Old Estimate New Estimate % chg
(Rs cr) CY10E CY11E CY10E CY11E CY10E CY11E
Revenue 2,279 2,667 2,256 2,623 (1.0) (1.7)
OPM (%) 16.1 16.4 16.3 16.6 22bp 20bp
EPS (Rs) 65.1 77.2 65.4 77.0 0.4 (0.3)
Source: Company, Angel Research
We continue to like GSK Consumer for its sustained volume growth in its core
brands, higher contribution from new product launches coupled with potential higher
dividend payout due to high cash balance (Rs830cr cash balance as on June 2010).
However, at the CMP of Rs1,785, the stock is trading at rich valuations of 23.2x
CY2011E EPS of Rs77, which is at a significant premium to its historical valuations
leaving little room for upside or negative surprises. Hence, we maintain our Reduce
rating on the stock, with a Target Price of Rs1,695.
August 2, 2010 4
10. GSK Consumer |2QCY2010 Result Update
Research Team Tel: 022 - 4040 3800 E-mail: Research@angeltrade.com Website: www.angeltrade.com
Disclaimer
This document is solely for the personal information of the recipient, and must not be singularly used as the basis of any investment
decision. Nothing in this document should be construed as investment or financial advice. Each recipient of this document should make
such investigations as they deem necessary to arrive at an independent evaluation of an investment in the securities of the companies
referred to in this document (including the merits and risks involved), and should consult their own advisors to determine the merits and
risks of such an investment.
Angel Broking Limited, its affiliates, directors, its proprietary trading and investment businesses may, from time to time, make
investment decisions that are inconsistent with or contradictory to the recommendations expressed herein. The views contained in this
document are those of the analyst, and the company may or may not subscribe to all the views expressed within.
Reports based on technical and derivative analysis center on studying charts of a stock's price movement, outstanding positions and
trading volume, as opposed to focusing on a company's fundamentals and, as such, may not match with a report on a company's
fundamentals.
The information in this document has been printed on the basis of publicly available information, internal data and other reliable
sources believed to be true, but we do not represent that it is accurate or complete and it should not be relied on as such, as this
document is for general guidance only. Angel Broking Limited or any of its affiliates/ group companies shall not be in any way
responsible for any loss or damage that may arise to any person from any inadvertent error in the information contained in this report.
Angel Broking Limited has not independently verified all the information contained within this document. Accordingly, we cannot testify,
nor make any representation or warranty, express or implied, to the accuracy, contents or data contained within this document. While
Angel Broking Limited endeavours to update on a reasonable basis the information discussed in this material, there may be regulatory,
compliance, or other reasons that prevent us from doing so.
This document is being supplied to you solely for your information, and its contents, information or data may not be reproduced,
redistributed or passed on, directly or indirectly.
Angel Broking Limited and its affiliates may seek to provide or have engaged in providing corporate finance, investment banking or
other advisory services in a merger or specific transaction to the companies referred to in this report, as on the date of this report or in
the past.
Neither Angel Broking Limited, nor its directors, employees or affiliates shall be liable for any loss or damage that may arise from or in
connection with the use of this information.
Note: Please refer to the important `Stock Holding Disclosure' report on the Angel website (Research Section). Also, please refer to the
latest update on respective stocks for the disclosure status in respect of those stocks. Angel Broking Limited and its affiliates may have
investment positions in the stocks recommended in this report.
Disclosure of Interest Statement GSKCHL
1. Analyst ownership of the stock No
2. Angel and its Group companies ownership of the stock No
3. Angel and its Group companies' Directors ownership of the stock No
4. Broking relationship with company covered No
Note: We have not considered any Exposure below Rs 1 lakh for Angel, its Group companies and Directors.
Ratings (Returns) : Buy (> 15%) Accumulate (5% to 15%) Neutral (-5 to 5%)
Reduce (-5% to 15%) Sell (< -15%)
August 2, 2010 10