VIP Kolkata Call Girl Jodhpur Park 👉 8250192130 Available With Room
Weekly Review
1. Weekly Review
September 9, 2010
Markets extend gains FII activity
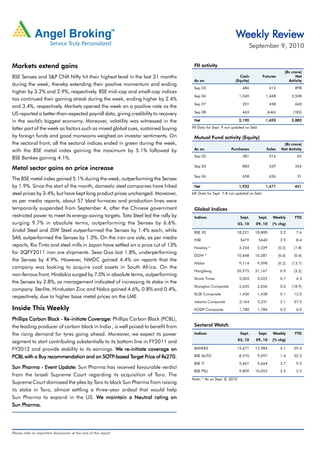
(Rs crore)
BSE Sensex and S&P CNX Nifty hit their highest level in the last 31 months Cash Futures Net
As on (Equity) Activity
during the week, thereby extending their positive momentum and ending
Sep 03 486 412 898
higher by 3.2% and 2.9%, respectively. BSE mid-cap and small-cap indices
Sep 06 1,040 1,468 2,508
too continued their gaining streak during the week, ending higher by 2.4%
Sep 07 201 458 660
and 3.4%, respectively. Markets opened the week on a positive note as the
US reported a better-than-expected payroll data, giving credibility to recovery Sep 08 463 (646) (183)
in the world's biggest economy. Moreover, volatility was witnessed in the Net 2,190 1,693 3,882
latter part of the week as factors such as mixed global cues, sustained buying FII Data for Sept. 9 not updated on Sebi
by foreign funds and good monsoons weighed on investor sentiments. On Mutual Fund activity (Equity)
the sectoral front, all the sectoral indices ended in green during the week, (Rs crore)
with the BSE metal index gaining the maximum by 5.1% followed by As on Purchases Sales Net Activity
Sep 02 381 316 65
BSE Bankex gaining 4.1%.
Sep 03 883 529 354
Metal sector gains on price increase
Sep 06 658 626 31
The BSE metal index gained 5.1% during the week, outperforming the Sensex
by 1.9%. Since the start of the month, domestic steel companies have hiked Net 1,922 1,471 451
steel prices by 3-4%, but have kept long product prices unchanged. Moreover, MF Data for Sept. 7-8 not updated on Sebi
as per media reports, about 57 blast furnaces and production lines were
temporarily suspended from September 4, after the Chinese government Global Indices
restricted power to meet its energy-saving targets. Tata Steel led the rally by Indices Sept. Sept. Weekly YTD
surging 9.7% in absolute terms, outperforming the Sensex by 6.6%. 03, 10 09, 10 (% chg)
Jindal Steel and JSW Steel outperformed the Sensex by 1.4% each, while BSE 30 18,221 18,800 3.2 7.6
SAIL outperformed the Sensex by 1.3%. On the iron ore side, as per media NSE 5479 5640 2.9 8.4
reports, Rio Tinto and steel mills in Japan have settled on a price cut of 13% Nasdaq * 2,234 2,229 (0.2) (1.8)
for 3QFY2011 iron ore shipments. Sesa Goa lost 1.8%, underperforming
DOW * 10,448 10,387 (0.6) (0.4)
the Sensex by 4.9%. However, NMDC gained 4.4% on reports that the
Nikkei 9,114 9,098 (0.2) (13.7)
company was looking to acquire coal assets in South Africa. On the
HangSeng 20,972 21,167 0.9 (3.2)
non-ferrous front, Hindalco surged by 7.0% in absolute terms, outperforming
Straits Times 3,003 3,022 0.7 4.3
the Sensex by 3.8%, as management indicated of increasing its stake in the
Shanghai Composite 2,655 2,656 0.0 (18.9)
company. Sterlite, Hindustan Zinc and Nalco gained 4.6%, 0.8% and 0.4%,
KLSE Composite 1,436 1,438 0.1 13.0
respectively, due to higher base metal prices on the LME.
Jakarta Composite 3,164 3,231 2.1 27.5
Inside This Weekly KOSPI Composite 1,780 1,784 0.2 6.0
Phillips Carbon Black - Re-initiate Coverage: Phillips Carbon Black (PCBL),
Re-initiate
the leading producer of carbon black in India , is well poised to benefit from Sectoral Watch
the rising demand for tyres going ahead. Moreover, we expect its power Indices Sept. Sept. Weekly YTD
03, 10 09, 10 (% chg)
segment to start contributing substantially to its bottom line in FY2011 and
FY2012 and provide stability to its earnings. We re-initiate coverage on
re-initiate BANKEX 12,471 12,984 4.1 29.4
SOTPTP-based Target Price
PCBL with a Buy recommendation and an SOTP-based Target Price of Rs270. BSE AUTO 8,970 9,097 1.4 22.3
BSE IT 5,461 5,664 3.7 9.2
Sun Pharma - Event Update: Sun Pharma has received favourable verdict
BSE PSU 9,809 10,053 2.5 5.5
from the Israeli Supreme Court regarding its acquisition of Taro. The
Note: * As on Sept. 8, 2010
Supreme Court dismissed the plea by Taro to block Sun Pharma from raising
its stake in Taro, almost settling a three-year ordeal that would help
Sun Pharma to expand in the US. We maintain a Neutral rating on
Sun Pharma.
Please refer to important disclosures at the end of this report
2. Fundamental Focus |September 9, 2010
Focus
Phillips Carbon Black - Buy Price - Rs213
Target Price - Rs270
Re-initiate Coverage
Black Magic lend stability to the company's earnings while significantly de-
risking its business model.
Phillips Carbon Black (PCBL), part of the RPG Group, is the
leading producer of carbon black in India, with ~48% of the Outlook and valuation
total installed capacity in FY2010. Currently, with ~65% of the Considering the favourable demand-supply dynamics of the
total carbon black production in the country being consumed carbon black industry, PCBL's capacity addition plans and its
by the tyre industry, PCBL is well poised to benefit from the dominant position , we believe it to be well poised to capitalise
rising demand for tyres going ahead. Moreover, we expect the on the increasing demand for carbon black going ahead.
company's power segment to start contributing substantially to Moreover, the company's power segment is expected to
its bottom-line in FY2011 and FY2012 and provide stability to contribute significantly to its profitability and lend stability to
its earnings. the company's earnings coupled with significantly de-risking
Carbon black demand-supply scenario to be favourable: On
demand-supply its business model. Thus, we are bullish on the company's growth
the demand front, considering the growth rate in domestic prospects over FY2010-12E
demand (9.6% CAGR over FY2010-12E) and exports (25%
We have valued PCBL on the sum-of-the parts valuation
CAGR over FY2010-12E), we estimate the carbon black
methodology and arrived at a Target Price of Rs270 wherein
production (after factoring imports) to record CAGR of 11.8%
we have valued PCBIL's carbon black segment at Rs144/share
over FY2010-12E. With the rising production trend, the overall
(1x FY2012E P/BV) and the power segment at Rs126/share
capacity utilisation is also likely to rise to ~87% in FY2012E
re-initiate
(NPV method). We re-initiate coverage on the stock with a Buy
from ~82% in FY2010. On the other hand, supply is expected
SOTPTP-based Target Price
recommendation and SOTP-based Target Price of Rs270.
to record CAGR of 8.6% during FY2010-12E, thereby leading
to a favourable demad-supply dcenario for the industry.
PCBL’s
Volume growth backed by capacity expansions to drive PCBL’s
carbon black revenues: To capitalise on the rising demand for
tyres PCBL has been on the expansion spree. Post commissioning
of the 90,000MT green-field plant at Mundra in October 2009,
Key Financials
the company's current installed capacity stands at 360,000MT.
PCBL plans to further increase its capacity to 410,000MT by Y/E March (Rs cr) FY2009 FY2010 FY2011E FY2012E
setting up a brown-field plant of 50,000MT in Mundra, which Net Sales 1,163 1,235 1,643 1,899
is expected to be operational by 3QFY2011E. Thus, with % chg 12.6 6.0 33.3 15.6
additional capacities coming on stream, we expect volumes Profit
Net Profit (72.1) 122.7 143.9 175.4
and revenues of the carbon black segment to register CAGR of
% chg - - 17.2 22.0
15.3% and 22.3% respectively over FY2010-12E.
EBITDA Margin (%) - 15.4 16.1 16.2
Power segment- The game changer: PCBL currently has in place
segment-
EPS (Rs) - 43.4 41.7 50.9
60.5MW of power generating capacity and with further
capacities coming up, the same will be enhanced to 77.5MW P/E (x) - 4.9 5.1 4.2
by 3QFY2012E. Since PCBL utilises the off-gas generated during P/BV (x) 2.7 1.8 1.3 1.0
the manufacture of carbon black for producing power, the RoE (%) - 44.8 31.7 26.6
company has no raw material requirements. Hence, although
RoCE (%) - 20.7 22.8 23.6
the power revenues would contribute a mere ~7% to the
company's total top-line in FY2012E, on the bottom-line front EV / Sales (x) 1.0 1.0 0.6 0.5
it would contribute ~50% of total profit. Thus, a high proportion EV/EBITDA (x) - 6.5 4.0 3.0
of the power revenues would percolate to the bottom-line and Source: Company, Angel Research; Price as on September 3, 2010
Research Analyst - Viraj Nadkarni
For Private Circulation Only | Angel Broking Ltd: BSE Sebi Regn No : INB 010996539 / CDSL Regn No: IN - DP - CDSL - 234 - 2004 / PMS Regn Code: PM/INP00000154 6 Angel Securities Ltd:BSE: INB010994639/INF010994639 NSE: INB230994635/INF230994635 Membership numbers: BSE 028/NSE:09946 2
3. Fundamental Focus | September 9, 2010
Focus
Sun Pharma - Neutral Price - Rs1,756
Event Update
Sun-Taro saga nearing to end… On closure of the open offer on September 14, 2010, Levitt
family becomes liable to honour the option agreement by selling
Sun Pharma has received favourable verdict from the Israeli
its stake (11.5%) to Sun Pharma. However, it might recourse to
Supreme Court regarding its acquisition of Taro. The Supreme
further legal action.
Court dismissed the plea by Taro to block Sun Pharma from
raising its stake in Taro, almost settling a three-year ordeal that Taro is currently quoting at US $11.4/share, which is at
would help Sun Pharma to expand in the US. 47% premium to the open offer price of US $7.75/share. Hence,
we do not expect any fresh tendering of shares under the offer.
We view this as a positive development for Sun Pharma; however,
the future course of action by Taro's promoter (Levitt family) is Overall, Sun Pharma is expected to invest additional US $60mn
still uncertain. In case the Levitt family does not go for any fresh to increase its stake in Taro.
legal course and honour the option agreement post the closure Outlook and valuation
of the open offer, then Sun Pharma's stake in Taro would increase
to 53.4% (voting rights 65%) from the current 36.6% (voting We expect Sun Pharma's net sales to post a 16.6% CAGR to
rights 24%). Rs5,581cr and EPS to register a 14.0% CAGR to Rs84.8 over
FY2010-12E. On the valuation front, we have valued Taro at
Favourable verdict from the Israeli Supreme Court: Sun Pharma
Rs85/share (1x Mcap/Sales), given the lack of clarity over Taro's
has received favourable verdict from the Israeli Supreme Court,
financials. The stock is trading at 24.5x FY2011E and 20.7x
which upheld Tel-Aviv District Court's ruling dismissing the
FY2012E core earnings. We recommend Neutral on the stock
appeal by Taro. The Supreme Court held that the Israeli special
Fair Value
with a Fair Value of Rs1,781 (Rs1,696/share, valuing the core
tender offer rules do not apply to the tender offer by Sun Pharma
business at 20x FY2012E earnings; and Rs85/share for Taro).Taro).
to purchase all outstanding shares of Taro for US $7.75 per
share in cash.
The three-judge bench of the Supreme Court said there were
no legal or moral grounds that required Sun Pharma to comply
with the special tender offer rules. The Court declared that its Key Financials (Consolidated)
ruling in favour of Sun Pharma was dictated by concerns of Y/E March (Rs cr) FY2009 FY2010 FY2011E FY2012E
fairness, good faith and commercial stability and affirmed the
Net Sales 4,273 4,103 4,830 5,581
District Court's finding that Taro and its directors had acted in
bad faith. % chg 27.3 (4.0) 17.7 15.6
Profit
Net Profit 1,818 1,351 1,483 1,756
The Court also awarded judicial expenses to Sun Pharma. The
open tender offer is now scheduled to expire on September 14, % chg 20.7 (25.7) 9.8 18.4
2010. Further, Sun Pharma will provide a subsequent offering EPS (Rs) 87.8 65.2 71.6 84.
84.8
period of not less than 10 business days nor more than 20 EBITDA Margin (%) 43.6 33.2 32.5 33.5
business days following the expiration date. Since May 2007,
P/E (x) 20.0 26.9 24.5 20.7
Sun Pharma has acquired 36.6% stake (voting right 24%) in
Taro for US $105mn. RoE (%) 30.2 17.8 17.1 17.7
RoCE (%) 27.4 15.3 15.6 16.4
Post the favourable outcome of the Supreme Court, the following
things could emerge for Sun Pharma: P/BV (x) 5.2 4.5 3.9 3.4
Taro issues 3.8mn shares to Sun Pharma post the exercise EV/Sales (x) 8.2 8.3 7.0 5.9
of warrants in December 2009 under the Share Purchase EV/EBITDA (x) 18.7 25.1 21.6 17.7
Agreement (SPA), which was sub judice pending the Supreme Source: Company, Angel Research; Price as on September 8, 2010; Note:
Taro financials has not been included
Court's decision.
Research Analyst - Sarabjit Kour Nangra /Sushant Dalmia
For Private Circulation Only | Angel Broking Ltd: BSE Sebi Regn No : INB 010996539 / CDSL Regn No: IN - DP - CDSL - 234 - 2004 / PMS Regn Code: PM/INP00000154 6 Angel Securities Ltd:BSE: INB010994639/INF010994639 NSE: INB230994635/INF230994635 Membership numbers: BSE 028/NSE:09946 3
4. Fundamental Focus |September 9, 2010
Focus
Ispat Industries - Not Rated Price - Rs20
Management Meet Note
Incorporated in 1984, Ispat Industries upstream facilities (sponge from Bacheli complex is Rs8,500/tonne and from the Kirandul
iron, pig iron, hot rolled coils) are located at Dolvi complex is Rs7,200/tonne. Ispat also has a quarterly pricing
(Maharashtra), 80-85kms away from Mumbai and are spread contract with GIIC Bahrain for supply of pellets.
across 1,400 acres. The downstream facilities (galvanized The blended cost of natural gas is ~Rs10/scm. Ispat sources
sheets, cold rolled coils) are located at Kalmeshwar (Nagpur, gas from Reliance, PMT and ONGC.
Maharashtra). Ispat produces steel using the twin shell conarc
Currently, the company purchases power at Rs5.5/unit,
furnace technology developed by SMS Siemag, Germany. The
which is expected to reduce post the commissioning of the
technology provides flexibility in terms of raw material feed, ie.
110MW power plant.
sponge iron, hot metal or scrap. Also, energy consumption is
lower at approx 240 units/tonne compared to the conventional The production cost for sponge iron, pig iron and hot rolled
EAF requirement of ~550 units/tonne of steel. coils is Rs17,500, Rs22,000 and Rs29,000/tonne, respectively.
We met management of Ispat Industries. Key takeaways of our The main advantage of using natural gas based plants is
meeting are as follows: that the product quality is superior and the plant can produce
both long and flat products, whereas coal-based plants
Joint venture with Stemcor to set up a coke oven plant: Ispat
manufacture only long products.
has entered into a JV (Amba River Coke) with Stemcor for setting
up a 1mn tonne coke oven plant at a cost of Rs1,124cr. Ispat Maintenance costs are low as gas-based plants undertake
holds 26% equity stake & the balance is held by Stemcor. The 10-15 days of annual maintenance shutdown as compared to
project will be funded through debt-equity ratio of 2:1 and is coal-based plants, which undergo quarterly shutdown.
yet to achieve the financial closure. Ispat's equity contribution Outlook and Valuation
will be Rs100cr (Rs50cr will be through land and infrastructure
At the CMP the stock is trading at P/BV of 1.4x and EV/EBITDA
,
support and balance Rs50cr through cash infusion). Once
of 7.8x FY2010. We believe the future stock performance will
commissioned, the plant will cater to 100% coke requirement.
be driven by improvement in raw material integration and
110MW power plant to lead to cost savings: Ispat under its successful commissioning of the power and coke oven plants.
subsidiary, Ispat Energy, is setting up 110MW captive power
plant (CPP) comprising of two units of 55MW each. The plant Key Financials (Consolidated)
will primarily use gases from coke oven and blast furnace. Land Y/E March (Rs cr) FY2007 FY2008 FY2009 FY2010E
for the project has been acquired and the civil work has also
Net Sales 7,473 8,323 8,264 7,783
started. Total cost of the project is expected to be Rs491cr and
% chg 48.8 11.4 (0.7) (5.8)
the company expects savings of Rs1,300cr post commissioning
of the power plant. Profit
Net Profit (10) 31 (690) (253)
Captive raw material holds the key for future performance: % chg - - - -
Ispat has already secured the prospecting license for developing EPS (Rs) (0.8) - (6.3) (3.4)
iron ore mines in Maharashtra. The management expects to EBITDA (%) 20.4 14.6 5.3 16.1
start mining in FY2012 and targets iron ore production of 2mn
P/E (x) - - - -
tonnes. The company in a JV with Essar Steel, Mukand, Kalyani
P/BV (x) 0.8 0.9 1.2 1.4
Steel and Ind Synergy has also been allotted Behrabad (North)
coking coal block in Madhya Pradesh. The mine has reserves RoE (%) - 0.0 - -
of 170mn tonnes, with Ispat's share being 76mn tonnes. RoCE (%) 8.3 5.4 - 6.8
Other key takeaways EV/Sales (x) 1.4 1.2 1.2 1.2
Ispat buys iron ore fines and lump ore from NMDC and EV/EBITDA (x) 6.9 7.9 22.4 7.8
imports pellets from GIIC Bahrain. The landed cost of iron ore Source: Company, Angel Research; Price as on September 8, 2010
Research Analyst - Paresh Jain/Pooja Jain
For Private Circulation Only | Angel Broking Ltd: BSE Sebi Regn No : INB 010996539 / CDSL Regn No: IN - DP - CDSL - 234 - 2004 / PMS Regn Code: PM/INP00000154 6 Angel Securities Ltd:BSE: INB010994639/INF010994639 NSE: INB230994635/INF230994635 Membership numbers: BSE 028/NSE:09946 4
5. Technical Picks | September 9, 2010
Bulls in control - Markets may witness Exuberance
Sensex (18800) / Nifty (5640)
In our previous Weekly report, we had mentioned that in view
Exhibit 1: Sensex Weekly chart
of the narrow range body formation for two consecutive trading Upward sloping Channel
sessions, consolidation of the previous rise was being witnessed
but not weakness, and expected markets to test higher levels of
18900 - 19050 / 5700 - 5750 in a couple of weeks. The week
opened on a strong note and witnessed up-side momentum,
which led the indices to close at a new 52-week high of 18800
/ 5640 levels. The Sensex ended with net gains of (3.2)%,
whereas the Nifty gained (2.9)% vis-à-vis the previous week.
Pattern Formation
Source: Falcon
On the Weekly chart prices have given a breakout from
chart,
the upper trendline of the upward sloping channel, which was
acting as a strong resistance zone for several weeks. Further,
the momentum oscillators and indicators viz. RSI, Stochastic
and ADX are positively poised. This suggests continuation of
the upward momentum (refer Exhibit 1).
Future Outlook
The coming week is likely to trade with positive bias. On the
upside, we maintain our view that the indices are likely to test
18900 - 19050 / 5700 - 5750 levels in a couple of weeks
or could even extend the gains beyond our target levels as the
markets may witness a dynamic up-move. On the downside,
18440 - 18321 / 5530 - 5500 levels may act as support for
the markets.
Traders with long positions in the range of 5470 - 5400 levels
are advised to trail their stop loss to 5460 levels and hold their
long positions for the mentioned target levels.
For Private Circulation Only | Angel Broking Ltd: BSE Sebi Regn No : INB 010996539 / CDSL Regn No: IN - DP - CDSL - 234 - 2004 / PMS Regn Code: PM/INP00000154 6 Angel Securities Ltd:BSE: INB010994639/INF010994639 NSE: INB230994635/INF230994635 Membership numbers: BSE 028/NSE:09946 5
7. Derivatives Review | September 9, 2010
5600-5700 is strong resistance zone
Nifty spot has closed at 5640 this week, against a close of 5479 l week. The Put-Call Ratio has increased from 1.38 to 1.48 levels
last
and the annualized Cost of Carry (CoC) is negative 2.53 The Open Interest of Nifty Futures has increased by 12.59
2.53%. 12.59%.
Put-Call Ratio Analysis Futures Annual Volatility Analysis
The Nifty PCR has increased from 1.38 to 1.48 levels. Week on The Historical Volatility of the Nifty has increased from 13.45%
week, a huge build up was visible in the 5500 and 5600 Put to 14.48%. IV of at the money options has decreased from
options. The 5600 put added around 139000 contracts, which 13.50% to 11.50%. Some liquid counters where HV has
we believe is mainly due to buying, as IV is at a very low level increased significantly are STERLINBIO, INDIACEM, ACC,
and FIIs are continuously buying Index options. On the other ULTRACEMCO and GODREJIND. Stocks where HV has
hand, unwinding in most of the call options below 5600 strike decreased are TECHM, IFCI, INDHOTEL, VIJAYABANK and
and a significant build up in the 5700 and 5800 call options TATACOMM.
was also observed.
Open Interest Analysis Cost-of-Carry Analysis
The total Open Interest of the market is Rs1,90,183cr, as against The Nifty Sep. Future closed at a discount of 8.20 points, against
Rs1,68,133cr last week, and the Stock Futures' open interest a premium of 5.50 points last week and the Oct future closed
increased from Rs46737cr to Rs50,452cr. Some liquid stocks at a discount of 3.15 points. Few liquid counters where CoC
where open interest has increased significantly are BAJAJ-AUTO, turned from negative to positive are EXIDEIND, IOB, RANBAXY
DABUR, HINDZINC, GVKPIL and GESHIP Stocks where open
. and AXISBANK. Stocks where CoC turned from positive to
interest has decreased significantly are ISPATIND, GMDCLTD, negative are SBIN, DABUR, TATASTEEL and BHEL.
LUPIN, TV-18 and GTOFFSHORE.
Derivative Strategy
HINDUNILVR
Scrip : HINDUNILVR CMP : Rs. 279.05/- Lot Size : 1000 Expiry Date (F&O) :
30th Sep, 2010
View: Mildly Bearish Strategy: Call Hedge Expected Payoff
Buy/Sell Qty Scrip Strike Series Option Rate Price
Closing Price Expected
rofit/Loss
Profit/Loss
Price Type (Rs.)
Sell 1000 HINDUNILVR Fut. Sep - 278.00 Rs. 265.00 Rs. 9.00
Buy 1000 HINDUNILVR 280 Sep Call 4.00 Rs. 270.00 Rs. 4.00
Rs. 275.00 (Rs. 1.00)
BEP: Rs. 274.00/-
BEP:
Max. Risk: Rs. 6,000.00/- Max. Profit: Unlimited
Profit: Rs. 280.00 (Rs. 6.00)
If HINDUNILVR closes on or above Rs. 280 on expiry. If HINDUNILVR continues to trade below BEP. Rs. 285.00 (Rs. 6.00)
NOTE: Profit can be booked before expiry if Stock moves in the favorable direction.
NOTE
TE: Rs. 290.00 (Rs. 6.00)
Scrip : NIFTY CMP : 5640.05/- Lot Size : 50 Expiry Date (F&O) :
30th Sep, 2010
View: Mildly Bearish Strategy: Long Put Expected Payoff
Buy/Sell Qty Scrip Strike Series Option Rate Price
Closing Price Expected
rofit/Loss
Profit/Loss
Price Type (Rs.)
Buy 50 NIFTY 5600 Sep Put 50.00 Rs. 5375.00 Rs. 175.00
BEP: 5550.00/-
BEP: Rs. 5450.00 Rs. 100.00
Max. Risk: Rs. 2,500.00/- Max. Profit: Unlimited
Profit: Rs. 5525.00 Rs. 25.00
If NIFTY closes on or above 5600 level on expiry. If NIFTY continues to trade below BEP
. Rs. 5600.00 (Rs. 50.00)
NOTE: Profit can be booked before expiry if NIFTY moves in the favorable direction.
NOTE
TE: Rs. 5675.00 (Rs. 50.00)
Rs. 5750.00 (Rs. 50.00)
For Private Circulation Only | Angel Broking Ltd: BSE Sebi Regn No : INB 010996539 / CDSL Regn No: IN - DP - CDSL - 234 - 2004 / PMS Regn Code: PM/INP00000154 6 Angel Securities Ltd:BSE: INB010994639/INF010994639 NSE: INB230994635/INF230994635 Membership numbers: BSE 028/NSE:09946 7
8. Fund Focus
Mutual Fund Focus | September 9, 2010
Recommended Schemes in Balanced Funds
HDFC Prudence Fund - Growth
Scheme Objective Portfolio Attributes (31-Jul-10)
The investment objective of the Scheme is to provide periodic returns Large Cap (%) 35.93
and capital appreciation over a long period of time, from a judicious Mid Cap (%) 30.08
mix of equity and debt investments, with the aim to prevent/
Small Cap (%) 6.96
minimize any capital erosion.
Equity (%) 73.43
Fund at a Glance
Bonds (%) 12.84
Face Value
Value 10
Gilt (%) 8.59
NAV (6-Sept
Sept-10)
NAV (6-Sept-10) 211.28
52-Week High (6-Sept-10) 211.28
52-W (6-Sept
Sept-10) Debt (%) 21.43
52-Week Low (7-Sept-09) 151.44
52-W Low (7-Sept
Sept-09) Cash & Equivalent (%) 5.14
Fund Category Hybrid
Type Open Ended Key Ratios
Load
Entry Load NIL Expense Ratio (%) 1.84
Load
Exit Load 1% for redemption within 1 year Standard Deviation 0.42
Inv.
Minimum Inv. Rs. 5000 Beta 1
Inception Date 1st February 1994 Sharpe 0.45
31-Jul-10
AUM as on 31- Jul-10 Rs. 4742.43cr
Jensen 7.08
Benchmark Index Crisil Balanced Fund Index Ratios as on 6th September 2010 on the Basis of 3 years daily rolling return (CAGR)
Fund Manger Mr. Prashant Jain / Mr. Anand Laddha
Investment Analysis** (as on 6th September 2010)
Top 5 Holdings as on 31st July 2010
4.2
Company Name Total SIP Lump sum
4.5
4
% of Net Assets Amount Invested Present Value Present Value
Value Value
3.5 3.2 3.1
2.9
1 year 12,000 12,993 14,588
3 2.7
2.5 3 years 36,000 55,813 53,982
2
5 years 60,000 1,06,309 1,57,614
1.5
1 **SIP Investment of Rs. 1000 per month
0.5
0 Fund Analysis
SBI Bank of Baroda ONGC Titan Industries IRFC Ltd.
Ltd. In debt, scheme has 13% exposure in AAA bonds and 9% in
Top 5 Sectors as on 31st July 2010 sovereign papers.
18.0
16.0
15.7 % of Net Assets
High Credit Quality of Papers takes care of Credit Risk.
14.0 The fund manager generally invests in Growth, Value Blend
12.0
10.0
9.5
8.6 oriented stocks and focuses on large and mid cap stocks.
8.0
6.1
5.3 The scheme has not only outperformed its Benchmark since
6.0
4.0 Inception, but also its peer group schemes in this category.
2.0
0.0
This fund has the lowest expense ratio compared to its peers.
Ideal for Investors
Banks Oil & Gas Sovereign Pharma FIs
Performance Analysis (% Returns)
45 42.1
Investment Horizon: Long Term
% of Net Assest
40 Risk Appetite: Moderate
35 31.6
30
23.0 22.1
25
20 17.2
15.7
13.6 14.1
15 12.4
8.2
10
5
0
1 year 2 years 3 years 5 years Since Inception
HDFC Prudence Fund - Growth Crisil Balanced Fund Index
Note: Returns are as on 6th September, 2010 on CAGR basis
Disclaimer: Angel Capital & Debt Market Ltd is not responsible for any error or inaccuracy or any losses suffered on account of information contained in this report. Mutual Fund investments are subjected to
market risk. Read the Scheme information document carefully before investing.
For Private Circulation Only | Angel Broking Ltd: BSE Sebi Regn No : INB 010996539 / CDSL Regn No: IN - DP - CDSL - 234 - 2004 / PMS Regn Code: PM/INP00000154 6 Angel Securities Ltd:BSE: INB010994639/INF010994639 NSE: INB230994635/INF230994635 Membership numbers: BSE 028/NSE:09946 8
9. Fund Focus
Mutual Fund Focus | September 9, 2010
Reliance RSF - Balanced - Growth
Scheme Objective Portfolio Attributes (31-Jul-10)
The scheme seeks to generate consistent returns and appreciation Large Cap (%) 45.83
of capital by investing in a mix of securities comprising of equity, Mid Cap (%) 15.89
equity related instruments & fixed income instruments. Small Cap (%) 1.93
Fund at a Glance Equity (%) 67.14
Face Value
Value 10 Debentures (%) 4.78
NAV (6-Sept
Sept-10)
NAV (6-Sept-10) 23.04 Gilt (%) 4.15
52-Week High (23-Aug-10) 23.19
52-W (23-Aug-10) Debt (%) 8.93
52-Week Low (3-Nov-09) 17.21
52-W Low CD/FD 15.29
Fund Category Hybrid Cash 8.63
Type Open Ended
Cash & Equivalent (%) 23.92
Load
Entry Load NIL
Exit Load
Load 1% for redemption within 1 year
Key Ratios
Inv.
Minimum Inv. Rs. 500
Expense Ratio (%) 2.24
Inception Date 8th June 2005
Standard Deviation 0.37
AUM as on 31- Jul-10
31-Jul-10 Rs. 593.71cr
Beta 0.90
Benchmark Index Crisil Balanced Fund Index
Sharpe 0.54
Fund Manger Mr. Amit Tripathy / Mr Omprakash Kuckien
.
Jensen 9.28
Top 5 Holdings as on 31st July 2010 Ratios as on 6th September 2010 on the Basis of 3 years daily rolling return (CAGR)
5.0
% of Net Assets
4.7
4.0 3.6 3.6 3.5
3.3
Investment Analysis** (as on 6th September 2010)
3.0 Company Name Total SIP Lump sum
2.0 Amount Invested Present Value Present Value
Value Value
1.0
1 year 12,000 12,824 14,080
0.0
3 years 36,000 54,385 55,944
SBI ICICI Bank HCL Other Equities 7.17% GOI 5 years 60,000 1,04,368 1,34,588
Ltd. Technologies (2015)
Ltd. **SIP Investment of Rs. 1000 per month
Top 5 Sectors as on 31st July 2010 Fund Analysis
35.0
% of Net Assets
30.0
29.7
In debt, scheme has 5% exposure in AAA bonds, 4% in sovereign
25.0 papers and 15% in P1+
20.0
High Credit Quality of Papers takes care of Credit Risk.
15.0
10.0
8.6 The fund manager generally invests in Growth, Value Blend
6.6 5.9 5.3
5.0 oriented stocks and focuses on large cap stocks.
0.0 It has outperformed its benchmark since inception.
Banks Current Assets Utilities - Gas, Power IT Construction & Infrastructure
Ideal for Investors
Performance Analysis (% Returns)
35 33.2 Investment Horizon: Long Term
30.6
30 Risk Appetite: Moderate
25
19.7 18.0
20 17.3
13.6 15.7
15 14.2
11.6
8.4
10
5
0
1 Year 2 Years 3 Years 5 Years Since Inception
Reliance RSF - Balanced - Growth Crisil Balanced Fund Index
Note: Returns are as on 6th September, 2010 on CAGR basis
Disclaimer: Angel Capital & Debt Market Ltd is not responsible for any error or inaccuracy or any losses suffered on account of information contained in this report. Mutual Fund investments are subjected to
market risk. Read the Scheme information document carefully before investing.
For Private Circulation Only | Angel Broking Ltd: BSE Sebi Regn No : INB 010996539 / CDSL Regn No: IN - DP - CDSL - 234 - 2004 / PMS Regn Code: PM/INP00000154 6 Angel Securities Ltd:BSE: INB010994639/INF010994639 NSE: INB230994635/INF230994635 Membership numbers: BSE 028/NSE:09946 9