1. 4QFY2010 Result Update I Infrastructure
April 30, 2010
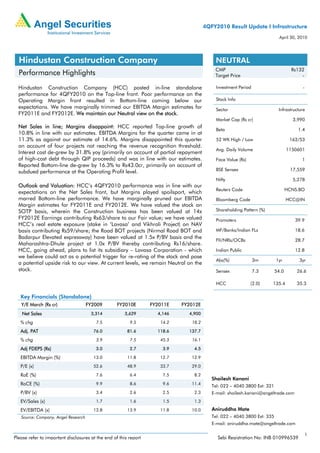
Hindustan Construction Company NEUTRAL
CMP Rs132
Performance Highlights Target Price -
Hindustan Construction Company (HCC) posted in-line standalone Investment Period -
performance for 4QFY2010 on the Top-line front. Poor performance on the
Operating Margin front resulted in Bottom-line coming below our Stock Info
expectations. We have marginally trimmed our EBITDA Margin estimates for Sector Infrastructure
FY2011E and FY2012E. We maintain our Neutral view on the stock.
Market Cap (Rs cr) 3,990
Net Sales in line; Margins disappoint: HCC reported Top-line growth of
Beta 1.4
10.8% in line with our estimates. EBITDA Margins for the quarter came in at
11.3% as against our estimate of 14.6%. Margins disappointed this quarter 52 WK High / Low 162/53
on account of four projects not reaching the revenue recognition threshold.
Avg. Daily Volume 1150601
Interest cost de-grew by 31.8% yoy (primarily on account of partial repayment
of high-cost debt through QIP proceeds) and was in line with our estimates. Face Value (Rs) 1
Reported Bottom-line de-grew by 16.3% to Rs43.0cr, primarily on account of
subdued performance at the Operating Profit level. BSE Sensex 17,559
Nifty 5,278
Outlook and Valuation: HCC’s 4QFY2010 performance was in line with our
Reuters Code HCNS.BO
expectations on the Net Sales front, but Margins played spoilsport, which
marred Bottom-line performance. We have marginally pruned our EBITDA Bloomberg Code HCC@IN
Margin estimates for FY2011E and FY2012E. We have valued the stock on
SOTP basis, wherein the Construction business has been valued at 14x Shareholding Pattern (%)
FY2012E Earnings contributing Rs63/share to our Fair value; we have valued Promoters 39.9
HCC’s real estate exposure (stake in ‘Lavasa’ and Vikhroli Project) on NAV
basis contributing Rs59/share; the Road BOT projects (Nirmal Road BOT and MF/Banks/Indian FLs 18.6
Badarpur Elevated expressway) have been valued at 1.5x P/BV basis and the
FII/NRIs/OCBs 28.7
Maharashtra-Dhule project at 1.0x P/BV thereby contributing Rs16/share.
HCC, going ahead, plans to list its subsidiary – Lavasa Corporation - which Indian Public 12.8
we believe could act as a potential trigger for re-rating of the stock and pose
Abs(%) 3m 1yr 3yr
a potential upside risk to our view. At current levels, we remain Neutral on the
stock. Sensex 7.3 54.0 26.6
HCC (2.0) 135.4 35.3
Key Financials (Standalone)
Y/E March (Rs cr) FY2009 FY2010E FY2011E FY2012E
Net Sales 3,314 3,629 4,146 4,900
% chg 7.5 9.5 14.2 18.2
Adj. PAT 76.0 81.6 118.6 137.7
% chg 3.9 7.5 45.3 16.1
Adj FDEPS (Rs) 3.0 2.7 3.9 4.5
EBITDA Margin (%) 13.0 11.8 12.7 12.9
P/E (x) 52.6 48.9 33.7 29.0
RoE (%) 7.6 6.4 7.5 8.2
Shailesh Kanani
RoCE (%) 9.9 8.6 9.6 11.4
Tel: 022 – 4040 3800 Ext: 321
P/BV (x) 3.4 2.6 2.5 2.3 E-mail: shailesh.kanani@angeltrade.com
EV/Sales (x) 1.7 1.6 1.5 1.3
EV/EBITDA (x) 12.8 13.9 11.8 10.0 Aniruddha Mate
Source: Company, Angel Research Tel: 022 – 4040 3800 Ext: 335
E-mail: aniruddha.mate@angeltrade.com
1
Please refer to important disclosures at the end of this report Sebi Registration No: INB 010996539
2. HCC I 4QFY2010 Result Update
Exhibit 1: 4QFY2010 Performance (Standalone)
Y/E March (Rs cr) 4QFY10 4QFY09 %chg FY10 FY09 % chg
Net Sales 1,085 979.7 10.8 3,629 3,314 9.5
Total Expenditure 962.0 829.0 16.0 3,201 2,882 11.1
Operating Profit 123.0 150.6 (18.3) 427.9 431.4 (0.8)
OPM (%) 11.3 15.4 (410bp) 11.8 13.0 (120bp)
Interest 44.3 65.0 (31.8) 205.2 210.1 (2.3)
Depreciation 20.1 30.4 (33.8) 113.9 115.2 (1.1)
Non Operating Income 4.2 24.2 (82.7) 13.0 58.8 (77.9)
Non recurring items 0.0 0.0 - 0.0 0.0 -
Profit Before Tax 62.8 79.4 (21.0) 121.8 164.5 (26.2)
Tax 19.8 28.1 (29.4) 40.4 39.2 3.1
Reported PAT 43.0 51.4 (16.3) 81.4 125.8 (35.3)
PAT (%) 4.0 5.2 (120bp) 2.2 3.8 (160bp)
Reported EPS (Rs) 1.4 2.0 (29.3) 2.8 4.9 (45.3)
Source: Company, Angel Research
Order Book position
HCC’s outstanding Order Book position, as of 4QFY2010, stood at Rs16,870cr
(excluding the disputed order), up 20% yoy. The company is L1 for orders worth
Rs4,390cr. The Order Book composition continues to be dominated by the
high-gestation Hydro Power projects followed by Water Supply and Irrigation,
Transportation and Nuclear related works. Share of the Irrigation projects from the
State of Andhra Pradesh stands at 18% of the Order Backlog as against 26% last
year end.
‘Lavasa’ Update
Lavasa contributed Rs143cr and Rs41cr, on the Top-line and Bottom-line front
respectively for 4QFY2010. As of date, ‘Lavasa’ has secured investments to the tune
of Rs1,056cr, for 10.4% equity stake
April 30, 2010 2
3. HCC I 4QFY2010 Result Update
Outlook and Valuation
We see increasing stress being laid by management on projects in the Hydro Power
and Water space, with a simultaneous reduction in proportion of Orders coming
from the relatively low-Margin Transportation Sector. Also, HCC is foraying into the
metal space, along with building construction with its recent acquisition of 66% stake
in Karl Steiner AG. We believe that this changing portfolio mix would result in
Margin improvement, going ahead, albeit at a relatively low growth on the Top-line
front, as these projects have high gestation periods and are plagued by unforeseen
natural hindrances. We expect HCC to register Top-line CAGR of 16.2% over
FY2010-12E. On the Bottom-line front, we expect it o register CAGR of 29.9% over
the mentioned period.
HCC, going ahead, plans to list its subsidiary – Lavasa Corporation - which we
believe could act as a potential trigger for re-rating of the HCC’s stock and pose a
potential upside risk to our view. At Rs132, we believe that much of the growth has
been factored in the stock price, and there exists little upside hereon. Hence, we
maintain our Neutral view on the stock.
April 30, 2010 3
4. HCC I 4QFY2010 Result Update
Profit & Loss Statement (Standalone) (Rs cr)
Y/E March FY2007 FY2008 FY2009 FY2010E FY2011E FY2012E
Net Sales 2,358 3,083 3,314 3,629 4,146 4,900
Other operating income - - - - - -
Total operating income 2,358 3,083 3,314 3,629 4,146 4,900
% chg 18.7 30.8 7.5 9.5 14.2 18.2
Total Expenditure 2,142 2,716 2,882 3,201 3,620 4,268
Net Raw Materials 741 971 1,236 1,261 1,435 1,656
Other Mfg costs 1,193 1,448 1,271 1,602 1,853 2,215
Personnel 209 297 375 290 332 397
Other - - - - - -
EBITDA 215 367 431 428 527 632
% chg 17.6 70.3 17.7 (0.8) 23.1 20.1
(% of Net Sales) 9.1 11.9 13.0 11.8 12.7 12.9
Depreciation& Amortisation 80 96 115 114 142 147
EBIT 136 270 316 314 385 486
% chg 5.7 99.5 16.9 (0.7) 22.5 26.3
(% of Net Sales) 5.8 8.8 9.5 8.7 9.3 9.9
Interest & other Charges 62 152 211 205 220 295
Other Income 11 2 9 13 13 15
(% of PBT) 11.3 1.9 8.2 10.7 7.1 7.2
Share in profit of Associates 9 (0) (0) (0) (0) -
Recurring PBT 93 120 115 122 177 205
% chg 1.1 28.8 (4.3) 5.8 45.3 16.0
Extraordinary Expense/(Inc.) (18) 36 49 - 0 -
PBT (reported) 75 157 165 122 177 205
Tax 39 47 39 40 58 68
(% of PBT) 41.3 39.2 34.0 33.0 33.0 33.0
PAT (reported) 37 110 125 82 119 138
Share of earnings of associate - - - - - -
Less: Minority interest (MI) - - - - - -
Prior period items - - - - - -
PAT after MI (reported) 37 110 125 82 119 138
ADJ. PAT 55 73 76 82 119 138
% chg (29.0) 33.3 3.9 7.5 45.3 16.1
(% of Net Sales) 2.3 2.4 2.3 2.2 2.9 2.8
Basic EPS (Rs) 2.1 2.9 3.0 2.7 3.9 4.5
Fully Diluted EPS (Rs) 1.8 2.4 2.5 2.7 3.9 4.5
% chg (29.3) 33.3 3.9 7.5 45.3 16.1
April 30, 2010 4
5. HCC I 4QFY2010 Result Update
Balance Sheet (Standalone) (Rs cr)
Y/E March FY2007 FY2008 FY2009 FY2010E FY2011E FY2012E
SOURCES OF FUNDS
Equity Share Capital 25.6 25.6 25.6 30.3 30.3 30.3
Preference Capital - - - - - -
Reserves& Surplus 878 978 979 1,504 1,591 1,697
Shareholders Funds 904 1,004 1,005 1,535 1,622 1,727
Minority Interest - - - - - -
Total Loans 1,551 1,845 2,322 2,180 2,412 2,549
Deferred Tax Liability 85.5 113.3 113.2 113.2 113.2 113.2
Total Liabilities 2,541 2,962 3,440 3,828 4,146 4,390
APPLICATION OF FUNDS
Gross Block 1,101 1,410 1,683 1,847 2,027 2,212
Less: Acc. Depreciation 355.0 456.6 554.7 668.6 810.6 957.2
Net Block 746 953 1,128 1,178 1,216 1,255
Capital Work-in-Progress 151.3 67.5 46.4 55.4 63.2 60.2
Goodwill - - - - - -
Investments 228.6 295.5 365.5 455.0 446.2 468.3
Current Assets 2,306 2,710 3,467 3,782 4,177 4,538
Cash 208.4 264.4 153.9 207.5 211.7 221.3
Loans & Advances 347.6 295.4 528.4 544.4 559.7 539.0
Other 1,750 2,150 2,785 3,030 3,405 3,778
Current liabilities 892 1,064 1,568 1,643 1,756 1,932
Net Current Assets 1,415 1,646 1,900 2,139 2,421 2,606
Misc. Exp. not written off - - - - - -
Total Assets 2,541 2,962 3,440 3,828 4,146 4,390
Cash Flow Statement (Standalone) (Rs cr)
Y/E March FY2007 FY2008 FY2009 FY2010E FY2011E FY2012E
Profit Before Tax 75.3 156.8 164.5 121.8 177.2 205.5
Depreciation 79.7 96.2 115.2 113.9 142.0 146.6
Change in Working Capital 784.8 175.5 364.1 185.8 277.4 176.0
Less: Other income 10.6 2.3 9.5 13.0 12.5 14.8
Direct taxes paid 38.6 47.2 39.2 40.2 58.5 67.8
Cash Flow from Operations (679.0) 27.9 (133.0) (3.3) (29.1) 93.4
(Inc.)/ Dec. in Fixed Assets (372.2) (224.8) (252.0) (172.8) (188.1) (182.0)
(Inc.)/ Dec. in Investments (102.2) (66.9) (70.0) (89.5) 8.8 (22.1)
(Inc.)/ Dec. in loans and advances - - - - - -
Other income 10.6 2.3 9.5 13.0 12.5 14.8
Cash Flow from Investing (463.8) (289.4) (312.6) (249.3) (166.8) (189.3)
Issue of Equity - - - 480.1 - -
Inc./(Dec.) in loans 260.0 293.8 476.9 (141.9) 231.9 137.4
Dividend Paid (Incl. Tax) (22.5) (24.0) (24.0) (31.9) (31.9) (31.9)
Others 107.6 48.0 (117.9) - - -
Cash Flow from Financing 345.2 317.4 335.1 306.2 200.0 105.5
Inc./(Dec.) in Cash (797.6) 56.0 (110.5) 53.7 4.1 9.7
Opening Cash balances 1,006.0 208.4 264.3 153.9 207.5 211.6
Closing Cash balances 208.4 264.3 153.9 207.5 211.6 221.3
April 30, 2010 5
7. HCC I 4QFY2010 Result Update
Research Team Tel: 022-4040 3800 E-mail: research@angeltrade.com Website: www.angeltrade.com
DISCLAIMER
This document is solely for the personal information of the recipient, and must not be singularly used as the basis of any investment decision. Nothing in this
document should be construed as investment or financial advice. Each recipient of this document should make such investigations as they deem necessary to
arrive at an independent evaluation of an investment in the securities of the companies referred to in this document (including the merits and risks involved),
and should consult their own advisors to determine the merits and risks of such an investment.
Angel Securities Limited, its affiliates, directors, its proprietary trading and investment businesses may, from time to time, make investment decisions that are
inconsistent with or contradictory to the recommendations expressed herein. The views contained in this document are those of the analyst, and the company
may or may not subscribe to all the views expressed within.
Reports based on technical and derivative analysis center on studying charts of a stock's price movement, outstanding positions and trading volume, as
opposed to focusing on a company's fundamentals and, as such, may not match with a report on a company's fundamentals.
The information in this document has been printed on the basis of publicly available information, internal data and other reliable sources believed to be true,
and are for general guidance only. Angel Securities Limited has not independently verified all the information contained within this document. Accordingly,
we cannot testify, nor make any representation or warranty, express or implied, to the accuracy, contents or data contained within this document. While Angel
Securities Limited endeavours to update on a reasonable basis the information discussed in this material, there may be regulatory, compliance, or other
reasons that prevent us from doing so.
This document is being supplied to you solely for your information, and its contents, information or data may not be reproduced, redistributed or passed on,
directly or indirectly.
Angel Securities Limited and its affiliates may seek to provide or have engaged in providing corporate finance, investment banking or other advisory services
in a merger or specific transaction to the companies referred to in this report, as on the date of this report or in the past.
Neither Angel Securities Limited nor its directors, employees and affiliates shall be liable for any loss or damage that may arise from or in connection with the
use of this information.
Note: Please refer to the important `Stock Holding Disclosure' report on the Angel website (Research Section).
Disclosure of Interest Statement Hindustan Construction Company
1. Analyst ownership of the stock No
2. Angel and its Group companies ownership of the stock Yes
3. Angel and its Group companies’ Directors ownership of the stock No
4. Broking relationship with company covered No
Note: We have not considered any Exposure below Rs 1 lakh for Angel and its Group companies.
Address: Acme Plaza, ‘A’ Wing, 3rd Floor, M.V. Road, Opp. Sangam Cinema, Andheri (E), Mumbai - 400 059.
Tel : (022) 3952 4568 / 4040 3800
Angel Broking Ltd: BSE Sebi Regn No : INB 010996539 / CDSL Regn No: IN - DP - CDSL - 234 - 2004 / PMS Regn Code: PM/INP000001546 Angel Securities Ltd:BSE: INB010994639/INF010994639 NSE:
INB230994635/INF230994635 Membership numbers: BSE 028/NSE:09946
Angel Capital & Debt Market Ltd: INB 231279838 / NSE FNO: INF 231279838 / NSE Member code -12798 Angel Commodities Broking (P) Ltd: MCX Member ID: 12685 / FMC Regn No: MCX / TCM /
CORP / 0037 NCDEX : Member ID 00220 / FMC Regn No: NCDEX / TCM / CORP / 0302
April 30, 2010 7