Abortion pills in Jeddah ! +27737758557, cytotec pill riyadh. Saudi Arabia" A...
Dchl ru4 qfy2010-140510
1. 4QFY2010 Result Update I Media
May 14, 2010
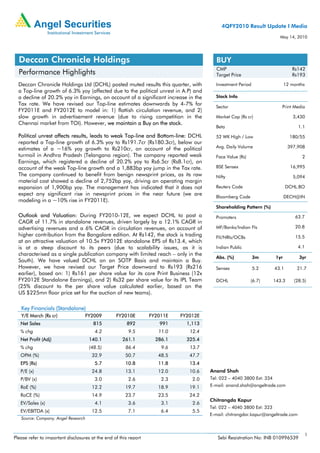
Deccan Chronicle Holdings BUY
CMP Rs142
Performance Highlights Target Price Rs193
Deccan Chronicle Holdings Ltd (DCHL) posted muted results this quarter, with Investment Period 12 months
a Top-line growth of 6.3% yoy (affected due to the political unrest in A.P) and
a decline of 20.2% yoy in Earnings, on account of a significant increase in the Stock Info
Tax rate. We have revised our Top-line estimates downwards by 4-7% for
Sector Print Media
FY2011E and FY2012E to model in: 1) flattish circulation revenue, and 2)
slow growth in advertisement revenue (due to rising competition in the Market Cap (Rs cr) 3,430
Chennai market from TOI). However, we maintain a Buy on the stock.
Beta 1.1
Political unrest affects results, leads to weak Top-line and Bottom-line: DCHL 52 WK High / Low 180/55
reported a Top-line growth of 6.3% yoy to Rs191.7cr (Rs180.3cr), below our
estimates of a ~16% yoy growth to Rs210cr, on account of the political Avg. Daily Volume 397,908
turmoil in Andhra Pradesh (Telangana region). The company reported weak Face Value (Rs) 2
Earnings, which registered a decline of 20.2% yoy to Rs6.5cr (Rs8.1cr), on
account of the weak Top-line growth and a 1,883bp yoy jump in the Tax rate. BSE Sensex 16,995
The company continued to benefit from benign newsprint prices, as its raw Nifty 5,094
material cost showed a decline of 2,752bp yoy, driving an operating margin
expansion of 1,900bp yoy. The management has indicated that it does not Reuters Code DCHL.BO
expect any significant rise in newsprint prices in the near future (we are
Bloomberg Code DECH@IN
modeling in a ~10% rise in FY2011E).
Shareholding Pattern (%)
Outlook and Valuation: During FY2010-12E, we expect DCHL to post a Promoters 63.7
CAGR of 11.7% in standalone revenues, driven largely by a 12.1% CAGR in
advertising revenues and a 6% CAGR in circulation revenues, on account of MF/Banks/Indian FIs 20.8
higher contribution from the Bangalore edition. At Rs142, the stock is trading FII/NRIs/OCBs 15.5
at an attractive valuation of 10.5x FY2012E standalone EPS of Rs13.4, which
is at a steep discount to its peers (due to scalability issues, as it is Indian Public 4.1
characterised as a single publication company with limited reach – only in the
Abs. (%) 3m 1yr 3yr
South). We have valued DCHL on an SOTP Basis and maintain a Buy.
However, we have revised our Target Price downward to Rs193 (Rs216 Sensex 5.2 43.1 21.7
earlier), based on: 1) Rs161 per share value for its core Print Business (12x
FY2012E Standalone Earnings), and 2) Rs32 per share value for its IPL Team DCHL (6.7) 143.3 (28.5)
(25% discount to the per share value calculated earlier, based on the
US $225mn floor price set for the auction of new teams).
Key Financials (Standalone)
Y/E March (Rs cr) FY2009 FY2010E FY2011E FY2012E
Net Sales 815 892 991 1,113
% chg 4.2 9.5 11.0 12.4
Net Profit (Adj) 140.1 261.1 286.1 325.4
% chg (48.5) 86.4 9.6 13.7
OPM (%) 32.9 50.7 48.5 47.7
EPS (Rs) 5.7 10.8 11.8 13.4
P/E (x) 24.8 13.1 12.0 10.6 Anand Shah
P/BV (x) 3.0 2.6 2.3 2.0 Tel: 022 – 4040 3800 Ext: 334
RoE (%) 12.2 19.7 18.9 19.1 E-mail: anand.shah@angeltrade.com
RoCE (%) 14.9 23.7 23.5 24.2
Chitrangda Kapur
EV/Sales (x) 4.1 3.6 3.1 2.6
Tel: 022 – 4040 3800 Ext: 323
EV/EBITDA (x) 12.5 7.1 6.4 5.5
E-mail: chitrangdar.kapur@angeltrade.com
Source: Company, Angel Research
1
Please refer to important disclosures at the end of this report Sebi Registration No: INB 010996539
2. DCHL I 4QFY2010 Result Update
Exhibit 1: Quarterly Performance Update (Standalone)
Y/E March (Rs cr) 4QFY10 4QFY09 % chg FY10 FY09 % chg
Net Sales 191.7 180.3 6.3 892.5 814.9 9.5
Cost of Production 74.7 119.9 (37.7) 317.1 442.7 (28.4)
(% of sales) 39.0 66.5 35.5 54.3
Staff cost 18.1 12.5 44.0 65.5 49.4 32.7
(% of sales) 9.4 7.0 7.3 6.1
Other expenditure 17.6 5.6 212.6 57.3 54.6 5.0
(% of sales) 9.2 3.1 6.4 6.7
Total Expenditure 110.4 138.1 (20.1) 440.0 546.7 (19.5)
Operating Profit 81.3 42.2 92.6 452.5 268.2 68.7
OPM (%) 42.4 23.4 50.7 32.9
Interest 11.6 12.3 (5.1) 45.1 70.9 (36.4)
Depreciation 12.6 9.5 32.9 42.9 32.1 33.7
Other Income 7.3 7.7 (4.8) 29.4 42.7 (31.0)
PBT (excl Ext. Items) 64.4 28.2 128.5 394.0 207.9 89.5
Ext Income/(Expenses) - - - -
PBT (incl Ext. Items) 64.4 28.2 128.5 394.0 207.9 89.5
(% of Sales) 33.6 15.6 44.1 25.5
Prov. for Taxation 57.9 20.0 189.0 132.9 67.9 95.8
(% of PBT) 89.9 71.1 33.7 32.6
Recurring PAT 6.5 8.1 (20.2) 261.1 140.1 86.4
PATM (%) 3.4 4.5 29.3 17.2
Reported PAT 6.5 8.1 (20.2) 261.1 140.1 86.4
Equity shares (cr) 24.2 24.5 24.2 24.5
EPS (Rs) 0.3 0.3 (19.4) 10.8 5.7 88.5
Source: Company, Angel Research
Political turmoil in AP affects sales; Top-line below our estimates
Deccan Chronicle Holdings Ltd (DCHL) reported a muted Top-line growth of 6.3%
yoy to Rs191.7cr (Rs180.3cr), below our estimate of Rs210cr (~16% yoy growth),
affected by the political turmoil in Andhra Pradesh (Telangana region). The company
reported a ~6% yoy growth in advertisement revenue to Rs177cr (Rs166cr) and a
flattish growth in circulation revenue to Rs15cr (Rs14cr).
Gross Margin expansion continues; Earnings decline due to higher Tax rate
On the Operating front, DCHL registered a significant Margin expansion of 1,900bp
yoy, driving a 92.6% yoy growth in EBITDA to Rs81.3cr (Rs42.2cr). The company
continued to benefit from benign newsprint prices (DCHL’s average newsprint cost
stands at ~US $600 per ton) and rupee appreciation, with the raw material cost this
quarter showing a decline of 2,752bp yoy to Rs74.7cr (Rs119.9cr). The
management has indicated that it does not expect any significant rise in newsprint
prices in the near future (We are modeling in a ~10% rise in FY2011E). However,
the staff costs and other expenditure for the company increased by 247bp yoy and
605bp yoy (low base effect) to Rs18.1cr and Rs17.6cr, respectively, limiting any
further Margin expansion.
DCHL’s reported weak Earnings for the quarter (on a standalone basis), which
registered a decline of 20.2% yoy to Rs6.5cr (Rs8.1cr), on account of the weak Top-
line growth, a 1,883bp yoy jump in the Tax rate to 89.9% (71.1%), and a 32.9% yoy
increase in depreciation to Rs12.6cr (Rs9.5cr). The company reported flattish other
income on an absolute basis, and continued to benefit from lower interest costs
(declined 5.1% yoy), as it repaid its debts.
May 14, 2010 2
3. DCHL I 4QFY2010 Result Update
Outlook and Valuation
After the 4QFY2010 results, we have revised our Top-line estimates downward by
4-7% for FY2011E and FY2012E to model in: 1) flattish circulation revenue, and 2)
slow growth in advertisement revenue (due to rising competition in the Chennai
market from TOI).
During FY2010-12E, we expect DCHL to post a CAGR of 11.7% in its standalone
revenues, driven largely by a 12.1% CAGR in advertising revenues and a 6% CAGR
in circulation revenues, on account of a higher contribution from the Bangalore
edition. In terms of Earnings, we have factored an 11.6% CAGR during the period,
driven largely by Top-line growth, as we expect Margins to dip marginally as
newsprint prices harden.
Exhibit 2: Revision in Estimates
Old Estimate New Estimate % chg
(Rs cr) FY2011E FY2012E FY2011E FY2012E FY2011E FY2012E
Revenue 1,038 1,192 991 1,113 (4.5) (6.6)
OPM (%) 48.1 48.0 48.5 47.7 46bp (24bp)
EPS 12.4 14.7 11.8 13.4 (5.5) (8.9)
Source: Company, Angel Research
Based on the floor price of US $225mn for the recent, new team auctions (Kochi
team and Pune team), we had calculated Rs43 as the per share value for DCHL’s IPL
team. However, on account of the uncertainty arising from the recent team auctions,
as covered in certain media reports, we have adopted a cautious approach, giving a
25% discount to our earlier per share price. Thus, we have arrived at a value of Rs32
per share for DCHL’s IPL team.
At Rs142, the stock is trading at an attractive valuation of 10.6x FY2012E
standalone EPS of Rs13.4, which is at a steep discount to its peers (due to scalability
issues, as it is characterised as a single publication company with limited reach –
only in the South). Nonetheless, the company’s better balance sheet, rising
Profitability in the IPL (possibility of unlocking), and successful foray into the
Bangalore print market instill confidence.
We value DCHL on an SOTP Basis and maintain a Buy. However, we have revised
our Target Price downward to Rs193 (Rs216 earlier), based on: 1) Rs161 per share
value for its core Print Business (12x FY2012E Standalone Earnings), and 2) Rs32
per share value for its IPL Team (25% discount to the per share value calculated
earlier, based on the US $225mn floor price set for the auction of new teams).
Moreover, there exist upside risks to our valuation, on account of the following:
• Higher Gate/Sponsorship Revenues: Addition of two new franchises would lead
to an increase in the number of matches, from 59 to 94 matches.
• Revision in Media Telecast Rights: After the auction, we expect the IPL to re-work
media telecast rights with Sony (to factor in the higher number of matches).
May 14, 2010 3
7. DCHL I 4QFY2010 Result Update
Research Team Tel: 022- 4040 3800 E-mail: research@angeltrade.com Website: www.angeltrade.com
DISCLAIMER
This document is solely for the personal information of the recipient, and must not be singularly used as the basis of any investment decision. Nothing in this
document should be construed as investment or financial advice. Each recipient of this document should make such investigations as they deem necessary to
arrive at an independent evaluation of an investment in the securities of the companies referred to in this document (including the merits and risks involved),
and should consult their own advisors to determine the merits and risks of such an investment.
Angel Securities Limited, its affiliates, directors, its proprietary trading and investment businesses may, from time to time, make investment decisions that are
inconsistent with or contradictory to the recommendations expressed herein. The views contained in this document are those of the analyst, and the company
may or may not subscribe to all the views expressed within.
Reports based on technical and derivative analysis center on studying charts of a stock's price movement, outstanding positions and trading volume, as
opposed to focusing on a company's fundamentals and, as such, may not match with a report on a company's fundamentals.
The information in this document has been printed on the basis of publicly available information, internal data and other reliable source believed to be true,
and is for general guidance only. Angel Securities Limited has not independently verified all the information contained within this document. Accordingly, we
cannot testify, nor make any representation or warranty, express or implied, to the accuracy, contents or data contained within this document. While Angel
Securities Limited endeavours to update on a reasonable basis the information discussed in this material, there may be regulatory, compliance, or other
reasons that prevent us from doing so.
This document is being supplied to you solely for your information, and its contents, information or data may not be reproduced, redistributed or passed on,
directly or indirectly.
Angel Securities Limited and its affiliates may seek to provide or have engaged in providing corporate finance, investment banking or other advisory services
in a merger or specific transaction to the companies referred to in this report, as on the date of this report or in the past.
Neither Angel Securities Limited, nor its directors, employees or affiliates shall be liable for any loss or damage that may arise from or in connection with the
use of this information.
Note: Please refer to the important `Stock Holding Disclosure' report on the Angel website (Research Section).
Disclosure of Interest Statement DCHL
1. Analyst ownership of the stock No
2. Angel and its Group companies ownership of the stock No
3. Angel and its Group companies’ Directors ownership of the stock No
4. Broking relationship with company covered No
Note: We have not considered any Exposure below Rs 1 lakh for Angel and its Group companies.
Address: Acme Plaza, ‘A’ Wing, 3rd Floor, M.V. Road, Opp. Sangam Cinema, Andheri (E), Mumbai - 400 059.
Tel : (022) 3952 4568 / 4040 3800
Angel Broking Ltd: BSE Sebi Regn No : INB 010996539 / CDSL Regn No: IN - DP - CDSL - 234 - 2004 / PMS Regn Code: PM/INP000001546 Angel Securities Ltd:BSE: INB010994639/INF010994639 NSE:
INB230994635/INF230994635 Membership numbers: BSE 028/NSE:09946
Angel Capital & Debt Market Ltd: INB 231279838 / NSE FNO: INF 231279838 / NSE Member code -12798 Angel Commodities Broking (P) Ltd: MCX Member ID: 12685 / FMC Regn No: MCX / TCM /
CORP / 0037 NCDEX : Member ID 00220 / FMC Regn No: NCDEX / TCM / CORP / 0302
May 14, 2010 7