1. Weekly Review
June 12, 2010
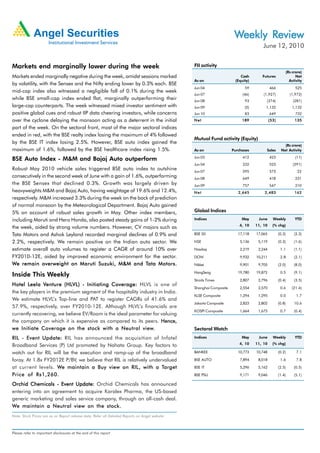
Markets end marginally lower during the week FII activity
(Rs crore)
Markets ended marginally negative during the week, amidst sessions marked Cash Futures Net
As on (Equity) Activity
by volatility, with the Sensex and the Nifty ending lower by 0.3% each. BSE
Jun 04 59 466 525
mid-cap index also witnessed a negligible fall of 0.1% during the week
Jun 07 (46) (1,927) (1,972)
while BSE small-cap index ended flat, marginally outperforming their Jun 08 93 (374) (281)
large-cap counterparts. The week witnessed mixed investor sentiment with Jun 09 (0) 1,132 1,132
positive global cues and robust IIP data cheering investors, while concerns Jun 10 83 649 732
over the cyclone delaying the monsoon acting as a deterrent in the initial Net 189 (53) 135
part of the week. On the sectoral front, most of the major sectoral indices
ended in red, with the BSE realty index losing the maximum of 4% followed
Mutual Fund activity (Equity)
by the BSE IT index losing 2.5%. However, BSE auto index gained the
(Rs crore)
maximum of 1.6%, followed by the BSE healthcare index rising 1.5%. As on Purchases Sales Net Activity
BSE Auto Index - M&M and Bajaj Auto outperform Jun 03 412 423 (11)
Jun 04 232 523 (291)
Robust May 2010 vehicle sales triggered BSE auto index to outshine Jun 07 595 573 22
consecutively in the second week of June with a gain of 1.6%, outperforming Jun 08 649 418 231
the BSE Sensex that declined 0.3%. Growth was largely driven by Jun 09 757 547 210
heavyweights M&M and Bajaj Auto, having weightage of 19.6% and 12.4%, Net 2,645 2,483 162
respectively. M&M increased 3.3% during the week on the back of prediction
of normal monsoon by the Meteorological Department. Bajaj Auto gained
5% on account of robust sales growth in May. Other index members, Global Indices
including Maruti and Hero Honda, also posted steady gains of 1-2% during Indices May June Weekly YTD
4, 10 11, 10 (% chg)
the week, aided by strong volume numbers. However, CV majors such as
Tata Motors and Ashok Leyland recorded marginal declines of 0.9% and BSE 30 17,118 17,065 (0.3) (2.3)
2.2%, respectively. We remain positive on the Indian auto sector. We NSE 5,136 5,119 (0.3) (1.6)
estimate overall auto volumes to register a CAGR of around 10% over Nasdaq 2,219 2,244 1.1 (1.1)
FY2010-12E, aided by improved economic environment for the sector. DOW 9,932 10,211 2.8 (2.1)
We remain overweight on Maruti Suzuki, M&M and Tata Motors. Tata Nikkei 9,901 9,705 (2.0) (8.0)
HangSeng 19,780 19,872 0.5 (9.1)
Inside This Weekly
Straits Times 2,807 2,796 (0.4) (3.5)
Hotel Leela Venture (HLVL) - Initiating Coverage: HLVL is one of
Leela Venture (HLVL)
Shanghai Composite 2,554 2,570 0.6 (21.6)
the key players in the premium segment of the hospitality industry in India.
KLSE Composite 1,294 1,295 0.0 1.7
We estimate HLVL’s Top-line and PAT to register CAGRs of 41.6% and
Jakarta Composite 2,823 2,802 (0.8) 10.6
57.9%, respectively, over FY2010-12E. Although HLVL’s financials are
KOSPI Composite 1,664 1,675 0.7 (0.4)
currently recovering, we believe EV/Room is the ideal parameter for valuing
the company on which it is expensive as compared to its peers. Hence,
we Initiate Coverage on the stock with a Neutral view. view. Sectoral Watch
RIL - Event Update: RIL has announced the acquisition of Infotel Indices May June Weekly YTD
4, 10 11, 10 (% chg)
Broadband Services (P) Ltd promoted by Nahata Group. Key factors to
watch out for RIL will be the execution and ramp-up of the broadband BANKEX 10,773 10,748 (0.2) 7.1
foray. At 1.8x FY2012E P/BV, we believe that RIL is relatively undervalued BSE AUTO 7,894 8,018 1.6 7.8
at current levels. We maintain a Buy view on RIL , with a Target
RIL, Target BSE IT 5,296 5,162 (2.5) (0.5)
Price of Rs1,260. BSE PSU 9,171 9,046 (1.4) (5.1)
Orchid Chemicals - Event Update: Orchid Chemicals has announced
entering into an agreement to acquire Karalex Pharma, the US-based
generic marketing and sales service company, through an all-cash deal.
We maintain a Neutral view on the stock.
Note: Stock Prices are as on Report release date; Refer all Detailed Reports on Angel website
Please refer to important disclosures at the end of this report
2. Focus
F undamental F ocus | June 12, 2010
Hotel Leela Venture - Neutral Price - Rs46
Initiating Coverage
Not much room stabilising, the next logical move from hoteliers will be a hike
in the ARRs, resulting in a revival in their financials. The data
Hotel Leela Venture (HLVL) is one of the key players in the
of foreign tourist arrivals (FTAs) in India during December 2009
premium segment of the hospitality industry in India, with
to March 2010 further fortifies our belief of a reversal in the
operations across six locations, and a portfolio of 1,190 owned
trend. The month of December 2009 recorded the highest
rooms. HLVL has expansion plans lined up in two phases, of
number of foreign tourist arrivals (in absolute terms) in the last
which the New Delhi and Chennai properties are expected to
5 years, registering a rise of 21% yoy, while in January 2010,
get operational in FY2011E. With tourist activity (domestic and
February 2010 and March 2010, FTAs rose by 16.4%, 9.9%
foreign) picking up, we expect the industry and, in turn,
and 13% yoy, respectively. We believe that this provides a
hoteliers, to regain their lost glory.
clear indication of the good times that lie ahead for the hoteliers.
Improving industry dynamics to boost HLVL's HLVL's
Although HLVL’s financials are currently on the verge of
performance: HLVL has started witnessing the positive effects
recovery, we believe that EV/Room is the ideal parameter for
of the changing industry dynamics. Its Bangalore and Mumbai
valuing the company, considering the debt on its books. At the
properties (contributing ~62% to revenues in FY2010)
CMP HLVL trades at an FY2012E EV/Room of Rs2.2cr, which
,
witnessed Occupancy Rates (ORs) of 70-80% in 4QFY2010,
is higher than the company's replacement cost of ~Rs1.8-2cr.
a marked improvement over the 55-65% levels on a yoy
Moreover, at current valuations, HLVL is expensive as
basis. Moreover, we believe the improving trend is bolstered
compared to its peers. Among the mid-cap hotel players, we
by the firming up of Average Room Rates (ARRs) recently,
favour TAJGVK over HLVL, due to its superior financials and
indicating a stout recovery. Hence, we estimate HLVL’s
robust growth outlook. Hence, considering the
Top-line, EBIDTA and PAT to witness a CAGR of 41.6%, 69.5%
risk-reward,
risk-reward, we Initiate Coverage on the stock with a
and 57.9% respectively, over FY2010-12E.
Neutral view.
view.
New property additions to diversify geographical risks:
To diversify location risks and tap new geographies, HLVL is
Key Financials
spreading its presence in India. We expect significant delta in
Y/E March (Rs cr) FY2009 FY2010 FY2011E FY2012E
terms of diversification, both geographically and financially, to
take effect from 2HFY2011E onwards, as its properties in Delhi Net Sales 470 436 632 874
and in Chennai get operational. These properties, along with % chg (12.4) (7.2) 44.9 38.3
the recently opened ones in Gurgaon and Udaipur, would Adj. Net Profit 38.8 41.0 75.0 102.3
enable HLVL in toning down its revenue dependence on
% chg (62.7) 5.9 82.7 36.4
Mumbai and Bangalore (combined) to ~40% in FY2012E.
EPS (Rs) 1.0 1.1 2.0 2.7
Outlook and Valuation
EBITDA Margin (%) 30.8 29.0 40.3 41.6
The global economic meltdown, along with the terrorist attacks
P/E (x) 44.8 42.4 23.2 17.0
in India, affected the hospitality industry, and the hotel players
ROE (%)# 5.5 5.7 9.8 12.2
were facing the heat through lower ARRs and ORs till
2QFY2010. However, as the business sentiment gathered ROCE (%)# 2.8 1.8 5.3 8.3
steam, with the overall decent performance by India Inc, P/BV (x)# 2.5 2.4 2.2 2.0
coupled with the tourist season that commenced in 3QFY2010, EV/Room (Rs cr) 3.9 3.5 2.2 2.2
the dynamics of the industry seem to be changing. ORs, which
EV/Sales (x) 8.8 9.5 6.4 4.6
were hovering ~60-62% levels in major cities in India in
2QFY2010, have already surpassed 70% levels in 3QFY2010 EV/EBITDA (x) 28.7 32.9 16.0 11.1
and have sustained those leves in 4QFY2010. With ORs Source: Company, Angel Research, Price as on June 11, 2010;
Note: # Excluding revaluation reserves
Research Analyst - Viraj Nadkarni
For Private Circulation Only | Angel Broking Ltd: BSE Sebi Regn No : INB 010996539 / CDSL Regn No: IN - DP - CDSL - 234 - 2004 / PMS Regn Code: PM/INP00000154 6 Angel Securities Ltd:BSE: INB010994639/INF010994639 NSE: INB230994635/INF230994635 Membership numbers: BSE 028/NSE:09946 2
3. Focus
F undamental F ocus | June 12, 2010
Reliance Industries - Buy Price - Rs1,046
Target Price Rs1,260
Event Update
Expanding horizons providers, infrastructure providers, application developers,
device manufacturers and others to leapfrog India to the 4G
Details of the deal: RIL has announced acquisition of Infotel
revolution. Wi-max technology has been developed about four
Broadband Services (P) Ltd promoted by the Nahata Group.
years back and is still under evolution with just 6.5mn
Infotel has emerged a successful bidder in all the 22 circles of
subscribers across the globe. Wi-max technology is likely to
the auction for Broadband Wireless Access (BWA) Spectrum
be the next big thing in the high speed internet saga on account
conducted by the DoT. Infotel is now the only pan-India Wimax
of lower cost of deployment as it covers an area of 2 to10km.
license holder owing to which it will emerge as the leader in
the next generation broadband services in the country. RIL will Impact analysis: We believe that the venture would prove
invest around Rs4,800cr by way of subscription to fresh equity to be long gestation investment on account of low internet
capital at par to be issued by Infotel. Post this investment, RIL penetration levels and high time taken (around 2 years) in
will own 95% of the equity and Infotel will become its subsidiary. rollout of the technology on a pan-India basis. This coupled
Infotel has to pay Rs12,848cr for the recent BWA licence. We with upfront payment of the spectrum fees could result in the
believe funding of the same is likely to be done by the equity deal being marginally dilutive for RIL on the Earnings front
infusion by RIL, while the balance would be funded through debt. (2-3%) over the next couple of years. Thus, RIL will take a
long time to reap the benefits of the venture and impact of the
Rationale for the deal: RIL's consolidated position in core
same could not be gauged at the current juncture. On account
refining and petrochemical along with its failed bid for
of lack of clarity, currently we have not changed our estimates.
Lyondellbasell has led to its foray into an unrelated business
space. We estimate RIL to generate huge cash flows going Outlook and Valuation
ahead and deployment of the same was perceived to be a key
The key factors to watch out for RIL will be the execution and
challenge for it. Thus, its entry into the Broadband Internet space
ramp-up of the Broadband foray. At 1.8x FY2012E P/BV, we
opens up newer growth avenues for the company.
believe that RIL is relatively undervalued at current levels. We
Our Take - Strategic move: The total broadband subscribers
Take RIL, Target Price
maintain a Buy on RIL , with a Target Price of Rs1,260,
in India stood at around 9mn at the end of March 2010. translating into an upside of 20.4% from current levels.
Currently, the Broadband industry is dominated by wired internet Key Financials
services. However the share of the wireless services is expected
Y/E March (Rs cr) FY2009 FY2010 FY2011E FY2012E
to see growth post a pan country roll-out of Wi-max and on
account of reduction in cost of customer premise equipment Net Sales 151,224 203,740 234,754 243,596
(CPE). It may be noted here that RIL's previous foray into the % chg 10.3 34.7 15.2 3.8
Telecom space via. Reliance Infocomm proved to be a game Net Profit 14,969 15,898 22,743 28,550
changer, as it subsidised equipment cost and tariffs were also
% chg (23.3) 6.2 43.1 25.5
reduced substantially (with removal of incoming charges). Thus,
EPS (Rs) 45.8 48.6 69.5 87.3
if the BWA is successful, RIL is likely to benefit from first mover's
advantage. India has witnessed substantial growth in the mobile EBITDA Margin (%) 15.5 15.2 17.6 20.0
subscriber base over the last decade, which provides a ready P/E (x) 22.9 14.0 15.0 12.0
platform for offering various data services, which is currently RoE (%) 14.5 11.9 14.7 16.1
at a nascent stage. On account of increase in smart phone
RoCE (%) 8.4 8.0 11.4 13.8
penetration (Wi-Fi enabled), the company would be able to
tap the huge growth opportunity in the mobile internet space. P/BV (x) 2.8 2.4 2.1 1.8
RIL plans to create world class state- of-the-art technology using EV/ Sales (x) 2.6 1.8 1.5 1.4
an asset light strategy. RIL will forge several strategic relations EV/ EBITDA (x) 16.9 12.2 8.7 7.0
with a host of leading global technology players, service Source: Company, Angel Research, Price as on June 11, 2010
Research Analyst - Deepak Pareek/Rahul Jain
For Private Circulation Only | Angel Broking Ltd: BSE Sebi Regn No : INB 010996539 / CDSL Regn No: IN - DP - CDSL - 234 - 2004 / PMS Regn Code: PM/INP00000154 6 Angel Securities Ltd:BSE: INB010994639/INF010994639 NSE: INB230994635/INF230994635 Membership numbers: BSE 028/NSE:09946 3
4. Focus
F undamental F ocus | June 12, 2010
Orchid Chemicals - Neutral Price - Rs151
Event Update
Building blocks again... write offs to the tune of Rs235cr. Even post the write offs on
the Debtors' front, receivable days at 180 continues to be on
Orchid Chemicals (Orchid) has announced entering into an
the higher side. On the Debt front, even though the company
agreement to acquire the US-based generic marketing and
repaid Debt to the tune of Rs1,400cr in 4QFY2010, its Debt/
sales service company, Karalex Pharma, through an all-cash
Equity ratio continues to higher than the Industry average at
deal. Though the company has not disclosed the purchase
1.1x as on FY2010. However, on the positive side, the company
consideration, it is estimated to be in the range of 2-2.5x
has commenced supply of Tazo+Pip API to Hospira and expects
Price/Sales. Orchid proposes to fund the deal through internal
to begin supply of the Penems API to Hospira and one more
accruals, as it has residual cash of Rs300cr from the Hospira
player by the end of 1QFY2011E.
deal. On a conservative basis, we expect the deal to contribute
US $10mn in FY2011E and US $15mn in FY2012E to Orchid's We have marginally tweaked our Sales estimates to factor in
Top-line, with EBITDA Margins to be in line with current levels the acquisition of Karalex Pharma. We estimate Net Sales to
of 17-18%. With this acquisition, Orchid will get front-end increase by 4.0-4.3%, while Net Profit is expected to increase
presence in the US and reach its customers directly, which by 10-11% over FY2011-12E.
would increase overall Margins of its US generic business
We expect the company to register 12.8% CAGR in Net Sales
contributing 13% of FY2011E Sales. However, concerns on
to Rs1,652cr over FY2010-12E and EPS to touch Rs15.7 in
high Debtors (180 days) and low Return Ratios (9%) persist.
FY2012E. On the bourses, during the last six months, the stock
About Karalex Pharma: A generic marketing and sales witnessed a sharp correction of 29% and is currently trading
services company, Karalex is focused exclusively on the US at fair valuations of 15.2x and 9.6x FY2011E and FY2012E
Healthcare market. The company formed in 2007 has Earnings, respectively. Hence, we maintain a Neutral on
launched over 100 generic pharmaceutical products with a Fair Value
the stock, with a F air Value of Rs157.
combined value in excess of US $1bn. The company has
recorded Top-line of US $10mn along with double-digit
Operating Margins.
Benefits of the deal: Through this deal, Orchid will establish Key Financials (Consolidated)
its front-end presence in the largest pharmaceutical market Y/E March (Rs cr) FY2009 FY2010 FY2011E FY2012E
globally, USA. Though the company has not disclosed the Net Sales 1,260 1,299 1,220 1,652
purchase consideration, it is estimated in the range of 2-2.5x
% chg 0.5 3.1 (6.0) 35.3
Price/Sales. Orchid proposes to fund the deal through internal
Recurring Net Profit (33.0) (553.6) 70.1 110.2
accruals, as it has residual cash of Rs300cr from the Hospira
deal. Further, Orchid plans to launch 15 generic products in % chg - - - 57.2
the US through Karalex Pharma over the next few years. On Recurring EPS(Rs) - - 10.0 15.7
a conservative basis, we expect the deal to contribute US EBITDA Margin (%) 11.9 - 17.2 18.0
$10mn in FY2011E and US $15mn in FY2012E to Orchid's
P/E (x) - - 15.2 9.6
Top-line, while EBITDA Margins are expected to be in line with
current levels of 17-18%. The acquisition would increase RoE (%) - - 5.6 9.4
overall Margins of the company's US generic business RoCE (%) 0.5 - 3.8 6.8
contributing 13% to FY2011E Sales. P/BV (x) 1.9 0.9 0.8 1.0
Outlook and Valuation EV/Sales (x) 2.9 1.6 1.7 1.4
Orchid's FY2010 results were disappointing especially on the EV/EBITDA (x) 24.2 - 10.1 7.9
Operating front, which was marred by Inventory and Debtor Source: Company, Angel Research, Price as on June 10, 2010
Research Analyst - Sarabjit Kour Nangra/Sushant Dalmia
For Private Circulation Only | Angel Broking Ltd: BSE Sebi Regn No : INB 010996539 / CDSL Regn No: IN - DP - CDSL - 234 - 2004 / PMS Regn Code: PM/INP00000154 6 Angel Securities Ltd:BSE: INB010994639/INF010994639 NSE: INB230994635/INF230994635 Membership numbers: BSE 028/NSE:09946 4
5. Technical Picks | June 12, 2010
Undertone still positive - Testing time ahead for Bulls
Sensex (17065) / Nifty (5119)
In our previous Weekly report, we had mentioned that as long Exhibit 1: Nifty Daily chart
as the higher bottom levels of 16550 / 4960 holds, we were
of the opinion that the indices would head higher and test Inverse Head and Shoulder
17350 - 17500 / 5200 -5250 levels. The initial part of the
pattern in making
week witnessed selling due to weak global cues from where
the markets recovered lost ground to close with a marginal
loss of 0.3% vis-à-vis the previous week.
Pattern Formation
On the Daily chart, we are now witnessing an "Inverse Head
and Shoulder" in the making which would be confirmed once Source: Falcon
the indices close above17150 / 5150 levels (Refer Exhibit 1).
On the Weekly chart, we reiterate our view that prices are Exhibit 2: Nifty Weekly chart
still trading in an upward sloping channel and are headed in
upward direction (Refer Exhibit 2).
Future Outlook
Upward sloping channel
We maintain our view that as long as the indices hold the
higher bottom of 16550 / 4960 level, we are of the opinion
that the indices would trade with positive bias for the coming
week. The immediate resistance for the indices is at 17150 /
5150 levels. Once that is crossed, on closing basis, we could
see a breakout of an "Inverse Head and Shoulder" pattern on Source: Falcon
the Daily chart that would lead the indices to test 17500 -
17670 / 5250 - 5300. On the flip side if the indices break
16544 / 4960 levels on the downside then selling may
intensify and we could test 16373 - 16070 / 4900 - 4800
levels. Traders holding their long position should
maintain a stop loss of 16544 / 4960.
Reliance Industries (1046) - BULLISH Exhibit 3: Reliance Industries Weekly chart
Buying Range : Rs. 1046.00 - Rs. 1020.00
Stop - loss : Rs. 990.00
Targets : Rs. 1140.00 - Rs. 1150.00
Time frame : 4 - 6 weeks.
Reliance Industries: The stock has taken support at the crucial
level of 995 in the past week. Also volumes increased
substantially on Friday's Trading session and momentum
indicators are positively poised. We expect the stock to show a
positive move going forward in the next 4 to 6 weeks. Traders Source: Falcon
can buy at current levels or on dips up to 1020 levels and
place a stop-loss at 990 levels. Target on the upside would be
at 1140 -1150 levels (Refer Exhibit 3).
For Private Circulation Only | Angel Broking Ltd: BSE Sebi Regn No : INB 010996539 / CDSL Regn No: IN - DP - CDSL - 234 - 2004 / PMS Regn Code: PM/INP00000154 6 Angel Securities Ltd:BSE: INB010994639/INF010994639 NSE: INB230994635/INF230994635 Membership numbers: BSE 028/NSE:09946 5
7. Derivatives Review | June 12, 2010
Market is at higher side of the range; 4800-5200
Nifty spot has closed at 5119 this week, against a close of 5136 last week. The Put-Call Ratio has increased from 1.40 to 1.44
levels and the annualized Cost of Carry (CoC) is negative 1.37 The Open Interest in Nifty Futures has increased by 9.05
1.37%. 9.05%.
Put-Call Ratio Analysis Futures Annual Volatility Analysis
The Nifty PCR has increased from 1.40 to 1.44 levels. The The Historical Volatility of the Nifty has decreased from 27.18%
4800 and 5000 Put options added significant open interest in to 26.33%. IV of at the money options is at the same level of
the week gone by. On the other hand, many Call options added 21% and has gone up to 27% during the week. Some liquid
considerable open interest. The 5200 call has highest positions, counters where HV has increased significantly are GTL,
and Friday's build-up also suggests it is difficult for the market BHARTIARTL, HEROHONDA, BHEL and KSOILS. Stocks where
to breach the 5200 level, while the 5000 is the immediate HV has decreased are ABB, INDIANB, PUNJLLOYD,
support for the market. EDUCOMP and RENUKA.
Open Interest Analysis Cost-of-Carry Analysis
The total Open Interest of the market is Rs1,36,657cr, as The June Future closed at a discount of 2.50 points as against
against Rs1,21,532cr last week, and the Stock Futures' open a discount of 15.55 points last week and July future closed at
interest increased from Rs33,068cr to Rs34,723cr. In the week a discount of 6.50 points. Some liquid counters where CoC
gone by, HINDALCO added significant open interest, 130 level turned from negative to positive are HINDUNILVER, INDIANB,
may act as a strong support for the stock. Some liquid stocks PETRONET, POWERGRID and INFOSYSTCH. Stocks where
where open interest has increased are YESBANK, BRFL, IDFC CoC turned from positive to negative are CANBK, ABAN,
PANTALOONR and ABAN. Stocks where open interest has WIPRO, TATAPOWER and BHEL.
decreased significantly are FORTIS, UNIPHOS, IOB,
AUROPHARMA, TECHM and RCOM.
Derivative Strategy
Scrip : HINDALCO CMP : Rs.139.50/- Lot Size : 3518 Expiry Date (F&O) :
24th June, 2010
View: Mildly Bullish Strategy: Ratio Call Spread Expected Payoff
Buy/Sell Qty Scrip Strike Series Option Rate Closing Price Expected
rofit/Loss
Profit/Loss
Price Ty p e (Rs.)
Buy 3518 HINDALCO 140 June Call 5.00 Rs. 130.00 (Rs. 1.50)
Sell 7036 HINDALCO 150 June Call 1.75 Rs. 142.00 Rs. 0.50
HBEP: Rs.158.50/-
Rs. 154.00 Rs. 4.50
LBEP: Rs.141.50/-
Max. Risk: Unlimited Max. Profit: Rs.29,903.00/- Rs. 166.00 (Rs. 7.50)
If HINDALCO continues to trade above HBEP . If stock closes at Rs.150 on expiry.
Note: Profit can be booked before expiry, if stock moves in the favorable direction and the time value decay.
ote: Rs. 178.00 (Rs.19.50)
LT
Scrip : LT CMP : Rs.1677.05/- Lot Size : 200 Expiry Date (F&O) :
24th June, 2010
View: Range Bound Strategy: Short Straddle Expected Payoff
Buy/Sell Qty Scrip Strike Series Option Rate Closing Price Expected
rofit/Loss
Profit/Loss
Price Ty p e (Rs.)
Sell 200 LT 1650 June Call 50.00 Rs. 1510.00 (Rs. 65.00)
Sell 200 LT 1650 June Put 25.00 Rs. 1580.00 Rs. 5.00
HBEP: Rs.1725.00/-
Rs. 1650.00 Rs. 75.00
LBEP: Rs. 1575.00/-
Max. Risk: Unlimited Max. Profit: Rs.15000.00/- Rs. 1720.00 Rs. 5.00
If LT continues to trade above HBEP or below LBEP . If stock closes at Rs.1650 on expiry.
Note: Profit can be booked before expiry, if stock remains in the desired range and the time value decay. Rs. 1790.00 (Rs. 65.00)
For Private Circulation Only | Angel Broking Ltd: BSE Sebi Regn No : INB 010996539 / CDSL Regn No: IN - DP - CDSL - 234 - 2004 / PMS Regn Code: PM/INP00000154 6 Angel Securities Ltd:BSE: INB010994639/INF010994639 NSE: INB230994635/INF230994635 Membership numbers: BSE 028/NSE:09946 7
8. Fund Focus
Mutual F und Focus | June 12, 2010
Diversify your Portfolio with Arbitrage Funds
Arbitrage Funds Opportunities for Arbitrage funds - BSE Index
Arbitrage involves simultaneous purchase and sale of 18,500
Current Volatility creating arbitrage opportunities
equivalent instruments from two or more markets to benefit 18,000
from a discrepancy in their prices. 17,500
Arbitrage funds in India mainly take advantage of opportunities 17,000
between equity cash and futures markets. 16,500
Though some funds do seek to generate returns from arbitrage 16,000
in debt market. 15,500
This strategy normally acts as a shield against market volatility 15,000
as both buying and selling transactions offset each other. 14,500
Jan-10 Feb-10 Mar-10 Apr-10 May-10 Jun-10
Features of Arbitrage Funds
Source: Angel Research
Objective Seek to generate returns from arbitrage
opportunities in market. Why Arbitrage Funds Now?
Investment Buy stocks in cash markets and sell futures, Volatile markets or sustained bull markets with intermittent
Strategy: to take arbitrage advantage.(When corrections are conducive for arbitrage funds.
arbitrage opportunities are not available For the past few months the equity markets have been very
they allocate funds to short term debt money volatile presenting various arbitrage opportunities.
market instruments) It is expected that there may be high volatility in the markets in
Asset Allocation: Equity & Related instruments, Derivatives, near short term.
Short term debt & Money Market instruments. Thus Arbitrage funds should form part of the investors' portfolio
Risk : Low for diversification.
Benefits of Arbitrage Funds over Liquid Funds Performance Comparison (% Returns)*
Generally Arbitrage funds (equity arbitrage funds) are taxed 5 4.56 4.4
4.58
4.5
like equity funds at 15% for short-term capital gains and no 3.84
4.04
3.83
4 3.62
Dividend Distribution Tax (DDT); however, 28% is deducted 3.5 3.16
from liquid funds as dividend distribution tax (DDT). 3
Though some funds having higher proportion of debt in their 2.5
2
portfolio may be treated as debt fund for taxation.
1.5
Thus generally arbitrage funds have a tax advantage over 1
liquid funds. 0.5
0
Liquid funds are not allowed to invest in papers exceeding 1 Month 2 Months 3 Months 1 Year
maturity of 91 days, which further affects their returns. Arbitrage funds Category Average Crisil Liquid Fund Index
Thus, recent regulations in liquid funds limit their capacity to Source: Angel Research; Note: * Returns are simple annualised and as on 10th June
deliver higher returns. 2010.
Current market volatility may provide ample opportunities for Arbitrage funds have consistently outperformed their
arbitrage, which allows arbitrage funds to be better placed to benchmark.
generate comparatively higher returns. Arbitrage funds are an ideal way to earn decent returns with
Tax Implications* low risk.
Dividend Dividends will be tax free in the hands of Who should invest in arbitrage Funds?
Distribution Tax: the investor.
Tax:
Investors who are risk averse.
Term
Short Term Equity STCG tax-15.45 %
Those who want a balance of safety, returns & liquidity.
Capital Gains: Debt STCG tax-30.90 %
Looking for potentially higher returns compared to a liquid /
Term
L ong Term Equity-NIL
money market fund.
Capital Gains: Debt-20.60% with Indexation
For investors who want to protect their portfolio from downside
and 10.30 % without Indexation
*Individuals/HUF/NRI
risk, these funds are excellent portfolio diversifiers.
Disclaimer: Angel Broking Ltd is not responsible for any error or inaccuracy or any losses suffered on account of information contained in this report. Data for analysis is obtained
from MFI Explorer. Mutual Fund investments are subjected to market risk. Please read the Scheme Information document carefully before investing.
For Private Circulation Only | Angel Broking Ltd: BSE Sebi Regn No : INB 010996539 / CDSL Regn No: IN - DP - CDSL - 234 - 2004 / PMS Regn Code: PM/INP00000154 6 Angel Securities Ltd:BSE: INB010994639/INF010994639 NSE: INB230994635/INF230994635 Membership numbers: BSE 028/NSE:09946 8
9. Fund Focus
Mutual F und Focus | June 12, 2010
Recommended Arbitrage Funds
HDFC Arbitrage Fund Performance Comparison - Scheme Objective
Inception: 8th June 2005 (% Returns) To generate income through arbitrage
Type: Open-Ended 6.00
5.56 opportunities between cash and derivative market
Inception: 23rd Oct 2007
Corpus: Rs. 641.15 (31-May-10) Crs and arbitrage opportunities within the derivative
5.00
Fund Manager: Anil Bamboli and segment and by deployment of surplus cash in
4.25
Anand Laddha 3.84 3.95 debt securities and money market instruments.
3.83
Min Investment: Rs. 5000 4.00 3.63 3.62
Entry Load: Nil 3.16 Fund Analysis
Exit Load: Max 1% 3.00 Currently the scheme has 29% Debt exposure,
Latest NAV: Rs 11.69
NAV 67% equity exposure & holds 2.4 % in Cash &
Week
52 Week High: Rs 11.71 (01-Jun-10) 2.00 Equivalent. Highest Sector exposure is in Banking,
52 Week Low: Rs 11.25 (16-Jun-09)
Week Low:
Refineries, finance, and Power sectors. The Fund
Key Ratios* 1.00
Expense Ratio: 0.82 (31-Mar-10) has consistently outperformed its benchmark. On
Standard Deviation: 0.090 equity side it has 36% exposure in Large Cap stocks,
0.00
Jensen: 0.0002 31% in midcap stocks and 0.50% in small cap stocks.
*3 Yrs rolling return 1 Month 3 Months 6 Months 1 Year
Returns & Ratios as on 12th June 2010 HDFC Arbitrage Fund - Retail - Growth Crisil Liquid Fund Index It has a Low standard deviation & expense
Portfolio as on 30th May 2010 ratio.
Returns are Simple Annualized Source: Angel Research
USPs of this Fund Positive Jensen ratio shows fund manager's
Equity exposure is mainly in large cap and midcap stocks with minimal exposure to small cap stocks. superior stock selection ability.
Invests surplus cash in high quality short term debt & money market instruments when arbitrage
opportunities are not available. Ideal for Investors
Lowest Expense Ratio compared to the peer group. Investment Horizon - Short Term
Generally provides higher returns compared to liquid and ultra short term funds.
Tax efficiency of an Equity Mutual Fund. Risk Appetite - Low
Provides portfolio diversification & market neutral returns.
Kotak Equity Arbitrage Fund Performance Comparison - Scheme Objective
Inception: Open-Ended (% Returns) The investment objective of the scheme is to
Inception: 21th Sept 05 6.00
generate capital appreciation and income by
Corpus: Rs. 395.88 (31-May-10) Crs 5.41
predominantly investing in arbitrage opportunities
Fund Manager: Deepak Gupta, Abhishek Bisen 5.00
and Sajit Pisharod 4.33 4.39
in the cash and derivatives segment of the equity
Min Investment: Rs 5000 3.84
4.02 market, and by investing the balance in debt and
3.83
4.00
Entry Load: Nil
3.62 money market instruments.
3.16
Exit Load: Max 0.50%
3.00 Fund Analysis
Latest NAV: Rs 13.78
NAV
52 Week High: Rs 13.8 (01-Jun-10)
Week Currently the scheme has 30% Debt exposure and
Week Low:
52 Week Low: Rs 13.21 (11-Jun-09) 2.00 holds 70% Cash & Equivalent Exposure. Currently
in its portfolio it has exposure in debt and money
Key Ratios*
1.00 market instruments. The Fund has consistently
Expense Ratio: 0.95 (31-Mar-10)
outperformed its benchmark and peer group in
Standard Deviation: 0.089
0.00 current volatile markets. The Fund Managers tries
Jensen: 0.002
1 Month 3 Months 6 Months 1 Year to generate superior returns through futures and
*1 Yrs rolling return
Returns & Ratios as on 12th June 2010
cash market arbitrage opportunities available in
Kotak Equity Arbitrage Fund - Growth Crisil Liquid Fund Index
Portfolio as on 30th May 2010 the market.
Source: Angel Research
Returns are Simple Annualized
It has a Lower standard deviation & expense
USPs of this Fund ratio.
When arbitrage opportunities are available, the fund invests mainly in large cap & mid cap stocks Positive Jensen ratio shows the fund manager's
both in cash & futures market otherwise it invests mainly in high quality debt instruments.
superior stock selection ability.
The fund targets returns higher than short term fund & liquid funds.
Tax efficiency of a Mutual Fund. Ideal for Investors
Provides portfolio diversification & market neutral returns. Investment Horizon - Short Term
Ideal for investors who are averse to capital loss. Risk Appetite - Low
Disclaimer: Angel Broking Ltd is not responsible for any error or inaccuracy or any losses suffered on account of information contained in this report. Data source is from MFI Explorer
and Axis AMC. Mutual Fund investments are subjected to market risk. Please read the Statement of Additional Information and Scheme Information document carefully before
investing.
For Private Circulation Only | Angel Broking Ltd: BSE Sebi Regn No : INB 010996539 / CDSL Regn No: IN - DP - CDSL - 234 - 2004 / PMS Regn Code: PM/INP00000154 6 Angel Securities Ltd:BSE: INB010994639/INF010994639 NSE: INB230994635/INF230994635 Membership numbers: BSE 028/NSE:09946 9