1. Weekly Review
April 17, 2010
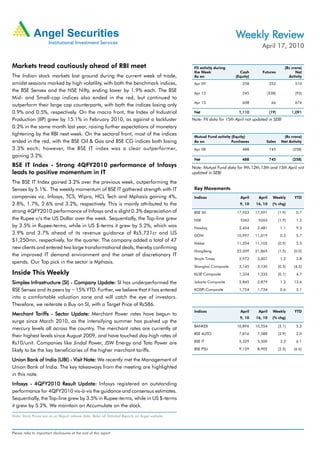
Markets tread cautiously ahead of RBI meet FII activity during (Rs crore)
the Week Cash Futures Net
The Indian stock markets lost ground during the current week of trade, As on (Equity) Activity
amidst sessions marked by high volatility, with both the benchmark indices, Apr 09 258 252 510
the BSE Sensex and the NSE Nifty, ending lower by 1.9% each. The BSE Apr 12 245 (338) (93)
Mid- and Small-cap indices also ended in the red, but continued to
Apr 13 608 66 674
outperform their large cap counterparts, with both the indices losing only
0.9% and 0.5%, respectively. On the macro front, the Index of Industrial Net 1,110 (19) 1,091
Production (IIP) grew by 15.1% in February 2010, as against a lackluster Note: FII data for 15th April not updated in SEBI
0.2% in the same month last year, raising further expectations of monetary
tightening by the RBI next week. On the sectoral front, most of the indices Mutual Fund activity (Equity) (Rs crore)
ended in the red, with the BSE Oil & Gas and BSE CG indices both losing As on Purchases Sales Net Activity
3.3% each; however, the BSE IT index was a clear outperformer, Apr 08 488 745 (258)
gaining 3.2%.
Net 488 745 (258)
BSE IT Index - Strong 4QFY2010 performance of Infosys Note: Mutual Fund data for 9th,12th,13th and 15th April not
leads to positive momentum in IT updated in SEBI
The BSE IT Index gained 3.2% over the previous week, outperforming the
Sensex by 5.1%. The weekly momentum of BSE IT gathered strength with IT Key Movements
companies viz. Infosys, TCS, Wipro, HCL Tech and Mphasis gaining 4%, Indices April April Weekly YTD
2.8%, 1.7%, 2.6% and 3.2%, respectively. This is mainly attributed to the 9, 10 16, 10 (% chg)
strong 4QFY2010 performance of Infosys and a slight 0.3% depreciation of BSE 30 17,933 17,591 (1.9) 0.7
the Rupee v/s the US Dollar over the week. Sequentially, the Top-line grew NSE 5362 5263 (1.9) 1.2
by 3.5% in Rupee-terms, while in US $-terms it grew by 5.2%, which was Nasdaq 2,454 2,481 1.1 9.3
3.9% and 3.7% ahead of its revenue guidance of Rs5,721cr and US DOW 10,997 11,019 0.2 5.7
$1,250mn, respectively, for the quarter. The company added a total of 47
Nikkei 11,204 11,102 (0.9) 5.3
new clients and entered two large transformational deals, thereby confirming
HangSeng 22,209 21,865 (1.5) (0.0)
the improved IT demand environment and the onset of discretionary IT
Straits Times 2,972 3,007 1.2 3.8
spends. Our Top pick in the sector is Mphasis.
Shanghai Composite 3,145 3,130 (0.5) (4.5)
Inside This Weekly KLSE Composite 1,334 1,333 (0.1) 4.7
Simplex Infrastructure (SI) - Company Update: SI has underperformed the Jakarta Composite 2,845 2,879 1.2 13.6
BSE Sensex and its peers by ~15% YTD. Further, we believe that it has entered KOSPI Composite 1,724 1,734 0.6 3.1
into a comfortable valuation zone and will catch the eye of investors.
Therefore, we reiterate a Buy on SI, with a Target Price of Rs586.
Indices April April Weekly YTD
Merchant Tariffs - Sector Update: Merchant Power rates have begun to
Tariffs
9, 10 16, 10 (% chg)
surge since March 2010, as the intensifying summer has pushed up the
BANKEX 10,896 10,554 (3.1) 5.2
mercury levels all across the country. The merchant rates are currently at
BSE AUTO 7,816 7,588 (2.9) 2.0
their highest levels since August 2009, and have touched day-high rates of
Rs10/unit. Companies like Jindal Power, JSW Energy and Tata Power are BSE IT 5,329 5,500 3.2 6.1
likely to be the key beneficiaries of the higher merchant tariffs. BSE PSU 9,129 8,902 (2.5) (6.6)
Union Bank of India (UBI) - Visit Note: We recently met the Management of
Union Bank of India. The key takeaways from the meeting are highlighted
in this note.
Infosys - 4QFY2010 Result Update: Infosys registered an outstanding
performance for 4QFY2010 vis-à-vis the guidance and consensus estimates.
Sequentially, the Top-line grew by 3.5% in Rupee-terms, while in US $-terms
it grew by 5.2%. We maintain an Accumulate on the stock.
Note: Stock Prices are as on Report release date; Refer all Detailed Reports on Angel website
Please refer to important disclosures at the end of this report
2. Fundamental Focus | April 17, 2010
Focus
Simplex Infrastructure - Buy Price - Rs475
Target Price - Rs586
Company Update
Earnings momentum to begin The recent underperformance
Particulars Jan-10 CMP (Rs) YTD Returns (%)
Simplex Infrastructure (SI) has underperformed the BSE Sensex
CCCL 83 90 7.9
and its peers by ~15% YTD, primarily on account of poor
NCC 166 178 7.3
quarterly performances and a lack of visibility on the order
Patel Engg. 448 463 3.4
book front. However, we believe that it has entered into a
IVRCL Infra 175 172 (1.6)
comfortable valuation zone (lower than its five and three-year
MPL 172 166 (3.2)
average P/E trading bands) and will catch the eye of investors,
HCC 146 135 (7.3)
given the long-term opportunity in the infra space and with
Average 1.1
private capex (forming >50% of SI's business) expected to
Simplex Infra 554 475 (14.1)
improve in the second half CY2010 (given the excellent IIP
BSE Sensex 17,465 17,714 1.4
numbers). We are expecting a 28.2% Earnings CAGR over
Source: Company, Angel Research
FY2010-12E, owing to strong Top-line growth (CAGR of 19.2%)
and stable EBITDA margins. We have assigned a Target P/E Its historical 1-year forward P/E band shows that SI has always
multiple of 14x (at a ~20% discount to its three and five-year traded at an average P/E of 14.3x, 18.8x and 17.0x, on the
average) on its FY2012E EPS , which implies a potential upside past seven, five and three-year basis, respectively. Therefore,
of 24% from current levels. Therefore, we reiterate a Buy on SI, our Target P/E multiple (14x) is lower than the historical average.
with a Target Price of Rs586. Moreover, it should be noted that we are expecting a 28.2%
earnings growth over FY2010-12E, which would imply a PEG
Order inflow and stable margins to drive earnings momentum:
ratio of <0.5, giving room for a re-rating. Therefore, we
SI has bagged orders worth Rs2,166cr in 4QFY2010 taking
reiterate a Buy on SI, with a Target Price of Rs586, which implies
Target Price
the total o/s order book at ~Rs11,200cr (2.4xFY2010E
a potential upside of 24% from the current levels.
revenues); this would also put to rest market concerns over
revenue visibility. We believe that SI has been selective in projects
and has stayed away from aggressive bidding; hence, we are
expecting the company to maintain stable margins, going Key Financials (Consolidated)
ahead.
Y/E March (Rs cr) FY2009 FY2010E FY2011E FY2012E
Operating cash flows to turn positive: SI is one of the best Net Sales 4,713 4,766 5,750 6,768
working capital (WC) managed companies in our universe,
% chg 67.8 1.1 20.7 17.7
which has resulted in improved operating cash flows over the
Profit
Adj. Net Profit 116.5 126.1 163.1 207.1
years. It has been able to bring its WC days down from 122
days in FY2007 to 70 days in FY2009. Against this backdrop, % chg 29.3 8.2 29.3 27.0
we are expecting SI to start clocking positive operating cash FDEPS (Rs) 23.5 25.5 33.0 41.9
flows, going ahead. EBITDA Margin (%) 8.6 9.9 9.7 9.7
Trading at attractive valuations: We believe that, at the current P/E (x) 20.2 18.6 14.4 11.3
levels of Rs475, stock is trading at an attractive valuation zone
RoAE (%) 14.0 13.1 14.9 16.4
(11.3x FY2012E earnings), considering its recent
RoACE (%) 14.6 13.4 14.0 14.3
underperformance, discount to its five and three-year P/E band,
and a 28.2% earnings growth expectation over FY2010-12E. P/BV (x) 2.6 2.3 2.0 1.7
EV/Sales (x) 0.7 0.8 0.7 0.6
EV/EBITDA (x) 8.5 7.7 7.0 6.2
Source: Company, Angel Research; Price as on April 9, 2010
Research Analyst - Shailesh Kanani/Aniruddha Mate
For Private Circulation Only | Angel Broking Ltd: BSE Sebi Regn No : INB 010996539 / CDSL Regn No: IN - DP - CDSL - 234 - 2004 / PMS Regn Code: PM/INP00000154 6 Angel Securities Ltd:BSE: INB010994639/INF010994639 NSE: INB230994635/INF230994635 Membership numbers: BSE 028/NSE:09946 2
3. Fundamental Focus | April 17, 2010
Focus
Merchant Tariffs
Sector Update
Soaring heat leads to higher rates Average Day Ahead prices at Indian Energy Exchange
16
Merchant Tariffs Rates down in
Merchant Power rates have begun to surge since March 2010, 14
surged during winter and
General Elections picking up
as the intensifying summer has pushed up the mercury levels 12
since March
all across the country. Historically, the summer months 10
(March-June) witness heavy demand from both the consumer
(Rs/kwh)
8
and industrial segments, resulting in load shedding and in an 6
upward push in the rates of merchant power, as distribution 4
utilities attempt to procure power at higher prices to meet the 2
increased demand. The prices of power in the short-term market 0
(as per the figures available from the Indian Energy Exchange, Apr-09 Jun-09 Aug-09 Oct-09 Dec-09 Feb-10 Apr-10
IEX) have been on an upward swing since March 2010, after Source: IEX, Angel Research
lying low for close to four months during the winter. Apart from
Outlook
the increased demand, the fall in the generation of hydro-based
plants due to poor monsoons has also resulted in the upswing According to our estimates, the overall merchant power capacity
in merchant power rates. The merchant rates are currently at addition is expected to be around 10,000-12,000MW during
their highest levels since August 2009, and have touched Eleventh Plan period (FY2007-12). The state-run Power Finance
day-high rates of Rs10/unit. Corporation, which is the nodal agency for the development of
ultra mega power projects, would provide the necessary
Merchant Tariffs up 72% since March 2010: Merchant rates in
Tariffs
assistance to merchant plant developers to accomplish timely
India have been on an upward trend since March 2010, after
implementation. Presently, the sale of power under the Merchant
remaining low in the winter season (November-February). The
basis appears to be an attractive option, considering the power
average daily price since March is at Rs5.83/unit, up 72% over
deficit prevalent in the country. Spot power prices have gone
October 2009-February, 2010 (average price of Rs3.39/unit).
up significantly, after declining to a low of Rs3.39/unit in October
Severe shortages witnessed across India, particularly in the
2009 - February 2010; currently, a unit costs Rs5.83 on average
southern region, have resulted in the increase in merchant tariffs.
(Since March 2010). We expect spot prices to remain at these
The southern region has been affected due to grid congestion
levels through the April-June, 2010 period. However, large
as well as the fall in wind power generation in Tamil Nadu. The
capacity additions lined up by private and public sector players
delay in the commencement of new power plants has affected
are expected to reduce the power deficit, lowering Merchant
supply across the country, pushing up the merchant rates. We
power tariffs in turn.
expect the merchant power tariffs to remain high till June 2010,
due to strong demand arising out of the increased industrial The recent competitive bidding for supply of power at
activity and heavy demand in summer. Rs2.7-3.2/unit can form the base for merchant tariffs. We expect
the power deficit to continue till FY2012E. We estimate merchant
Power
Surge in Power demand in Summer Months: The demand for
tariffs to be at Rs4.5 and at Rs4/unit in FY2011E and FY2012E,
power tends to surge in India during the summer months, due
respectively. Companies like Jindal Power, JSW Energy and Tata
to the hot weather conditions resulting in more consumption.
Power are likely to be the key beneficiaries of the higher
Historically, the power deficit (base and peak) remains higher
merchant tariffs.
than the yearly average during the summer months. In order to
meet the growing demand, the utilities resort to expensive buying
to avoid load shedding. Although the states are not expected to
be politically compelled to provide uninterrupted power as
witnessed during General Election time in April - May, 2009,
we still expect the demand-side pressure to persist.
Research Analyst - Rupesh Sankhe/V. Srinivasan
For Private Circulation Only | Angel Broking Ltd: BSE Sebi Regn No : INB 010996539 / CDSL Regn No: IN - DP - CDSL - 234 - 2004 / PMS Regn Code: PM/INP00000154 6 Angel Securities Ltd:BSE: INB010994639/INF010994639 NSE: INB230994635/INF230994635 Membership numbers: BSE 028/NSE:09946 3
4. Fundamental Focus | April 17, 2010
Focus
Union Bank of India - Neutral Price - Rs305
Target Price - Rs356
Visit Note
Already Priced-in we have factored in 6.4% yoy increase in NPA provisions in
FY2011E, close to the average increase for PSU banks under
We recently met the Management of Union Bank of India (UBI).
our coverage). The Bank's Gross and Net NPAs stood at 2.0%
The key takeaways from the meeting are highlighted in this
and 0.6% respectively in 3QFY2010, with cumulative
note.
restructured Advances at Rs4,711cr, forming 4.9% of the total
Profitability to Improve: UBI underperformed the Bankex by loans (55% of the Networth), indicative of the relatively moderate
51% during 1HFY2010 as its CD ratio dipped to 66.7% due to asset quality of the bank. At the end of 3QFY2010, provision
low credit demand and NIMs touched a low of 2.1%. Our coverage (incl. Technical Write-offs) at 80% was also amongst
positive outlook at that juncture was underpinned by the strong the healthiest in the sector.
traction in the bank's retail deposits, especially CASA - a key
competitive advantage. Our discussions with the management The Capital Adequacy Ratio (CAR) of the bank stood at 13.5%,
regarding tech-enabled channel and product roll-outs indicate with Tier-1 Capital of 8.7%. The bank has also approached the
continued focus on enhancing the deposit franchise. Government for an infusion of Rs1,800cr, however,
nothing concrete has been announced by the Government on
The bank added 215 outlets during 9MFY2010 and is planning
this front so far.
to grow its network at approx 10% p.a. In fact, the bank
improved Savings deposits market share by 10bp to 3.3% (one Outlook and Valuation
of few PSU banks like SBI to do so). CASA market share gains
We have a positive view on the bank's strategy of relatively
coupled with improvement in CD ratio aided the bank to
more aggressive branch expansion and customer-centric
improve its NIMs to 2.55% in 3QFY2010. With improving credit
technology solutions that are driving CASA market share gains.
demand, the bank has ended FY2010 with an advances growth
However, at the CMP the stock is trading at 1.3x FY2012E ABV
,
of 23.3% yoy (as against 8.4% YTD growth at the end of
vs. a 5-year range of 1.1-1.4x and average of 1.3x, which we
3QFY2010), in fact exceeding deposit growth of 22.7% yoy.
believe reflect the positives. Accordingly, post outperforming
We expect NIMs to improve qoq by 17 bp to 2.71%. In FY2011E
the bankex by 10% since beginning of 3QFY2010, we recently
as well we expect NII growth of 26.0% (one of the highest
downgraded the stock to Neutral and maintain the same at
amongst peers).
this juncture.
Concerns about retirements: Regarding large-scale retirements
in PSU banks over the next two years, the management shared Key Financials
that 58% of top management (AGM and above) were due for Y/E March (Rs cr) FY2009 FY2010E FY2011E FY2012E
retirement across PSU Banks and expressed concerns about NII 3,814 3,920 4,938 5,605
effective replacement of this experienced core management,
% chg 23.6 2.8 26.0 13.5
especially considering the knowledge-intensive nature of the
Profit
Net Profit 1727 2007 2159 2470
banking business.
% chg 24.5 16.2 7.6 14.4
Moderate Asset Quality pressures, lower CAR relative to peers:
NIM (%) 2.8 2.3 2.5 2.4
Union Bank had cautiously implemented a relatively more
calibrated loan growth strategy following the crisis. The advances EPS (Rs) 34.2 39.7 42.8 48.9
grew at a sedate 14.6% yoy at the end of 3QFY2010 and the P/E (x) 9.0 7.7 7.2 6.3
Yield on Advances (YoA) of the bank declined by 54bp (against P/ABV (x) 2.2 1.8 1.5 1.3
a decline of 5bp for peers) in 9MFY2010 over FY2008 levels.
RoA (%) 1.2 1.1 1.0 1.0
In our view, the bank's conservative strategy is likely to result in
RoE (%) 27.2 25.6 22.8 21.9
relatively lower loan loss provisions, going forward (accordingly
Source: Company, Angel Research, Price as on April 16, 2010
Research Analyst - Vaibhav Agrawal/Amit Rane
For Private Circulation Only | Angel Broking Ltd: BSE Sebi Regn No : INB 010996539 / CDSL Regn No: IN - DP - CDSL - 234 - 2004 / PMS Regn Code: PM/INP00000154 6 Angel Securities Ltd:BSE: INB010994639/INF010994639 NSE: INB230994635/INF230994635 Membership numbers: BSE 028/NSE:09946 4
5. Fundamental Focus | April 17, 2010
Focus
Infosys - Accumulate Price - Rs2,782
Target Price - Rs3,044
Target Price - Rs356
4QFY2010 Result Update
Performance Highlights announced a salary hike of about 14% offshore and 2-3%
onsite, effective from April 1, 2010, which would further impact
Infosys registered an outstanding performance for 4QFY2010
earnings in 1QFY2011E. However, the impact of the high wage
vis-à-vis the guidance and consensus estimates. Sequentially, the
costs would get neutralised from 2QFY2011E onwards, as the
Top-line grew by 3.5% in Rupee-terms, while in US $-terms it
large hiring (guided gross addition of 30,000 employees for
grew by 5.2%, which was 3.9% and 3.7% ahead of its revenue
FY2011E) would provide the benefit of a favourable bulge mix
guidance of Rs5,721cr and US $1,250mn, respectively, for the
and would improve utilisation from its current levels. We expect
quarter. The growth was backed by volumes, which were up by
Infosys to register a top-line CAGR of 17% over FY2010-12E;
5.2% qoq, while the pricing was lower by 1.5%. The growth in
however, the EPS is likely to register a subdued CAGR of 12.3%
reported currency was down on account of Rupee appreciation
during the same period. The stock is currently trading at 23.7x
of 1.6% qoq vis-à-vis the US Dollar, and the unfavorable cross-
its FY2011E EPS of Rs117.2 and at 20.1x its FY2012E EPS of
currency impact. The company added a total of 47 new clients
Rs138.4. We believe that the current valuation has priced in an
and entered two large transformational deals, thereby confirming
implicit revenue growth of 17%+, and would not lead to any
the improved IT demand environment and the onset of
earnings/target upgrades. We have valued the stock at 22x
discretionary IT spends. We maintain an Accumulate on the stock.
(1.2x PEG) its FY2012E earnings, in-line with its historical
All-round growth, led mainly by strong volumes: The growth average of 21.5x during FY2007-2010, and at a 30% premium
was broad-based, across the services segment, with the to our Sensex target PE of 17x, as against a historical premium
company delivering a strong sequential growth of 15.5%, 5.1% of 42% during FY2007-2010. We have accounted for a lower
and 32.7% in Consulting and Package Implementation (PI), premium over the Sensex, on account of a lower expected
Testing and Products, respectively. However, on account of strong earnings growth for Infosys and its likely expected
lateral manpower intake, increase in SG&A and a 70bp negative underperformance vis-à-vis the benchmark indices. We
impact of the Rupee's appreciation against the USD, EBIDTA maintain out Accumulate rating on the stock, with a Target Target
Margins contracted by 148bp qoq, resulting in a lower growth price of Rs3,044.
of 2.2% in the net profit.
FY2011E guidance strong in US $ terms, but lower in Rupee Key Financials
terms: Infosys's FY2011E Revenue growth guidance in US Dollar Y/E March (Rs cr) FY2009 FY2010E FY2011E FY2012E
terms ranges between 15.9% to 18%, and EPS growth ranges
Net Sales 21,693 22,742 25,658 31,071
between 8.7% to 4.3%. However, on account of an expected
% chg 30.0 4.8 12.8 21.1
6% yoy appreciation in the average Rupee rate vis-à-vis the US
Dollar, the company's FY2011E guidance in Rupee terms Profit
Net Profit 5,988 6,266 6,702 7,916
remains subdued, with revenue expected to range between % chg 28.5 4.6 7.0 18.1
Rs24,796-25,239cr, implying a yoy growth of 9% to 11%, and EBITDA Margin (%) 33.2 34.6 34.2 33.4
the EPS expected to range between Rs106.8-111.3, implying a
FDEPS (Rs) 104.4 109.7 117.2 138.4
-2.6% to1.4% yoy growth.
P/E (x) 26.6 25.6 23.7 20.1
Outlook and Valuation
P/BV (x) 8.7 7.0 5.8 4.8
Although the revenue guidance in US $-terms is strong, the RoE (%) 37.4 30.3 26.7 26.1
Rupee appreciation is likely to drag the revenue growth in the
RoCE (%) 43.1 38.4 35.5 35.3
reported currency. Overall, the realised rate for the USD is likely
to be lower by 600bp at Rs44.5/USD in FY2011E (as compared EV/Sales (x) 6.9 6.4 5.5 4.4
to Rs47.34/USD in FY2010). The sharp appreciation in FX would EV/EBITDA (x) 19.5 16.5 14.3 11.7
impact the margins by 150bp. The company has also Source: Company, Angel Research, Price as on April 13, 2010
Research Analyst - Rahul Jain/Vibha Salvi
For Private Circulation Only | Angel Broking Ltd: BSE Sebi Regn No : INB 010996539 / CDSL Regn No: IN - DP - CDSL - 234 - 2004 / PMS Regn Code: PM/INP00000154 6 Angel Securities Ltd:BSE: INB010994639/INF010994639 NSE: INB230994635/INF230994635 Membership numbers: BSE 028/NSE:09946 5
6. Technical Picks | April 17, 2010
Bulls on slippery grounds
Sensex (17591) / Nifty (5263)
In our previous Weekly report, we had mentioned that any
sustainable up move above 18047 / 5400 levels would lead
the indices to test 18120 - 18300 / 5450 - 5500 levels, as the
daily charts were maintaining the higher top - higher bottom
formation. Further, we had cautioned that 17715 / 5300
remains key support levels for the markets. Any close below
17715 / 5300 levels would violate the higher top higher bottom
formation and markets would witness consolidation or a
Source: Advanced Get
correction.
Future Outlook
The week began on a positive note but failed to cross
18047 / 5400 levels and witnessed a correction, which led the In view of all the above mentioned factors, we are of the opinion
Sensex to close with net loss of 1.91%, while the Nifty lost that if the market fails to close above Friday's low of 17530 /
1.85 %, vis-à-vis the previous week. 5238 then we could witness violation of the upward slopping
trendline (joining two points, viz 15652 - 16167 / 4675 - 4835
Pattern Formation levels). On the downside, indices are then likely to test 17337 -
On the Weekly chart, the momentum oscillator stochastic 17275 / 5187 - 5122 levels. On the other hand, if indices hold
has given a negative crossover, whereas the RSI is on the verge 17530 / 5238 levels and cross 17664 / 5283 levels then we
of giving negative crossover. This suggests weakness, which could witness continuation of the up move.
can lead the indices to test 17132 / 5122 levels, if it trades
Traders are advised to remain light on positions for the early
below 17530 / 5238 levels.
part of next week, as the markets will react to developments in
On the Daily chart, we have witnessed violation of higher olicy.
the US markets and the RBI Monetary Policy.
top - higher bottom formation. This suggests consolidation or
a correction going ahead.
On the Daily chart, at present the prices have taken support
on the upward slopping trendline joining the two points viz.
15652 - 16167 / 4675 - 4835 levels (shown in the Daily chart).
Only a close below Fridays low of 17530 / 5238 levels would
violate the upward slopping trendline and we could witness a
correction to 17132 / 5122 levels.
For Private Circulation Only | Angel Broking Ltd: BSE Sebi Regn No : INB 010996539 / CDSL Regn No: IN - DP - CDSL - 234 - 2004 / PMS Regn Code: PM/INP00000154 6 Angel Securities Ltd:BSE: INB010994639/INF010994639 NSE: INB230994635/INF230994635 Membership numbers: BSE 028/NSE:09946 6
8. Derivatives Review | April 17, 2010
Use declines upto 5150 to go long
Nifty spot has closed at 5263 this week, against a close of 5362 last week. The Put-Call Ratio has decreased from 1.39 to 1.24 levels
and the annualized Cost of Carry (CoC) is positive 0.24 The Open Interest in Nifty Futures has increased by 5.25
0.24%. 5.25%.
Put-Call Ratio Analysis Futures Annual Volatility Analysis
The Nifty PCR has decreased from 1.39 to 1.24 levels. The Historical Volatility of the Nifty has decreased from 16.82%
Over-the-week, the 5300 call has added highest open interest to 15.70%. IV of at the money options has increased from
in the series, whereas, the 5300 strike Put has shaded highest 16.00% to 19.00%. Some liquid counters where HV has
open interest on the back of profit booking, as the buying of increased significantly are GTL, ROLTA, KOTAKBANK,
the 5300 put has been observed earlier, at lower IVs. Increased MCDOWELL-N and INFOSYSTCH. Stocks where HV has
volatility in the world market, may force Nifty to drift down to declined are SUN-TV, STERLINBIO, HDFCBANK, KSOILS and
5150-5200 level, which can be used to go long, as 5200 strike ISPATIND.
put which had been written, has highest open interest of the
series.
Open Interest Analysis Cost-of-Carry Analysis
The total Open Interest of the market is Rs.1,24,505 crore, as The April Future closed at a premium of 0.45 points as against
against Rs.1,17,544 crore last week, and the Stock Futures' a premium of 3.15 points last week and May future closed at a
open interest has increased from Rs.34,975 crore to Rs.35,697 premium of 4.40 points. Some liquid counters where CoC
crore. We have observed significant build-up in ABIRLANUVO turned from negative to positive are IDFC, AREVAT&D, STER,
over the week, which is mainly due to short formations, KOTAKBANK and AUROPHARMA. Counters where CoC turned
Rs.800-810 is the support zone for the counter. In Pharma space from positive to negative are IDEA , UNIONBANK ,
CIPLA is showing buying interest. Stocks where open interest SUNPHARMA, HINDUNILVR and ACC.
has decreased are ALBK, TATAMOTORS, BALRAMCHIN,
ESSAROIL and MPHASIS.
Derivative Strategy
Scrip : BHARTIARTL CMP : Rs.304.80 Lot Size : 500 Expiry Date (F&O) :
29th Apr, 2010
View: Mildly Bullish Strategy: Long Call Expected Payoff
Buy/Sell Qty Scrip Strike Series Option Buy Rate Price
Closing Price Expected
rofit/Loss
Profit/Loss
Price Type (Rs.)
Buy 500 BHARTIARTL 300 April Call 5.00 Rs. 280.00 (Rs. 5.00)
Rs. 290.00 (Rs. 5.00)
BEP: Rs.305.00/-
BEP:
Rs. 300.00 (Rs. 5.00)
Max. Risk: Rs.2500.00/- Max. Profit: Unlimited
Profit:
If Stock closes at or below Rs.300 on expiry. If stock continues to trade above BEP. Rs. 310.00 Rs. 5.00
Rs. 320.00 Rs. 15.00
NOTE: Profit can be booked before expiry, if BHARTIARTL moves in the favorable direction.
NOTE
TE:
Rs. 330.00 Rs. 25.00
For Private Circulation Only | Angel Broking Ltd: BSE Sebi Regn No : INB 010996539 / CDSL Regn No: IN - DP - CDSL - 234 - 2004 / PMS Regn Code: PM/INP00000154 6 Angel Securities Ltd:BSE: INB010994639/INF010994639 NSE: INB230994635/INF230994635 Membership numbers: BSE 028/NSE:09946 8
9. Fund Focus
Mutual Fund Focus | April 17, 2010
Religare Monthly Income Plan (MIP) Plus - NFO Analysis
Monthly Income Plan - MIP Religare MF’s Unique MIP Product
MIPs are a category of debt funds which invest a small portion,
Monthly Income Plan (MIP) Plus
up to 25% of the portfolio in equities.
Basic objective is providing regular returns with additional
returns with the help of its equity exposure.
Debt + Equity + Gold
Thus MIP suits investors who want Fixed Income & still some
equity participation.
Monthly Income Plan (MIP) Plus
Need for additional diversification in MIP The Scheme is different from the traditional MIPs which combine
a portfolio of Debt and equities.
In MIPs Fixed Income instruments provide safety where as
equities give additional boost by beating inflation. It introduces one additional asset class i.e. Gold (through Gold
ETFs).
But in uncertain market conditions equities may bring in volatility.
Potential to tap into a huge array of low co-related asset classes;
Gold is an asset class which can protect the portfolio from the thereby reducing the overall volatility of the portfolio.
impact of inflation, without overly relying more on equities.
Over long run, this asset mix seeks to generate regular income
Gold against other Asset Classes and moderate capital growth through additional diversification.
Impact of Gold on Traditional MIP Portfolios
Source: Bloomberg. Religare Mutual Fund. Returns shown for Jan00-May02 and
Dec07-Mar09 are CAGR, whereas Absolute for Apr 04 - Jun 04 and Mar 06 - Jun 06
period Growth Rate
Values rebased to 100. As on March 15, 2010 Source: CRISIL, Bloomberg. Analysis:
Gold helps reduce further volatility Religare Mutual Fund. Past Performance may or may not be sustained in future.
Performance
Disclaimer: The above investment simulation is for illustration purpose and should not
be construed as a promise of minimum returns and safeguard of capital. The AMC/
An effective investment tool for preserving wealth. Mutual Fund is not guaranteeing or forecasting any returns in Religare MIP Plus. CAGR:
Compounded Annualised Growth Rate
During periods of market volatility, gold resiliently remains a
store of value. Above graph shows effect of Gold on traditional MIP
portfolio.
Declining production and increasing demand make gold even
more attractive. A 20% exposure to gold, in a traditional MIP product
(represented by Crisil MIP Blended Index) has enhanced returns
Low Correlation with other Asset Classes, thus an Effective significantly.
Portfolio Diversifier. Gold allocation benefited investors during the financial crisis
of 2008-09, when equity markets were falling and protected
An Inflation Hedge and safe Haven during financial crisis. wealth.
Disclaimer: Angel Broking Pvt. Ltd. is not responsible for any error or inaccuracy or any losses suffered on account of information contained in this report. Data source is Religare
AMC. Mutual Fund investments are subjected to market risk. Please read the Statement of Additional Information and Scheme Information document carefully before investing.
For Private Circulation Only | Angel Broking Ltd: BSE Sebi Regn No : INB 010996539 / CDSL Regn No: IN - DP - CDSL - 234 - 2004 / PMS Regn Code: PM/INP00000154 6 Angel Securities Ltd:BSE: INB010994639/INF010994639 NSE: INB230994635/INF230994635 Membership numbers: BSE 028/NSE:09946 9
10. Fund Focus
Mutual Fund Focus | April 17, 2010
Religare Monthly Income Plan (MIP) Plus NFO Analysis
Fund Features NFO Period: 12th April - 11th May 2010
Investment Objective To generate regular income through a portfolio of fixed income securities, Gold ETFs and equity & equity related instruments.
Type of Scheme Open-ended Income scheme
Benchmark 65% - CRISIL MIP Blended Fund Index and 35% - price of gold
Options Investment & Growth option Rs. 5,000/- and in multiples of Re. 1/- thereafter.
Minimum amount Dividend option Rs. 25,000/- and in multiples of Re. 1/- thereafter.
(Under dividend option, only monthly dividend facility is available)
NFO on Stock Exchanges NFO is Available on BSE STAR Platform for subscription.
Exit Load 1% is payable if units are redeemed/ switched-out on or before 1 year from the date of allotment.
Fund Managers Mr. Ashish Nigam (for debt and Gold ETF investments)
Mr. Vetri Subramaniam (for equity investments)
Asset Allocation Instruments Indicative Allocation Risk Profile
(% of total assets)
Debt* and Money Market Instruments 65 - 90 Low to Medium
Equity and Equity Related Instruments and/ or Units of equity mutual fund 0 - 25 High
schemes
Gold ETFs 10 - 35 High
*Investment in securitized debt including pass through certificate (PTC) <= 50% of the net assets. The Scheme will not invest in foreign securitized debt. Exposure to foreign securities
<= 50% of the net assets. Maximum gross derivative position <= 50% of the net assets. However, the aggregate asset allocation including exposure to derivatives will not exceed
100% of net assets of the Scheme.
Investment Rationale Profile of Fund Managers
Debt Exposure will be in short term, low to medium risk profile Debt and Gold ETF Portfolio
and high credit quality dent instruments. Fund Manager : Ashish Nigam
Currently Manages: 8 Debt funds.
Gold Exposure through gold exchange traded funds only and
tactical buying ahead of peak season demand. Equity Portfolio
Fund Manager : Vetri Subramaniam
Equity Exposure the fund manager will adopt the bottom up
investment approach to select stocks. Actively managed, Currently Manages: 9 Equity funds.
outperformance or alpha is expected to come in from asset
allocation decisions, further enhanced by alpha from stock Performance of Funds managed by Fund Managers
selection. ( % Returns )
Scheme 3 6 1 Since
Months Months Year Inception
USPs of the Fund
Religare Tax Plan ( G) 2.45 10.22 80.18 15.13
Multi-Asset diversification - Across different asset classes with
Religare Equity Fund (G) 1.54 10.18 62.43 7.08
low correlation.
Religare Short Term
Debt provides regular income and overall stability. Plan - Reg (G) 1.07 2.2 4.9 7.6
Religare Active Income
Equity could provide an overall kicker to the portfolio for
Fund - Reg (G) 1.89 1.88 0.08 3.21
higher returns.
Source:- MFI ICRA Software; Note: Returns < 1 year are Absolute & >= 1 year are
CAGR. Returns are as on 15th April 2010
Gold preserves purchasing power.
Ideal for Investors
Combines income and capital growth
Looking for exposure to 3 major asset classes in a single fund.
A Hedge against Inflation
Conservative Investors who want an investment with the
potential to add value in varying market conditions.
Built to perform in varying market conditions.
Looking forward to enhancing returns, from their portfolio, to
beat inflation.
Retired persons looking for a flexible and regular income stream.
Disclaimer: Angel Broking Pvt. Ltd. is not responsible for any error or inaccuracy or any losses suffered on account of information contained in this report. Data source is Religare AMC & MFI ICRA
Software. Mutual Fund investments are subjected to market risk. Please read the Statement of Additional Information and Scheme Information document carefully before investing.
For Private Circulation Only | Angel Broking Ltd: BSE Sebi Regn No : INB 010996539 / CDSL Regn No: IN - DP - CDSL - 234 - 2004 / PMS Regn Code: PM/INP00000154 6 Angel Securities Ltd:BSE: INB010994639/INF010994639 NSE: INB230994635/INF230994635 Membership numbers: BSE 028/NSE:09946 10