1. 4QFY2010 Result Update I Logistics
April 30, 2010
Gateway Distriparks BUY
CMP Rs123
Performance Highlights Target Price Rs150
Gateway Distriparks’ (GDL) 4QFY2010 results were marginally below our Investment Period 12 Months
estimates. Revenue growth was mainly driven by robust growth in the Rail
business, which grew 24.2% yoy and 16.1% qoq to Rs78cr. The company’s Stock Info
CFS Revenues fell 9.2% yoy on account of the fire break-out at its Punjab
Sector Logistics
Conware CFS at Navi Mumbai, which impacted volumes. However, falling
market share at its JNPT CFS in FY2010 by100bp to 5.3% remains a concern. Market Cap (Rs cr) 1,329
During the quarter, GDL claimed write back of tax and contingencies of
Beta 0.8
Rs5.3cr and Rs3.3cr, respectively. Consequently, PAT spiked 96.0% yoy to
Rs25.3cr. There has been slight delay in receipt of funds from Blackstone. 52 WK High / Low 148/64
However, management has indicated that funds will flow in 1QFY2011 which
will meet its capex requirements and expects the Rail Segment to break even Avg. Daily Volume 237,020
at the PAT level in FY2011E. We maintain a Buy on the stock. Face Value (Rs) 10
BSE Sensex 17,559
Write backs and Rail Segment drive Profitability: GDL reported 10.5% yoy
jump in Revenues to Rs135cr due to robust growth in the Rail business, which Nifty 5,278
grew 24.2% yoy to Rs78cr. Rail volumes were up 59.4% yoy and 10.4% qoq
to 31,668TEU driven by addition of new rakes and improving capacity Reuters Code GATE.BO
utilisation. The company’s CFS Revenues fell 9.2% yoy and 8.3% qoq to Bloomberg Code GDPL@IN
Rs48cr on account of the fire break-out at its Punjab Conware CFS at Navi
Mumbai, which impacted volumes in February 2010. EBIDTA Margin came in Shareholding Pattern (%)
line with our estimates at 26.4%. Margins of the Rail Segment increased by
Promoters 44.6
863bp yoy and182bp qoq to 14.4% due to the change in product mix of the
Rail Segment in favour of the high-Margin Exim Segment, which grew from MF/Banks/Indian FIs 16.3
30% in 2QFY2010 to 50% in 4QFY2010. During the quarter, GDL claimed
FII/NRIs/OCBs 27.4
MAT credit of Rs5.3cr and write back of contingencies of Rs 3.3cr, which is no
longer payable and lent a boost to Bottom-line. Thus, PAT spiked 96.0% yoy Indian Public 11.7
and 26.5% qoq to Rs25.3cr
Abs. (%) 3m 1yr 3yr
Outlook and Valuation: We expect GDL to emerge a key beneficiary of the Sensex 7.3 54.0 26.6
growing Container traffic in India on the back of its ongoing expansion plans
and on account of having a presence at strategic locations. At the CMP, GDL GDL (3.5) 89.6 (12.2)
trades at 10.2x FY2012E Earnings and 5.1x FY2012E EV/EBITDA. We have
assumed Blackstone's stake in GRFL at 37.3% and valued GDL's stake at 1.5x
FY2012E P/BV. Hence, GDL would fetch Rs35/share for its stake in GRFL. We
have valued GDL's CFS and Cold Chain businesses at 12x FY2012E EPS. We
maintain a Buy on the stock, with a Target Price of Rs150.
Key Financials
Y/E March (Rs cr) FY2009 FY2010E FY2011E FY2012E
Net Sales 451 522 677 853
% chg 66.2 15.8 29.6 25.9
Net Profit 79.6 79.0 98.2 130.0
% chg 8.2 (0.7) 24.2 32.4
FDEPS (Rs) 7.4 7.3 9.1 12.1
EBITDA Margin (%) 32.4 26.4 26.2 28.8
Param Desai
P/E (x) 16.6 16.8 13.5 10.2
Tel: 022 – 4040 3800 Ext: 310
RoE (%) 12.5 12.1 13.6 16.1
E-mail: paramv.desai@angeltrade.com
RoCE (%) 12.1 10.5 11.8 13.7
P/BV (x) 2.6 2.3 2.0 1.7
Mihir Salot
EV/Sales (x) 3.3 2.8 1.8 1.5
Tel: 022 – 4040 3800 Ext: 307
EV/EBITDA (x) 10.1 10.5 6.9 5.1
E-mail: mihirr.salot@angeltrade.com
Source: Company, Angel Research
1
Please refer to important disclosures at the end of this report Sebi Registration No: INB 010996539
3. Gateway Distriparks I 4QFY2010 Result Update
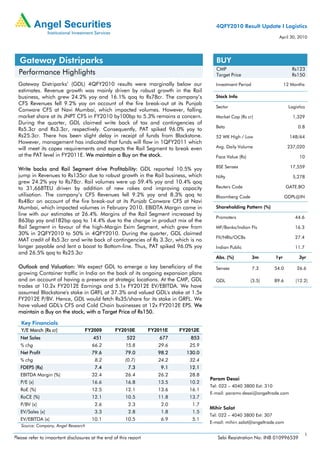
Falling market share at JNPT CFS remains a concern
GDL reported 13.0% decline at JNPT CFS volumes in FY2010 in spite of the 2.7%
yoy growth registered in container volumes at JNPT. The company’s witnessed
100bp erosion in market share to 5.3% at the JNPT CFS in FY2010 on the back of
increasing competition and oversupply of CFS at JNPT. We believe that GDL will
continue to face near-term pressures at the JNPT CFS as no additional capacity is
coming up in FY2011E. We expect additional capacity of 0.8mn TEU to come up at
JNPT’s third container terminal only by end FY2011E, which will improve capacity
utilisation of the CFS players.
Exhibit 3: Declining Market Share
6,000 7
6.5
5,000 6.2 6.3
6
5.3 5.8
4,000
5.2 5.3
('000 TEUs)
5
3,000
(%)
4
2,000
3
1,000
0 2
FY2006 FY2007 FY2008 FY2009 FY2010 FY2011E FY2012E
Container Volumes at JNPT (LHS) GDL's Market Share at JNPT (RHS)
Source: IPA, Angel Research
Outlook and Valuation
With Exim volumes showing signs of improvement, we expect GDL’s Revenue mix to
change in favour of Exim in the Rail business, which will in turn improve its Margins
going forward. It will also result in better performance of the CFS Segment, which
has registered lacklustre performance this far. We remain bullish on the long-term
prospects of the Container Sector, which is the core driver of growth for GDL’s
business. We believe that GDL's presence at strategic locations and its ongoing
expansion plans will make it a key beneficiary of the growing Container traffic in
India. At the CMP, GDL is trading at 10.2x FY2012E Earnings and 5.1x FY2012E
EV/EBITDA. We have assumed Blackstone's stake in GRFL at 37.3% and valued
GDL's stake at 1.5x FY2012E P/BV. Hence, GDL would fetch Rs35/share for its stake
in GRFL. We have valued GDL's CFS and Cold Chain businesses at 12x FY2012E
EPS. We maintain a Buy on the stock, with a Target Price of Rs150.
April 30, 2010 3
7. Gateway Distriparks I 4QFY2010 Result Update
Research Team Tel: 022-4040 3800 E-mail: research@angeltrade.com Website: www.angeltrade.com
DISCLAIMER
This document is solely for the personal information of the recipient, and must not be singularly used as the basis of any investment decision. Nothing in this
document should be construed as investment or financial advice. Each recipient of this document should make such investigations as they deem necessary to
arrive at an independent evaluation of an investment in the securities of the companies referred to in this document (including the merits and risks involved),
and should consult their own advisors to determine the merits and risks of such an investment.
Angel Securities Limited, its affiliates, directors, its proprietary trading and investment businesses may, from time to time, make investment decisions that are
inconsistent with or contradictory to the recommendations expressed herein. The views contained in this document are those of the analyst, and the company
may or may not subscribe to all the views expressed within.
Reports based on technical and derivative analysis center on studying charts of a stock's price movement, outstanding positions and trading volume, as
opposed to focusing on a company's fundamentals and, as such, may not match with a report on a company's fundamentals.
The information in this document has been printed on the basis of publicly available information, internal data and other reliable sources believed to be true,
and are for general guidance only. Angel Securities Limited has not independently verified all the information contained within this document. Accordingly,
we cannot testify, nor make any representation or warranty, express or implied, to the accuracy, contents or data contained within this document. While Angel
Securities Limited endeavours to update on a reasonable basis the information discussed in this material, there may be regulatory, compliance, or other
reasons that prevent us from doing so.
This document is being supplied to you solely for your information, and its contents, information or data may not be reproduced, redistributed or passed on,
directly or indirectly.
Angel Securities Limited and its affiliates may seek to provide or have engaged in providing corporate finance, investment banking or other advisory services
in a merger or specific transaction to the companies referred to in this report, as on the date of this report or in the past.
Neither Angel Securities Limited nor its directors, employees and affiliates shall be liable for any loss or damage that may arise from or in connection with the
use of this information.
Note: Please refer to the important `Stock Holding Disclosure' report on the Angel website (Research Section).
Disclosure of Interest Statement Gateway Distriparks
1. Analyst ownership of the stock No
2. Angel and its Group companies ownership of the stock No
3. Angel and its Group companies’ Directors ownership of the stock No
4. Broking relationship with company covered No
Note: We have not considered any Exposure below Rs 1 lakh for Angel and its Group companies.
Address: Acme Plaza, ‘A’ Wing, 3rd Floor, M.V. Road, Opp. Sangam Cinema, Andheri (E), Mumbai - 400 059.
Tel : (022) 3952 4568 / 4040 3800
Angel Broking Ltd: BSE Sebi Regn No : INB 010996539 / CDSL Regn No: IN - DP - CDSL - 234 - 2004 / PMS Regn Code: PM/INP000001546 Angel Securities Ltd:BSE: INB010994639/INF010994639 NSE:
INB230994635/INF230994635 Membership numbers: BSE 028/NSE:09946
Angel Capital & Debt Market Ltd: INB 231279838 / NSE FNO: INF 231279838 / NSE Member code -12798 Angel Commodities Broking (P) Ltd: MCX Member ID: 12685 / FMC Regn No: MCX / TCM /
CORP / 0037 NCDEX : Member ID 00220 / FMC Regn No: NCDEX / TCM / CORP / 0302
April 30, 2010 7