1. 1QFY2011 Results Update | Agrichemical
July 21, 2010
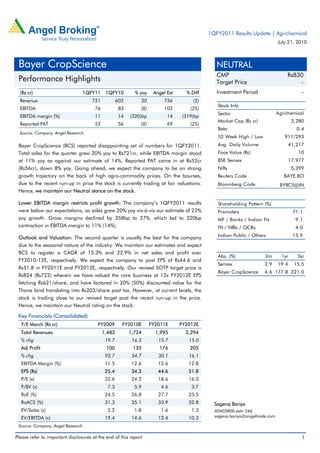
Bayer CropScience NEUTRAL
CMP Rs830
Performance Highlights Target Price -
(Rs cr) 1QFY11 1QFY10 % yoy Angel Est % Diff Investment Period -
Revenue 721 602 20 736 (2)
Stock Info
EBITDA 76 83 (8) 102 (25)
Sector Agrichemical
EBITDA margin (%) 11 14 (320)bp 14 (319)bp
Market Cap (Rs cr) 3,280
Reported PAT 52 56 (8) 69 (25)
Beta 0.4
Source: Company, Angel Research
52 Week High / Low 911/293
Bayer CropScience (BCS) reported disappointing set of numbers for 1QFY2011. Avg. Daily Volume 41,217
Total sales for the quarter grew 20% yoy to Rs721cr, while EBITDA margin stood Face Value (Rs) 10
at 11% yoy as against our estimate of 14%. Reported PAT came in at Rs52cr BSE Sensex 17,977
(Rs56cr), down 8% yoy. Going ahead, we expect the company to be on strong Nifty 5,399
growth trajectory on the back of high agro-commodity prices. On the bourses, Reuters Code BAYE.BO
due to the recent run-up in price the stock is currently trading at fair valuations. Bloomberg Code BYRCS@IN
Hence, we maintain our Neutral stance on the stock.
Lower EBITDA margin restricts profit growth: The company’s 1QFY2011 results Shareholding Pattern (%)
were below our expectations, as sales grew 20% yoy vis-à-vis our estimate of 22% Promoters 71.1
yoy growth. Gross margins declined by 358bp to 27%, which led to 320bp MF / Banks / Indian Fls 9.1
contraction in EBITDA margin to 11% (14%). FII / NRIs / OCBs 4.0
Indian Public / Others 15.9
Outlook and Valuation: The second quarter is usually the best for the company
due to the seasonal nature of the industry. We maintain our estimates and expect
BCS to register a CAGR of 15.3% and 22.9% in net sales and profit over
Abs. (%) 3m 1yr 3yr
FY2010-12E, respectively. We expect the company to post EPS of Rs44.6 and
Sensex 2.9 19.4 15.5
Rs51.8 in FY2011E and FY2012E, respectively. Our revised SOTP target price is
Bayer CropScience 4.6 177.8 221.0
Rs824 (Rs722) wherein we have valued the core business at 12x FY2012E EPS
fetching Rs621/share, and have factored in 20% (50%) discounted value for the
Thane land translating into Rs203/share post tax. However, at current levels, the
stock is trading close to our revised target post the recent run-up in the price.
Hence, we maintain our Neutral rating on the stock.
Key Financials (Consolidated)
Y/E March (Rs cr) FY2009 FY2010E FY2011E FY2012E
Total Revenues 1,483 1,724 1,995 2,294
% chg 19.7 16.3 15.7 15.0
Adj Profit 100 135 176 205
% chg 92.7 34.7 30.1 16.1
EBITDA Margin (%) 11.5 12.6 12.6 12.8
EPS (Rs) 25.4 34.3 44.6 51.8
P/E (x) 32.6 24.2 18.6 16.0
P/BV (x) 7.3 5.9 4.6 3.7
RoE (%) 24.5 26.8 27.7 25.5
RoACE (%) 31.3 35.1 33.9 32.8 Sageraj Bariya
EV/Sales (x) 2.2 1.8 1.6 1.3 40403800 extn 346
EV/EBITDA (x) 19.4 14.6 12.4 10.3 sageraj.bariya@angeltrade.com
Source: Company, Angel Research
Please refer to important disclosures at the end of this report 1
3. Bayer CropScience | 1QFY2011 Result Update
Sales growth below expectation
BCS reported lower-than-expected 1QFY2011 results wherein total revenues grew
by 20% as against our estimate of 22%.
Exhibit 2: Sales growth below expectation
800 25
700 21
20 20
600 17
15
500
(Rs cr) 10
(%)
400
5
300
0 0
200
100 (6) (5)
0 (10)
1QFY10 2QFY10 3QFY10 4QFY10 1QFY11
Total Revenue % YoY
Source: Company, Angel Research
Contraction in gross margin leads to decline in EBITDA margin
Gross margins declined by 358bp to 27.1% (30.7%). As a result, overall EBITDA
margin fell by 320bp to 10.6% (13.8%).
Exhibit 3: Margin trend
50
43 41
40 40
33
30 30
20
17
14
10 10 11
0 1
1QFY10 2QFY10 3QFY10 4QFY10 1QFY11
Gross margin (%) EBITDA %
Source: Company, Angel Research
July 21, 2010 3
4. Bayer CropScience | 1QFY2011 Result Update
Overall earnings below estimates
Total earnings for the quarter dipped by 8% yoy v/s our estimate of 22% yoy
growth due to lower EBITDA margin. BCS reported PAT of Rs52cr (Rs56cr).
Exhibit 4: PAT trend
70
60
60 56
52
50
40
(Rs cr)
30
21
20
10
0
(10) (4)
1QFY10 2QFY10 3QFY10 4QFY10 1QFY11
Source: Company, Angel Research
July 21, 2010 4
5. Bayer CropScience | 1QFY2011 Result Update
Investment Arguments
Leader in Indian markets: BCS is a leader in the Indian agrichemical sector with a
market share of 23%. The company's domestic revenues registered steady CAGR
of 19% over CY2005-FY2010, which indicates it’s stronghold in the domestic
business. Moreover, going ahead, we believe there exists substantial opportunity
for BCS to grow its domestic business considering the abysmal penetration of
pesticides in India. It may be noted that India consumes an average 0.48kg of
pesticides per hectare (ha) compared to 4.5kg/ha in USA and 10.7kg/ha in
Japan.
Exports - Riding the outsourcing bandwagon: BCS's export revenues registered
15% CAGR during CY2005-FY2010. Around 80% of the company's export
revenues come from outsourcing by Bayer AG's group companies. We believe this
indicates the company’s strong ability to grow internationally despite its parent
having a global presence. Globally, Bayer AG has a revenue base of Euro33bn, of
which 17% (Euro5.6bn) is from crop protection. Hence, if Bayer AG were to
outsource 10% of its requirements from its various global subsidiaries, we believe
that BCS would immensely benefit from the same.
Outlook and Valuation
The second quarter is usually the best for the company due to the seasonal nature
of the industry. We maintain our estimates and expect BCS to register a CAGR of
15.3% and 22.9% in net sales and profit over FY2010-12E, respectively. We
expect the company to post EPS of Rs44.6 and Rs51.8 in FY2011E and FY2012E,
respectively. Our revised SOTP target price is Rs824 (Rs722) wherein we have
valued the core business at 12x FY2012E EPS fetching Rs621/share, and have
factored in 20% (50%) discounted value for the Thane land translating into
Rs203/share post tax. However, at current levels, the stock is trading close to our
revised target post the recent run-up in the price. Hence, we maintain our Neutral
rating on the stock.
Exhibit 5: Key Assumption
FY2011E FY2012E
Revenue Growth 15.7 15.0
Gross Margins 38.5 38.5
Staff cost (% of sales) 8.2 8.2
Other cost (% of sales) 17.7 17.5
EBITDA Margins 12.6 12.8
Source: Company, Angel Research; Note: * - numbers are for 15 months
July 21, 2010 5
11. Bayer CropScience | 1QFY2011 Result Update
Research Team Tel: 022 - 4040 3800 E-mail: research@angeltrade.com Website: www.angeltrade.com
DISCLAIMER
This document is solely for the personal information of the recipient, and must not be singularly used as the basis of any investment
decision. Nothing in this document should be construed as investment or financial advice. Each recipient of this document should make
such investigations as they deem necessary to arrive at an independent evaluation of an investment in the securities of the companies
referred to in this document (including the merits and risks involved), and should consult their own advisors to determine the merits and
risks of such an investment.
Angel Broking Limited, its affiliates, directors, its proprietary trading and investment businesses may, from time to time, make
investment decisions that are inconsistent with or contradictory to the recommendations expressed herein. The views contained in this
document are those of the analyst, and the company may or may not subscribe to all the views expressed within.
Reports based on technical and derivative analysis center on studying charts of a stock's price movement, outstanding positions and
trading volume, as opposed to focusing on a company's fundamentals and, as such, may not match with a report on a company's
fundamentals.
The information in this document has been printed on the basis of publicly available information, internal data and other reliable
sources believed to be true, but we do not represent that it is accurate or complete and it should not be relied on as such, as this
document is for general guidance only. Angel Broking Limited or any of its affiliates/ group companies shall not be in any way
responsible for any loss or damage that may arise to any person from any inadvertent error in the information contained in this report.
Angel Broking Limited has not independently verified all the information contained within this document. Accordingly, we cannot testify,
nor make any representation or warranty, express or implied, to the accuracy, contents or data contained within this document. While
Angel Broking Limited endeavours to update on a reasonable basis the information discussed in this material, there may be regulatory,
compliance, or other reasons that prevent us from doing so.
This document is being supplied to you solely for your information, and its contents, information or data may not be reproduced,
redistributed or passed on, directly or indirectly.
Angel Broking Limited and its affiliates may seek to provide or have engaged in providing corporate finance, investment banking or
other advisory services in a merger or specific transaction to the companies referred to in this report, as on the date of this report or in
the past.
Neither Angel Broking Limited, nor its directors, employees or affiliates shall be liable for any loss or damage that may arise from or in
connection with the use of this information.
Note: Please refer to the important `Stock Holding Disclosure' report on the Angel website (Research Section). Also, please
refer to the latest update on respective stocks for the disclosure status in respect of those stocks. Angel Broking Limited and
its affiliates may have investment positions in the stocks recommended in this report.
Disclosure of Interest Statement Bayer CropScience
1. Analyst ownership of the stock No
2. Angel and its Group companies ownership of the stock Yes
3. Angel and its Group companies' Directors ownership of the stock No
4. Broking relationship with company covered No
Note: We have not considered any Exposure below Rs 1 lakh for Angel, its Group companies and Directors.
Ratings (Returns) : Buy (> 15%) Accumulate (5% to 15%) Neutral (-5 to 5%)
Reduce (-5% to 15%) Sell (< -15%)
July 21, 2010 11