SlideShare a Scribd company logo
1 of 8
Download to read offline
4QFY2010 Result Update I Capital Goods
                                                                                                                           May 28, 2010


  BHEL                                                                                     NEUTRAL
                                                                                           CMP                               Rs2,319
  Performance Highlights                                                                   Target Price                            -
  Bharat Heavy Electricals (BHEL) reported a strong 4QFY2010 performance,                  Investment Period                        -
  with a 28.6% and 41.7% yoy growth in its top and bottom-line, respectively, in
  line with the provisional results announced earlier. Currently, the stock trades at      Stock Info
  21.2x FY2011E EPS and at 17.8x FY2012E EPS. We maintain our Neutral view
                                                                                           Sector                     Capital Goods
  on the stock.
                                                                                           Market Cap (Rs cr)                113,520
  Operating margin expansion drives bottom-line growth: BHEL posted a healthy
                                                                                           Beta                                   0.8
  top-line growth of 28.6% yoy to Rs13,559cr (Rs10,540cr) for 4QFY2010, on
  the back of strong execution of the healthy order book. For the full year                52 WK High / Low               2,585/1,940
  FY2010, the top-line grew by 25.3% yoy to Rs32,880cr (Rs26,234cr).
                                                                                           Avg. Daily Volume                 120,599
  On the operating front, the company reported a continued expansion in the                Face Value (Rs)                         10
  EBITDA Margin by 225bp to 18.3% (16.1%). This was primarily driven by lower
  raw material costs, which reduced by 484bp to 59.2% (64.0%) of net sales, on             BSE Sensex                         16,863
  account of benefits of lower commodity prices. However, other expenses                   Nifty                                5,067
  increased sharply by 89.7% yoy, negating the positive impact on the margins.
  The rise was primarily led by the ~Rs453cr of provision against pension                  Reuters Code                      BHEL.BO
  schemes, coupled with changes in the accounting policy related to the provision
                                                                                           Bloomberg Code                    BHEL@IN
  for doubtful debts. Additionally, the employee costs also came in higher than
  the earlier guidance of the management.                                                  Shareholding Pattern (%)

  Consequently, the bottom-line grew by 41.7% yoy to Rs1,910cr (Rs1,348cr) for             Promoters                             67.7
  the quarter. For the full year FY2010, the net profit grew by 37.4% yoy to               MF/Banks/Indian FIs                   15.2
  Rs4,311cr (Rs3,138cr).
                                                                                           FII/NRIs/OCBs                         15.3
  Outlook and Valuation                                                                    Indian Public                          1.8

  The Indian power equipment market is in the midst of a structural change, with           Abs. (%)            3m     1yr          3yr
  intensifying competition, both from the domestic and the overseas players.               Sensex              2.6    18.0        17.1
  During FY2010-12E, we expect the company to post a top-line and bottom-line
  CAGR of 19.7% and 21.5%, respectively. At the CMP, the stock is quoting at               BHEL              (1.4)    9.5         70.3
  21.2x FY2011E EPS and at 17.8x FY2012E EPS. Given the structural long-term
  concerns, we maintain our Neutral view on the stock.

 Key Financials
 Y/E March (Rs cr)                 FY2009          FY2010         FY2011E   FY2012E
 Net Sales                         26,212           32,880         40,095    47,111
 % chg                                35.8             25.4          21.9      17.5
 Adj. Net Profit                     3,126           4,311          5,359     6,364
 % chg                                 9.3             37.9          24.3      18.8
 Operating EBITDA (%)                 13.9             16.9          18.1      18.1
 EPS (Rs)                             63.9             88.1         109.5     130.0
 P/E (x)                              36.3             26.3          21.2      17.8
 P/BV (x)                              8.8              7.1           5.7       4.6
 RoE (%)                              26.4             29.9          30.0      28.6
 RoCE (%)                             28.9             33.3          31.8      30.4
                                                                                          Puneet Bambha
 EV/Sales (x)                          3.9              3.2           2.5       2.1
                                                                                          Tel: 022 – 4040 3800 Ext: 347
 EV/EBITDA (x)                        24.8             18.6          12.8      10.6
                                                                                          E-mail: puneet.bambha@angeltrade.com
Source: Company, Angel Research


                                                                                                                                        1
Please refer to important disclosures at the end of this report                             Sebi Registration No: INB 010996539
BHEL I 4QFY2010 Result Update


               Segment-wise Performance

               During the quarter, the power division was the key driver, registering a robust 29.6%
               yoy top-line growth to Rs11,155cr (Rs8,608cr). On a positive note, the industry
               division also picked up pace during the quarter, registering revenue growth of
               15.9% yoy to Rs3,149cr (Rs2,716cr). Margins of both the divisions improved during
               the quarter, with the power division margin increasing 731bp to 27.4% (20.1%),
               and the industry division margin rising 404bp to 25.6% (21.5%).

               Exhibit 1: Segment-wise Performance
                Y/E March (Rs cr)            4QFY10       4QFY09    % chg    FY10     FY09    % chg
                Revenue
                Power                            11,155    8,608     29.6   26,861   21,344    25.8
                Industry                          3,149    2,716     15.9    7,879    7,250     8.7
                Total Revenues                   14,304   11,324     26.3   34,740   28,594    21.5
                EBIT
                Power                             3,058    1,731     76.7    6,317    3,862    63.6
                Industry                           805       584     37.7    1,643    1,215    35.2
                Total EBIT                        3,863    2,315     66.9    7,960    5,076    56.8
                Revenue Mix (%)
                Power                              78.0     76.0              77.3     74.6
                Industry                           22.0     24.0              22.7     25.4
                EBIT Margin (%)
                Power                              27.4     20.1              23.5     18.1
                Industry                           25.6     21.5              20.8     16.8
               Source: Company, Angel Research

               Exhibit 2: 4QFY210 Performance
                Y/E March (Rs cr)            4QFY10       4QFY09    % chg     FY10     FY09   % chg
                Net Sales                        13,559    10,540    28.6   32,880   26,234    25.3
                Raw Material                      8,027     6,751    18.9   19,307   15,969    20.9
                (% of Net Sales)                   59.2      64.0             58.7     60.9
                Employee Cost                     1,743     1,408    23.9    5,153    4,113    25.3
                (% of Net Sales)                   12.9      13.4             15.7     15.7
                Other Expenses                    1,301      686     89.7    2,854    2,351    21.4
                (% of Net Sales)                    9.6       6.5              8.7      9.0
                Total Expenditure                11,072     8,844    25.2   27,315   22,433    21.8
                EBITDA                            2,487     1,696    46.6    5,566    3,801    46.4
                EBITDA (%)                         18.3      16.1             16.9     14.5
                Interest                             18        8    119.8       34       31     9.1
                Depreciation                        165      101     63.4      458      334    37.0
                Other Income                        594      507     17.0    1,516    1,413     7.4
                Profit before Tax                 2,898     2,095    38.4    6,591    4,849    35.9
                (% of Net Sales)                   21.4      19.9             20.0     18.5
                Total Tax                           989      747     32.4    2,280    1,711    33.3
                (% of PBT)                         34.1      35.7             34.6     35.3
                Reported PAT                      1,910     1,348    41.7    4,311    3,138    37.4
                (% of Net Sales)                   14.1      12.8             13.1     12.0
               Source: Company, Angel Research


May 28, 2010                                                                                      2
BHEL I 4QFY2010 Result Update


               Order Flows

               The order inflows for 4QFY2010 grew by 45.1% yoy to Rs22,614cr (Rs15,580cr).
               For the full year FY2010, the order inflows were flat at Rs59,031cr (Rs59,687cr). The
               company expects order booking to maintain its momentum during the current
               financial year as well, and has guided for inflows of Rs59,000-60,000cr. The order
               backlog for the quarter increased 22.9% yoy and 7.3% qoq to Rs1,43,800cr.

               Exhibit 3: Quarterly Order Inflow
                          25,000
                                                                                                             22,614


                          20,000

                                                                     15,580                        16,000
                                       14,500    14,500    15,107
                          15,000
                (Rs cr)


                                                                               12,400

                          10,000
                                                                                         8,017


                           5,000


                              0
                                       Q109      Q209      Q309      Q409      Q110      Q210      Q310      Q410

               Source: Company, Angel Research


               Exhibit 4: Quarterly Order Backlog
                          160,000
                                                                                                             143,800
                          140,000                                                                  134,000
                                                                               124,403   125,800
                                                           113,584   117,000
                          120,000
                                                 104,000
                          100,000       95,000
                (Rs cr)


                           80,000

                           60,000

                           40,000

                           20,000

                                   0
                                        Q109      Q209      Q309      Q409      Q110      Q210      Q310      Q410

               Source: Company, Angel Research


May 28, 2010                                                                                                           3
BHEL I 4QFY2010 Result Update


               Outlook and Valuation

               The Indian power equipment market is in the midst of a structural change, with
               intensifying competition, both from the domestic and the overseas players. During
               FY2010-12E, we expect the company to post a top-line and bottom-line CAGR of
               19.7% and 21.5%, respectively. At the CMP of Rs2,319, the stock is quoting at 21.2x
               FY2011E EPS and at 17.8x FY2012E EPS. Given the structural long-term concerns,
               we maintain our Neutral view on the stock.

               Exhibit 5: 12-month Forward Rolling P/E Band

                                    4,500
                                    4,000                                                                                                                                                                                                                    36x

                                    3,500
                                                                                                                                                                                                                                                             28x
                Sh are Price (Rs)


                                    3,000
                                    2,500
                                                                                                                                                                                                                                                             20x
                                    2,000
                                    1,500
                                                                                                                                                                                                                                                             12x
                                    1,000
                                      500
                                           0
                                               Apr-01

                                                        Oct-01

                                                                   Apr-02

                                                                              Oct-02

                                                                                       Apr-03

                                                                                                     Oct-03

                                                                                                              Apr-04

                                                                                                                       Oct-04

                                                                                                                                    Apr-05

                                                                                                                                             Oct-05

                                                                                                                                                         Apr-06

                                                                                                                                                                    Oct-06

                                                                                                                                                                             Apr-07

                                                                                                                                                                                               Oct-07

                                                                                                                                                                                                        Apr-08

                                                                                                                                                                                                                  Oct-08

                                                                                                                                                                                                                              Apr-09

                                                                                                                                                                                                                                       Oct-09

                                                                                                                                                                                                                                                    Apr-10
               Source: C-line, Angel Research

               Exhibit 6: BHEL - Premium/Discount to Sensex P/E
                            100%

                                    80%

                                    60%

                                    40%

                                    20%

                                     0%

                                    -20%

                                    -40%
                                                          Oct-04


                                                                                            Oct-05


                                                                                                                                Oct-06


                                                                                                                                                                   Oct-07


                                                                                                                                                                                                         Oct-08


                                                                                                                                                                                                                                           Oct-09
                                           Apr-04


                                                                            Apr-05


                                                                                                              Apr-06


                                                                                                                                                Apr-07


                                                                                                                                                                                      Apr-08


                                                                                                                                                                                                                           Apr-09


                                                                                                                                                                                                                                                             Apr-10


               Source: C-line, Angel Research


May 28, 2010                                                                                                                                                                                                                                                          4
BHEL I 4QFY2010 Result Update


               Profit & Loss Statement                                                             (Rs cr)
                Y/E March                      FY2007    FY2008    FY2009    FY2010E   FY2011E   FY2012E
                Net Sales                      17,238    19,305    26,212     32,880    40,095    47,111
                Other operating income               -         -         -         -         -         -
                Total operating income         17,238    19,305    26,212     32,880    40,095    47,111
                % chg                            28.9       12.0      35.8      25.4      21.9      17.5
                Total Expenditure              14,038    16,024    22,569     27,315    32,847    38,562
                Net Raw Materials               9,487    10,662    16,030     19,307    24,045    28,841
                Other Mfg costs                 2,181     2,754     3,555      2,854     3,308     3,891
                Personnel                       2,369     2,608     2,984      5,153     5,495     5,829
                Other                                -         -         -         -         -         -
                EBITDA                          3,200     3,281     3,643      5,566     7,247     8,549
                % chg                            40.2        2.5      11.1      52.8      30.2      18.0
                (% of Net Sales)                 18.6       17.0      13.9      16.9      18.1      18.1
                Depreciation & Amortisation     273.0     297.2     334.3      458.0     579.2     685.9
                EBIT                            2,927     2,984     3,309      5,108     6,668     7,863
                % chg                            43.7        1.9      10.9      54.4      30.5      17.9
                (% of Net Sales)                 17.0       15.5      12.6      15.5      16.6      16.7
                Interest & other Charges         43.3      35.4      30.7       33.5      35.0      35.0
                Other Income                    823.6    1,444.8   1,497.4   1,516.4   1,611.7   1,963.1
                (% of PBT)                       22.2       32.9      31.4      23.0      19.5      20.0
                Others                               -         -         -         -         -         -
                Recurring PBT                   3,707     4,393     4,776      6,591     8,245     9,791
                % chg                            46.9       18.5       8.7      38.0      25.1      18.8
                Extraordinary Expense/(Inc.)    (28.9)    (37.4)    (73.1)         -         -         -
                PBT (reported)                  3,736     4,430     4,849      6,591     8,245     9,791
                Tax                             1,321     1,571     1,711      2,280     2,886     3,427
                (% of PBT)                       35.4       35.5      35.3      34.6      35.0      35.0
                PAT (reported)                  2,415     2,859     3,138      4,311     5,359     6,364
                Add: Share of earnings of
                                                     -         -         -         -         -         -
                associate
                Less: Minority interest (MI)         -         -         -         -         -         -
                Prior period items                   -         -         -         -         -         -
                PAT after MI (reported)         2,415     2,859     3,138      4,311     5,359     6,364
                ADJ. PAT                        2,414     2,860     3,126      4,311     5,359     6,364
                % chg                            44.1       18.5       9.3      37.9      24.3      18.8
                (% of Net Sales)                 14.0       14.8      11.9      13.1      13.4      13.5
                Basic EPS (Rs)                   98.6      58.4      63.9       88.1     109.5     130.0
                Fully Diluted EPS (Rs)           49.3      58.4      63.9       88.1     109.5     130.0
                % chg                            44.1       18.5       9.3      37.9      24.3      18.8


May 28, 2010                                                                                            5
BHEL I 4QFY2010 Result Update


               Balance Sheet                                                                                         (Rs cr)
                Y/E March                      FY2007    FY2008        FY2009        FY2010E        FY2011E        FY2012E
                SOURCES OF FUNDS
                Equity Share Capital              245       490           490            490            490            490
                Preference Capital                   -         -             -              -              -              -
                Reserves& Surplus               8,544    10,285        12,449         15,426         19,353         24,171
                Shareholders Funds              8,788    10,774        12,939         15,915         19,842         24,661
                Minority Interest                    -         -             -              -              -              -
                Total Loans                        89        95           149            128            128            128
                Deferred Tax Liability           (935)   (1,338)       (1,840)        (1,527)        (1,527)        (1,527)
                Total Liabilities               7,942     9,531        11,248         14,516         18,443         23,261
                APPLICATION OF FUNDS
                Gross Block                     4,135     4,443         5,225          7,827          8,722         10,877
                Less: Acc. Depreciation         3,146     3,462         3,754          4,171          4,750          5,436
                Net Block                         989       981         1,470          3,656          3,971          5,440
                Capital Work-in-Progress          303       658         1,157            289            895            239
                Goodwill                             -         -             -              -              -              -
                Investments                          8        8            52             80             80             80
                Current Assets                 20,980    27,906        36,901         42,933         50,985         58,863
                Cash                            5,809     8,386        10,315          9,788         12,720         15,165
                Loans & Advances                1,141     1,388         2,424          2,814          3,208          3,769
                Other                             200       421           350            407            392            509
                Current liabilities            14,337    20,022        28,333         32,442         37,488         41,361
                Net Current Assets              6,643     7,884         8,568         10,491         13,497         17,502
                Mis. Exp. not written off            -         -             -              -              -              -
                Total Assets                    7,942     9,531        11,248         14,516         18,443         23,261

               Cash Flow Statement                                                                                   (Rs cr)
                Y/E March                      FY2007    FY2008         FY2009        FY2010E        FY2011E        FY2012E
                Profit before tax               3,736      4,430         4,849          6,591          8,245          9,791
                Depreciation                      273        297           334            458            579            686
                (Inc)/Dec in Working Capital    1,043      1,336         1,244         (2,450)           (75)        (1,559)
                Less: Other income                447      1,023           983          1,516            970          1,209
                Direct taxes paid               1,484      1,974         2,213          2,280          2,886          3,427
                Others                             42         30           (18)           (41)                 -              -
                Cash Flow from Operations       3,163      3,097         3,214            762          4,894          4,282
                (Inc.)/Dec.in Fixed Assets      (431)      (664)        (1,280)        (1,734)        (1,500)        (1,500)
                (Inc.)/Dec. in Investments           -             -       (44)           (27)                 -              -
                Other income                      447      1,023           983          1,516            970          1,209
                Cash Flow from Investing           16        359          (341)          (245)          (530)          (291)
                Issue of Equity                      -             -             -              -              -              -
                Inc./(Dec.) in loans            (469)          6             54           (22)                 -              -
                Dividend Paid (Incl. Tax)         692        873           974          1,334          1,432          1,546
                Others                          (343)        (11)          (24)           313                  -              -
                Cash Flow from Financing       (1,161)     (868)          (919)        (1,356)        (1,432)        (1,546)
                Inc./(Dec.) in Cash             1,675      2,577         1,929           (527)         2,932          2,445
                Opening Cash balances           4,134      5,809         8,386         10,315          9,788         12,720
                Closing Cash balances           5,809      8,386        10,315          9,788         12,720         15,165


May 28, 2010                                                                                                              6
BHEL I 4QFY2010 Result Update


               Key Ratios
                Y/E March                         FY2007    FY2008    FY2009    FY2010E    FY2011E    FY2012E
                Valuation Ratios (x)
                P/E (on FDEPS)                      47.0      39.7      36.3       26.3       21.2       17.8
                P/CEPS                              42.2      36.0      32.8       23.8       19.1       16.1
                P/BV                                12.9      10.5       8.8        7.1        5.7        4.6
                Dividend yield (%)                   1.1       0.7       0.7        1.0        1.1        1.2
                EV/Sales                             6.3       5.5       3.9        3.2        2.5        2.1
                EV/EBITDA                           30.1      28.4      24.8       18.6       12.8       10.6
                EV/Total Assets                     12.1       9.7       7.9        6.5        5.0        4.0
                Per Share Data (Rs)
                EPS (Basic)                         98.6      58.4      63.9       88.1      109.5      130.0
                EPS (fully diluted)                 49.3      58.4      63.9       88.1      109.5      130.0
                Cash EPS                            54.9      64.5      70.7       97.4      121.3      144.0
                DPS                                 24.5      15.3      17.0       23.3       25.0       27.0
                Book Value                         179.5     220.1     264.3      325.1      405.3      503.8
                DuPont Analysis
                EBIT margin (%)                     17.0      15.5      12.6       15.5       16.6       16.7
                Tax retention ratio                  0.6       0.6       0.6        0.7        0.7        0.7
                Asset turnover (x)                   5.1       7.0      10.1        7.4        6.0        5.6
                ROIC (Post-tax) (%)                 55.8      69.6      82.4       75.1       65.0       61.2
                Cost of Debt (Post Tax) (%)          8.6      24.8      16.3       15.8       17.8       17.8
                Leverage (x)                        (0.7)     (0.8)     (0.8)      (0.6)      (0.6)      (0.6)
                Operating RoE (%)                   25.1      35.1      30.2       38.8       34.8       34.6
                Returns (%)
                RoCE (Pre-tax)                      39.5      34.5      31.9       35.1       40.6       38.5
                Angel RoIC (Pre-tax)               105.0     148.9     226.2      137.1      120.2      110.6
                RoE                                 30.0      29.2      26.4       29.9       30.0       28.6
                Turnover Ratios (x)
                Asset Turnover (Gross Block)         4.3       4.5       5.4        5.0        4.8        4.8
                Inventory / Sales (days)              84        94        95         95         94         92
                Receivables (days)                  178       204       195        204        200        195
                Payables (days)                       66        75        72         74         72         71
                Working capital cycle (ex-cash)
                                                      18        (9)     (24)          8          7         18
                (days)
                Solvency Ratios (x)
                Net debt to equity                  (0.7)     (0.8)     (0.8)      (0.6)      (0.6)      (0.6)
                Net debt to EBITDA                  (1.6)     (2.2)     (2.5)      (1.7)      (1.6)      (1.6)
                Interest Coverage (EBIT / Int.)     76.2      96.2     124.5      152.5      208.8      246.2


May 28, 2010                                                                                                7
BHEL I 4QFY2010 Result Update


Research Team Tel: 022- 4040 3800                                         E-mail: research@angeltrade.com                                       Website: www.angeltrade.com


DISCLAIMER

This document is solely for the personal information of the recipient, and must not be singularly used as the basis of any investment decision. Nothing in this
document should be construed as investment or financial advice. Each recipient of this document should make such investigations as they deem necessary to
arrive at an independent evaluation of an investment in the securities of the companies referred to in this document (including the merits and risks involved),
and should consult their own advisors to determine the merits and risks of such an investment.

Angel Securities Limited, its affiliates, directors, its proprietary trading and investment businesses may, from time to time, make investment decisions that are
inconsistent with or contradictory to the recommendations expressed herein. The views contained in this document are those of the analyst, and the company
may or may not subscribe to all the views expressed within.

Reports based on technical and derivative analysis center on studying charts of a stock's price movement, outstanding positions and trading volume, as
opposed to focusing on a company's fundamentals and, as such, may not match with a report on a company's fundamentals.

The information in this document has been printed on the basis of publicly available information, internal data and other reliable sources believed to be true,
and are for general guidance only. Angel Securities Limited has not independently verified all the information contained within this document. Accordingly,
we cannot testify, nor make any representation or warranty, express or implied, to the accuracy, contents or data contained within this document. While
Angel Securities Limited endeavours to update on a reasonable basis the information discussed in this material, there may be regulatory, compliance, or
other reasons that prevent us from doing so.

This document is being supplied to you solely for your information, and its contents, information or data may not be reproduced, redistributed or passed on,
directly or indirectly.

Angel Securities Limited and its affiliates may seek to provide or have engaged in providing corporate finance, investment banking or other advisory services
in a merger or specific transaction to the companies referred to in this report, as on the date of this report or in the past.

Neither Angel Securities Limited, nor its directors, employees or affiliates shall be liable for any loss or damage that may arise from or in connection with the
use of this information.
Note: Please refer to the important `Stock Holding Disclosure' report on the Angel website (Research Section).


 Disclosure of Interest Statement                                                                          BHEL
 1.    Analyst ownership of the stock                                                                       No
 2.    Angel and its Group companies ownership of the stock                                                 Yes
 3.    Angel and its Group companies’ Directors ownership of the stock                                      No
 4.    Broking relationship with company covered                                                            No
 Note: We have not considered any Exposure below Rs 1 lakh for Angel and its Group companies.


                                Address: Acme Plaza, ‘A’ Wing, 3rd Floor, M.V. Road, Opp. Sangam Cinema, Andheri (E), Mumbai - 400 059.
                                                                    Tel : (022) 3952 4568 / 4040 3800


    Angel Broking Ltd: BSE Sebi Regn No : INB 010996539 / CDSL Regn No: IN - DP - CDSL - 234 - 2004 / PMS Regn Code: PM/INP000001546 Angel Securities Ltd:BSE: INB010994639/INF010994639 NSE:
    INB230994635/INF230994635 Membership numbers: BSE 028/NSE:09946
    Angel Capital & Debt Market Ltd: INB 231279838 / NSE FNO: INF 231279838 / NSE Member code -12798 Angel Commodities Broking (P) Ltd: MCX Member ID: 12685 / FMC Regn No: MCX / TCM /
    CORP / 0037 NCDEX : Member ID 00220 / FMC Regn No: NCDEX / TCM / CORP / 0302


May 28, 2010                                                                                                                                                                                8

More Related Content

What's hot

Balaji ru4 qfy2010e-290410
Balaji  ru4 qfy2010e-290410Balaji  ru4 qfy2010e-290410
Balaji ru4 qfy2010e-290410Angel Broking
 
Bosch ru1 qcy2010-290410
Bosch ru1 qcy2010-290410Bosch ru1 qcy2010-290410
Bosch ru1 qcy2010-290410Angel Broking
 
Infosys - Result Update
Infosys  - Result UpdateInfosys  - Result Update
Infosys - Result UpdateAngel Broking
 
MPL Result Update 4qfy2010-030510-final
MPL Result Update 4qfy2010-030510-finalMPL Result Update 4qfy2010-030510-final
MPL Result Update 4qfy2010-030510-finalAngel Broking
 
Bgr energy ru4 qfy2010-010610
Bgr energy ru4 qfy2010-010610Bgr energy ru4 qfy2010-010610
Bgr energy ru4 qfy2010-010610Angel Broking
 
Gipcl ru4 qfy2010-260510
Gipcl ru4 qfy2010-260510Gipcl ru4 qfy2010-260510
Gipcl ru4 qfy2010-260510Angel Broking
 
Sail steel ru4 qfy2010-310510
Sail steel ru4 qfy2010-310510Sail steel ru4 qfy2010-310510
Sail steel ru4 qfy2010-310510Angel Broking
 
Hcl tech ru3 qfy2010-22042010
Hcl tech ru3 qfy2010-22042010Hcl tech ru3 qfy2010-22042010
Hcl tech ru3 qfy2010-22042010Angel Broking
 
Essel propack ru5 qcy2010-300410
Essel propack ru5 qcy2010-300410Essel propack ru5 qcy2010-300410
Essel propack ru5 qcy2010-300410Angel Broking
 
Infosys ru2 qfy2011-151010
Infosys  ru2 qfy2011-151010Infosys  ru2 qfy2011-151010
Infosys ru2 qfy2011-151010Angel Broking
 

What's hot (19)

BHEL -Result Update
BHEL -Result UpdateBHEL -Result Update
BHEL -Result Update
 
Balaji ru4 qfy2010e-290410
Balaji  ru4 qfy2010e-290410Balaji  ru4 qfy2010e-290410
Balaji ru4 qfy2010e-290410
 
Bosch ru1 qcy2010-290410
Bosch ru1 qcy2010-290410Bosch ru1 qcy2010-290410
Bosch ru1 qcy2010-290410
 
Mcnally Bharat
Mcnally BharatMcnally Bharat
Mcnally Bharat
 
Infosys - Result Update
Infosys  - Result UpdateInfosys  - Result Update
Infosys - Result Update
 
Dabur Result Update
Dabur Result UpdateDabur Result Update
Dabur Result Update
 
HT Media
HT MediaHT Media
HT Media
 
MPL Result Update 4qfy2010-030510-final
MPL Result Update 4qfy2010-030510-finalMPL Result Update 4qfy2010-030510-final
MPL Result Update 4qfy2010-030510-final
 
Exide Industries
Exide IndustriesExide Industries
Exide Industries
 
Bgr energy ru4 qfy2010-010610
Bgr energy ru4 qfy2010-010610Bgr energy ru4 qfy2010-010610
Bgr energy ru4 qfy2010-010610
 
Gipcl ru4 qfy2010-260510
Gipcl ru4 qfy2010-260510Gipcl ru4 qfy2010-260510
Gipcl ru4 qfy2010-260510
 
Exide
Exide Exide
Exide
 
Sail steel ru4 qfy2010-310510
Sail steel ru4 qfy2010-310510Sail steel ru4 qfy2010-310510
Sail steel ru4 qfy2010-310510
 
Greenply
Greenply Greenply
Greenply
 
Hcl tech ru3 qfy2010-22042010
Hcl tech ru3 qfy2010-22042010Hcl tech ru3 qfy2010-22042010
Hcl tech ru3 qfy2010-22042010
 
Wipro
Wipro  Wipro
Wipro
 
Asian Paints
Asian PaintsAsian Paints
Asian Paints
 
Essel propack ru5 qcy2010-300410
Essel propack ru5 qcy2010-300410Essel propack ru5 qcy2010-300410
Essel propack ru5 qcy2010-300410
 
Infosys ru2 qfy2011-151010
Infosys  ru2 qfy2011-151010Infosys  ru2 qfy2011-151010
Infosys ru2 qfy2011-151010
 

Viewers also liked

Hul ru2 qfy2011-251010
Hul ru2 qfy2011-251010Hul ru2 qfy2011-251010
Hul ru2 qfy2011-251010Angel Broking
 
Derivative Report 13th July 2011
Derivative Report 13th July 2011Derivative Report 13th July 2011
Derivative Report 13th July 2011Angel Broking
 
Technical Report - June 23, 2010
Technical Report - June 23, 2010Technical Report - June 23, 2010
Technical Report - June 23, 2010Angel Broking
 
Derivatives report 29 oct-2010
Derivatives report 29 oct-2010Derivatives report 29 oct-2010
Derivatives report 29 oct-2010Angel Broking
 
Market%20outlook%2008.07.2011
Market%20outlook%2008.07.2011Market%20outlook%2008.07.2011
Market%20outlook%2008.07.2011Angel Broking
 
Derivative report 19th July 2011
Derivative report 19th July 2011Derivative report 19th July 2011
Derivative report 19th July 2011Angel Broking
 

Viewers also liked (7)

Hul ru2 qfy2011-251010
Hul ru2 qfy2011-251010Hul ru2 qfy2011-251010
Hul ru2 qfy2011-251010
 
Derivative Report 13th July 2011
Derivative Report 13th July 2011Derivative Report 13th July 2011
Derivative Report 13th July 2011
 
Technical Report - June 23, 2010
Technical Report - June 23, 2010Technical Report - June 23, 2010
Technical Report - June 23, 2010
 
Derivatives report 29 oct-2010
Derivatives report 29 oct-2010Derivatives report 29 oct-2010
Derivatives report 29 oct-2010
 
GCPL
GCPLGCPL
GCPL
 
Market%20outlook%2008.07.2011
Market%20outlook%2008.07.2011Market%20outlook%2008.07.2011
Market%20outlook%2008.07.2011
 
Derivative report 19th July 2011
Derivative report 19th July 2011Derivative report 19th July 2011
Derivative report 19th July 2011
 

Similar to Bhel ru4 qfy2010-280510

Similar to Bhel ru4 qfy2010-280510 (19)

Cesc
Cesc Cesc
Cesc
 
Bajaj Electricals
Bajaj ElectricalsBajaj Electricals
Bajaj Electricals
 
Cccl ru4 qfy2010-100510
Cccl  ru4 qfy2010-100510Cccl  ru4 qfy2010-100510
Cccl ru4 qfy2010-100510
 
BGR Energy
BGR EnergyBGR Energy
BGR Energy
 
Bharat Forge
Bharat ForgeBharat Forge
Bharat Forge
 
Itc ru4 qfy2010-22-05-10
Itc ru4 qfy2010-22-05-10Itc ru4 qfy2010-22-05-10
Itc ru4 qfy2010-22-05-10
 
Ashok leyland ru4 qfy2010-300410
Ashok leyland ru4 qfy2010-300410Ashok leyland ru4 qfy2010-300410
Ashok leyland ru4 qfy2010-300410
 
Hul ru4 qfy2010-250510
Hul ru4 qfy2010-250510Hul ru4 qfy2010-250510
Hul ru4 qfy2010-250510
 
CCCl
CCClCCCl
CCCl
 
GKS Consumer Result Update
GKS Consumer Result UpdateGKS Consumer Result Update
GKS Consumer Result Update
 
GSK con ru1 qcy2010-230410
GSK con ru1 qcy2010-230410GSK con ru1 qcy2010-230410
GSK con ru1 qcy2010-230410
 
Tata motors ru4 qfy2010-280510
Tata motors  ru4 qfy2010-280510Tata motors  ru4 qfy2010-280510
Tata motors ru4 qfy2010-280510
 
HCL Tech
HCL Tech  HCL Tech
HCL Tech
 
3i Infotech
3i Infotech3i Infotech
3i Infotech
 
Tvs motor ru4 qfy2010-21042010
Tvs motor ru4 qfy2010-21042010Tvs motor ru4 qfy2010-21042010
Tvs motor ru4 qfy2010-21042010
 
Idea Cellular
Idea  CellularIdea  Cellular
Idea Cellular
 
Tech Mahindra
Tech Mahindra Tech Mahindra
Tech Mahindra
 
Crompton Greaves
Crompton Greaves Crompton Greaves
Crompton Greaves
 
Ptc ru4 qfy2010-300410
Ptc ru4 qfy2010-300410Ptc ru4 qfy2010-300410
Ptc ru4 qfy2010-300410
 

More from Angel Broking

Market outlook 110612
Market outlook 110612Market outlook 110612
Market outlook 110612Angel Broking
 
Axis%20 bank ru1qfy2012-220711
Axis%20 bank ru1qfy2012-220711Axis%20 bank ru1qfy2012-220711
Axis%20 bank ru1qfy2012-220711Angel Broking
 
Electrosteel castings
Electrosteel castingsElectrosteel castings
Electrosteel castingsAngel Broking
 
Market outlook 19th July 2011
Market outlook 19th July 2011Market outlook 19th July 2011
Market outlook 19th July 2011Angel Broking
 
Weekly Report 18th July 2011
Weekly Report 18th July 2011Weekly Report 18th July 2011
Weekly Report 18th July 2011Angel Broking
 
Derivative Report 18th July 2011
Derivative Report 18th July 2011Derivative Report 18th July 2011
Derivative Report 18th July 2011Angel Broking
 
Technical Report 18th July 2011
Technical Report 18th July 2011Technical Report 18th July 2011
Technical Report 18th July 2011Angel Broking
 
Market Outlook 18th July 2011
Market Outlook 18th July 2011Market Outlook 18th July 2011
Market Outlook 18th July 2011Angel Broking
 
Bajaj auto Result Updated
Bajaj auto Result UpdatedBajaj auto Result Updated
Bajaj auto Result UpdatedAngel Broking
 
Tata consultancy services
Tata consultancy services Tata consultancy services
Tata consultancy services Angel Broking
 
Derivatives Report 15th July 2011
Derivatives Report 15th July 2011Derivatives Report 15th July 2011
Derivatives Report 15th July 2011Angel Broking
 
Technical Report 15th July 2011
Technical Report 15th July 2011Technical Report 15th July 2011
Technical Report 15th July 2011Angel Broking
 
Infosys Result Updated
Infosys Result UpdatedInfosys Result Updated
Infosys Result UpdatedAngel Broking
 
Technical Report 13th July 2011
Technical Report 13th July 2011Technical Report 13th July 2011
Technical Report 13th July 2011Angel Broking
 
Market Outlook 13th July 2011
Market Outlook 13th July 2011Market Outlook 13th July 2011
Market Outlook 13th July 2011Angel Broking
 

More from Angel Broking (20)

Market outlook 110612
Market outlook 110612Market outlook 110612
Market outlook 110612
 
Axis%20 bank ru1qfy2012-220711
Axis%20 bank ru1qfy2012-220711Axis%20 bank ru1qfy2012-220711
Axis%20 bank ru1qfy2012-220711
 
Electrosteel castings
Electrosteel castingsElectrosteel castings
Electrosteel castings
 
Persistent systems
Persistent systemsPersistent systems
Persistent systems
 
Ht media
Ht mediaHt media
Ht media
 
Market outlook 19th July 2011
Market outlook 19th July 2011Market outlook 19th July 2011
Market outlook 19th July 2011
 
Telecom sector
Telecom sectorTelecom sector
Telecom sector
 
Weekly Report 18th July 2011
Weekly Report 18th July 2011Weekly Report 18th July 2011
Weekly Report 18th July 2011
 
Derivative Report 18th July 2011
Derivative Report 18th July 2011Derivative Report 18th July 2011
Derivative Report 18th July 2011
 
Technical Report 18th July 2011
Technical Report 18th July 2011Technical Report 18th July 2011
Technical Report 18th July 2011
 
Market Outlook 18th July 2011
Market Outlook 18th July 2011Market Outlook 18th July 2011
Market Outlook 18th July 2011
 
South Indian Bank
 South Indian Bank South Indian Bank
South Indian Bank
 
Bajaj auto Result Updated
Bajaj auto Result UpdatedBajaj auto Result Updated
Bajaj auto Result Updated
 
Tata consultancy services
Tata consultancy services Tata consultancy services
Tata consultancy services
 
Fc4 e63c4d01
Fc4 e63c4d01Fc4 e63c4d01
Fc4 e63c4d01
 
Derivatives Report 15th July 2011
Derivatives Report 15th July 2011Derivatives Report 15th July 2011
Derivatives Report 15th July 2011
 
Technical Report 15th July 2011
Technical Report 15th July 2011Technical Report 15th July 2011
Technical Report 15th July 2011
 
Infosys Result Updated
Infosys Result UpdatedInfosys Result Updated
Infosys Result Updated
 
Technical Report 13th July 2011
Technical Report 13th July 2011Technical Report 13th July 2011
Technical Report 13th July 2011
 
Market Outlook 13th July 2011
Market Outlook 13th July 2011Market Outlook 13th July 2011
Market Outlook 13th July 2011
 

Recently uploaded

VIP Kolkata Call Girl Howrah 👉 8250192130 Available With Room
VIP Kolkata Call Girl Howrah 👉 8250192130  Available With RoomVIP Kolkata Call Girl Howrah 👉 8250192130  Available With Room
VIP Kolkata Call Girl Howrah 👉 8250192130 Available With Roomdivyansh0kumar0
 
Pharma Works Profile of Karan Communications
Pharma Works Profile of Karan CommunicationsPharma Works Profile of Karan Communications
Pharma Works Profile of Karan Communicationskarancommunications
 
Sales & Marketing Alignment: How to Synergize for Success
Sales & Marketing Alignment: How to Synergize for SuccessSales & Marketing Alignment: How to Synergize for Success
Sales & Marketing Alignment: How to Synergize for SuccessAggregage
 
A DAY IN THE LIFE OF A SALESMAN / WOMAN
A DAY IN THE LIFE OF A  SALESMAN / WOMANA DAY IN THE LIFE OF A  SALESMAN / WOMAN
A DAY IN THE LIFE OF A SALESMAN / WOMANIlamathiKannappan
 
RE Capital's Visionary Leadership under Newman Leech
RE Capital's Visionary Leadership under Newman LeechRE Capital's Visionary Leadership under Newman Leech
RE Capital's Visionary Leadership under Newman LeechNewman George Leech
 
0183760ssssssssssssssssssssssssssss00101011 (27).pdf
0183760ssssssssssssssssssssssssssss00101011 (27).pdf0183760ssssssssssssssssssssssssssss00101011 (27).pdf
0183760ssssssssssssssssssssssssssss00101011 (27).pdfRenandantas16
 
Call Girls Navi Mumbai Just Call 9907093804 Top Class Call Girl Service Avail...
Call Girls Navi Mumbai Just Call 9907093804 Top Class Call Girl Service Avail...Call Girls Navi Mumbai Just Call 9907093804 Top Class Call Girl Service Avail...
Call Girls Navi Mumbai Just Call 9907093804 Top Class Call Girl Service Avail...Dipal Arora
 
Vip Dewas Call Girls #9907093804 Contact Number Escorts Service Dewas
Vip Dewas Call Girls #9907093804 Contact Number Escorts Service DewasVip Dewas Call Girls #9907093804 Contact Number Escorts Service Dewas
Vip Dewas Call Girls #9907093804 Contact Number Escorts Service Dewasmakika9823
 
Call Girls in Mehrauli Delhi 💯Call Us 🔝8264348440🔝
Call Girls in Mehrauli Delhi 💯Call Us 🔝8264348440🔝Call Girls in Mehrauli Delhi 💯Call Us 🔝8264348440🔝
Call Girls in Mehrauli Delhi 💯Call Us 🔝8264348440🔝soniya singh
 
Tech Startup Growth Hacking 101 - Basics on Growth Marketing
Tech Startup Growth Hacking 101  - Basics on Growth MarketingTech Startup Growth Hacking 101  - Basics on Growth Marketing
Tech Startup Growth Hacking 101 - Basics on Growth MarketingShawn Pang
 
VIP Call Girl Jamshedpur Aashi 8250192130 Independent Escort Service Jamshedpur
VIP Call Girl Jamshedpur Aashi 8250192130 Independent Escort Service JamshedpurVIP Call Girl Jamshedpur Aashi 8250192130 Independent Escort Service Jamshedpur
VIP Call Girl Jamshedpur Aashi 8250192130 Independent Escort Service JamshedpurSuhani Kapoor
 
Call Girls Pune Just Call 9907093804 Top Class Call Girl Service Available
Call Girls Pune Just Call 9907093804 Top Class Call Girl Service AvailableCall Girls Pune Just Call 9907093804 Top Class Call Girl Service Available
Call Girls Pune Just Call 9907093804 Top Class Call Girl Service AvailableDipal Arora
 
GD Birla and his contribution in management
GD Birla and his contribution in managementGD Birla and his contribution in management
GD Birla and his contribution in managementchhavia330
 
Non Text Magic Studio Magic Design for Presentations L&P.pptx
Non Text Magic Studio Magic Design for Presentations L&P.pptxNon Text Magic Studio Magic Design for Presentations L&P.pptx
Non Text Magic Studio Magic Design for Presentations L&P.pptxAbhayThakur200703
 
VIP Call Girls Pune Kirti 8617697112 Independent Escort Service Pune
VIP Call Girls Pune Kirti 8617697112 Independent Escort Service PuneVIP Call Girls Pune Kirti 8617697112 Independent Escort Service Pune
VIP Call Girls Pune Kirti 8617697112 Independent Escort Service PuneCall girls in Ahmedabad High profile
 
Mondelez State of Snacking and Future Trends 2023
Mondelez State of Snacking and Future Trends 2023Mondelez State of Snacking and Future Trends 2023
Mondelez State of Snacking and Future Trends 2023Neil Kimberley
 
M.C Lodges -- Guest House in Jhang.
M.C Lodges --  Guest House in Jhang.M.C Lodges --  Guest House in Jhang.
M.C Lodges -- Guest House in Jhang.Aaiza Hassan
 
Call Girls in Gomti Nagar - 7388211116 - With room Service
Call Girls in Gomti Nagar - 7388211116  - With room ServiceCall Girls in Gomti Nagar - 7388211116  - With room Service
Call Girls in Gomti Nagar - 7388211116 - With room Servicediscovermytutordmt
 
Call Girls In Connaught Place Delhi ❤️88604**77959_Russian 100% Genuine Escor...
Call Girls In Connaught Place Delhi ❤️88604**77959_Russian 100% Genuine Escor...Call Girls In Connaught Place Delhi ❤️88604**77959_Russian 100% Genuine Escor...
Call Girls In Connaught Place Delhi ❤️88604**77959_Russian 100% Genuine Escor...lizamodels9
 

Recently uploaded (20)

VIP Kolkata Call Girl Howrah 👉 8250192130 Available With Room
VIP Kolkata Call Girl Howrah 👉 8250192130  Available With RoomVIP Kolkata Call Girl Howrah 👉 8250192130  Available With Room
VIP Kolkata Call Girl Howrah 👉 8250192130 Available With Room
 
Pharma Works Profile of Karan Communications
Pharma Works Profile of Karan CommunicationsPharma Works Profile of Karan Communications
Pharma Works Profile of Karan Communications
 
Sales & Marketing Alignment: How to Synergize for Success
Sales & Marketing Alignment: How to Synergize for SuccessSales & Marketing Alignment: How to Synergize for Success
Sales & Marketing Alignment: How to Synergize for Success
 
A DAY IN THE LIFE OF A SALESMAN / WOMAN
A DAY IN THE LIFE OF A  SALESMAN / WOMANA DAY IN THE LIFE OF A  SALESMAN / WOMAN
A DAY IN THE LIFE OF A SALESMAN / WOMAN
 
RE Capital's Visionary Leadership under Newman Leech
RE Capital's Visionary Leadership under Newman LeechRE Capital's Visionary Leadership under Newman Leech
RE Capital's Visionary Leadership under Newman Leech
 
0183760ssssssssssssssssssssssssssss00101011 (27).pdf
0183760ssssssssssssssssssssssssssss00101011 (27).pdf0183760ssssssssssssssssssssssssssss00101011 (27).pdf
0183760ssssssssssssssssssssssssssss00101011 (27).pdf
 
Call Girls Navi Mumbai Just Call 9907093804 Top Class Call Girl Service Avail...
Call Girls Navi Mumbai Just Call 9907093804 Top Class Call Girl Service Avail...Call Girls Navi Mumbai Just Call 9907093804 Top Class Call Girl Service Avail...
Call Girls Navi Mumbai Just Call 9907093804 Top Class Call Girl Service Avail...
 
Vip Dewas Call Girls #9907093804 Contact Number Escorts Service Dewas
Vip Dewas Call Girls #9907093804 Contact Number Escorts Service DewasVip Dewas Call Girls #9907093804 Contact Number Escorts Service Dewas
Vip Dewas Call Girls #9907093804 Contact Number Escorts Service Dewas
 
Forklift Operations: Safety through Cartoons
Forklift Operations: Safety through CartoonsForklift Operations: Safety through Cartoons
Forklift Operations: Safety through Cartoons
 
Call Girls in Mehrauli Delhi 💯Call Us 🔝8264348440🔝
Call Girls in Mehrauli Delhi 💯Call Us 🔝8264348440🔝Call Girls in Mehrauli Delhi 💯Call Us 🔝8264348440🔝
Call Girls in Mehrauli Delhi 💯Call Us 🔝8264348440🔝
 
Tech Startup Growth Hacking 101 - Basics on Growth Marketing
Tech Startup Growth Hacking 101  - Basics on Growth MarketingTech Startup Growth Hacking 101  - Basics on Growth Marketing
Tech Startup Growth Hacking 101 - Basics on Growth Marketing
 
VIP Call Girl Jamshedpur Aashi 8250192130 Independent Escort Service Jamshedpur
VIP Call Girl Jamshedpur Aashi 8250192130 Independent Escort Service JamshedpurVIP Call Girl Jamshedpur Aashi 8250192130 Independent Escort Service Jamshedpur
VIP Call Girl Jamshedpur Aashi 8250192130 Independent Escort Service Jamshedpur
 
Call Girls Pune Just Call 9907093804 Top Class Call Girl Service Available
Call Girls Pune Just Call 9907093804 Top Class Call Girl Service AvailableCall Girls Pune Just Call 9907093804 Top Class Call Girl Service Available
Call Girls Pune Just Call 9907093804 Top Class Call Girl Service Available
 
GD Birla and his contribution in management
GD Birla and his contribution in managementGD Birla and his contribution in management
GD Birla and his contribution in management
 
Non Text Magic Studio Magic Design for Presentations L&P.pptx
Non Text Magic Studio Magic Design for Presentations L&P.pptxNon Text Magic Studio Magic Design for Presentations L&P.pptx
Non Text Magic Studio Magic Design for Presentations L&P.pptx
 
VIP Call Girls Pune Kirti 8617697112 Independent Escort Service Pune
VIP Call Girls Pune Kirti 8617697112 Independent Escort Service PuneVIP Call Girls Pune Kirti 8617697112 Independent Escort Service Pune
VIP Call Girls Pune Kirti 8617697112 Independent Escort Service Pune
 
Mondelez State of Snacking and Future Trends 2023
Mondelez State of Snacking and Future Trends 2023Mondelez State of Snacking and Future Trends 2023
Mondelez State of Snacking and Future Trends 2023
 
M.C Lodges -- Guest House in Jhang.
M.C Lodges --  Guest House in Jhang.M.C Lodges --  Guest House in Jhang.
M.C Lodges -- Guest House in Jhang.
 
Call Girls in Gomti Nagar - 7388211116 - With room Service
Call Girls in Gomti Nagar - 7388211116  - With room ServiceCall Girls in Gomti Nagar - 7388211116  - With room Service
Call Girls in Gomti Nagar - 7388211116 - With room Service
 
Call Girls In Connaught Place Delhi ❤️88604**77959_Russian 100% Genuine Escor...
Call Girls In Connaught Place Delhi ❤️88604**77959_Russian 100% Genuine Escor...Call Girls In Connaught Place Delhi ❤️88604**77959_Russian 100% Genuine Escor...
Call Girls In Connaught Place Delhi ❤️88604**77959_Russian 100% Genuine Escor...
 

Bhel ru4 qfy2010-280510

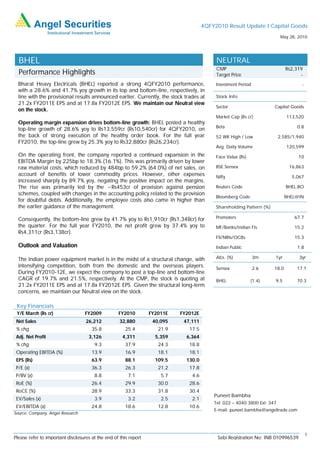
  • 1. 4QFY2010 Result Update I Capital Goods May 28, 2010 BHEL NEUTRAL CMP Rs2,319 Performance Highlights Target Price - Bharat Heavy Electricals (BHEL) reported a strong 4QFY2010 performance, Investment Period - with a 28.6% and 41.7% yoy growth in its top and bottom-line, respectively, in line with the provisional results announced earlier. Currently, the stock trades at Stock Info 21.2x FY2011E EPS and at 17.8x FY2012E EPS. We maintain our Neutral view Sector Capital Goods on the stock. Market Cap (Rs cr) 113,520 Operating margin expansion drives bottom-line growth: BHEL posted a healthy Beta 0.8 top-line growth of 28.6% yoy to Rs13,559cr (Rs10,540cr) for 4QFY2010, on the back of strong execution of the healthy order book. For the full year 52 WK High / Low 2,585/1,940 FY2010, the top-line grew by 25.3% yoy to Rs32,880cr (Rs26,234cr). Avg. Daily Volume 120,599 On the operating front, the company reported a continued expansion in the Face Value (Rs) 10 EBITDA Margin by 225bp to 18.3% (16.1%). This was primarily driven by lower raw material costs, which reduced by 484bp to 59.2% (64.0%) of net sales, on BSE Sensex 16,863 account of benefits of lower commodity prices. However, other expenses Nifty 5,067 increased sharply by 89.7% yoy, negating the positive impact on the margins. The rise was primarily led by the ~Rs453cr of provision against pension Reuters Code BHEL.BO schemes, coupled with changes in the accounting policy related to the provision Bloomberg Code BHEL@IN for doubtful debts. Additionally, the employee costs also came in higher than the earlier guidance of the management. Shareholding Pattern (%) Consequently, the bottom-line grew by 41.7% yoy to Rs1,910cr (Rs1,348cr) for Promoters 67.7 the quarter. For the full year FY2010, the net profit grew by 37.4% yoy to MF/Banks/Indian FIs 15.2 Rs4,311cr (Rs3,138cr). FII/NRIs/OCBs 15.3 Outlook and Valuation Indian Public 1.8 The Indian power equipment market is in the midst of a structural change, with Abs. (%) 3m 1yr 3yr intensifying competition, both from the domestic and the overseas players. Sensex 2.6 18.0 17.1 During FY2010-12E, we expect the company to post a top-line and bottom-line CAGR of 19.7% and 21.5%, respectively. At the CMP, the stock is quoting at BHEL (1.4) 9.5 70.3 21.2x FY2011E EPS and at 17.8x FY2012E EPS. Given the structural long-term concerns, we maintain our Neutral view on the stock. Key Financials Y/E March (Rs cr) FY2009 FY2010 FY2011E FY2012E Net Sales 26,212 32,880 40,095 47,111 % chg 35.8 25.4 21.9 17.5 Adj. Net Profit 3,126 4,311 5,359 6,364 % chg 9.3 37.9 24.3 18.8 Operating EBITDA (%) 13.9 16.9 18.1 18.1 EPS (Rs) 63.9 88.1 109.5 130.0 P/E (x) 36.3 26.3 21.2 17.8 P/BV (x) 8.8 7.1 5.7 4.6 RoE (%) 26.4 29.9 30.0 28.6 RoCE (%) 28.9 33.3 31.8 30.4 Puneet Bambha EV/Sales (x) 3.9 3.2 2.5 2.1 Tel: 022 – 4040 3800 Ext: 347 EV/EBITDA (x) 24.8 18.6 12.8 10.6 E-mail: puneet.bambha@angeltrade.com Source: Company, Angel Research 1 Please refer to important disclosures at the end of this report Sebi Registration No: INB 010996539
  • 2. BHEL I 4QFY2010 Result Update Segment-wise Performance During the quarter, the power division was the key driver, registering a robust 29.6% yoy top-line growth to Rs11,155cr (Rs8,608cr). On a positive note, the industry division also picked up pace during the quarter, registering revenue growth of 15.9% yoy to Rs3,149cr (Rs2,716cr). Margins of both the divisions improved during the quarter, with the power division margin increasing 731bp to 27.4% (20.1%), and the industry division margin rising 404bp to 25.6% (21.5%). Exhibit 1: Segment-wise Performance Y/E March (Rs cr) 4QFY10 4QFY09 % chg FY10 FY09 % chg Revenue Power 11,155 8,608 29.6 26,861 21,344 25.8 Industry 3,149 2,716 15.9 7,879 7,250 8.7 Total Revenues 14,304 11,324 26.3 34,740 28,594 21.5 EBIT Power 3,058 1,731 76.7 6,317 3,862 63.6 Industry 805 584 37.7 1,643 1,215 35.2 Total EBIT 3,863 2,315 66.9 7,960 5,076 56.8 Revenue Mix (%) Power 78.0 76.0 77.3 74.6 Industry 22.0 24.0 22.7 25.4 EBIT Margin (%) Power 27.4 20.1 23.5 18.1 Industry 25.6 21.5 20.8 16.8 Source: Company, Angel Research Exhibit 2: 4QFY210 Performance Y/E March (Rs cr) 4QFY10 4QFY09 % chg FY10 FY09 % chg Net Sales 13,559 10,540 28.6 32,880 26,234 25.3 Raw Material 8,027 6,751 18.9 19,307 15,969 20.9 (% of Net Sales) 59.2 64.0 58.7 60.9 Employee Cost 1,743 1,408 23.9 5,153 4,113 25.3 (% of Net Sales) 12.9 13.4 15.7 15.7 Other Expenses 1,301 686 89.7 2,854 2,351 21.4 (% of Net Sales) 9.6 6.5 8.7 9.0 Total Expenditure 11,072 8,844 25.2 27,315 22,433 21.8 EBITDA 2,487 1,696 46.6 5,566 3,801 46.4 EBITDA (%) 18.3 16.1 16.9 14.5 Interest 18 8 119.8 34 31 9.1 Depreciation 165 101 63.4 458 334 37.0 Other Income 594 507 17.0 1,516 1,413 7.4 Profit before Tax 2,898 2,095 38.4 6,591 4,849 35.9 (% of Net Sales) 21.4 19.9 20.0 18.5 Total Tax 989 747 32.4 2,280 1,711 33.3 (% of PBT) 34.1 35.7 34.6 35.3 Reported PAT 1,910 1,348 41.7 4,311 3,138 37.4 (% of Net Sales) 14.1 12.8 13.1 12.0 Source: Company, Angel Research May 28, 2010 2
  • 3. BHEL I 4QFY2010 Result Update Order Flows The order inflows for 4QFY2010 grew by 45.1% yoy to Rs22,614cr (Rs15,580cr). For the full year FY2010, the order inflows were flat at Rs59,031cr (Rs59,687cr). The company expects order booking to maintain its momentum during the current financial year as well, and has guided for inflows of Rs59,000-60,000cr. The order backlog for the quarter increased 22.9% yoy and 7.3% qoq to Rs1,43,800cr. Exhibit 3: Quarterly Order Inflow 25,000 22,614 20,000 15,580 16,000 14,500 14,500 15,107 15,000 (Rs cr) 12,400 10,000 8,017 5,000 0 Q109 Q209 Q309 Q409 Q110 Q210 Q310 Q410 Source: Company, Angel Research Exhibit 4: Quarterly Order Backlog 160,000 143,800 140,000 134,000 124,403 125,800 113,584 117,000 120,000 104,000 100,000 95,000 (Rs cr) 80,000 60,000 40,000 20,000 0 Q109 Q209 Q309 Q409 Q110 Q210 Q310 Q410 Source: Company, Angel Research May 28, 2010 3
  • 4. BHEL I 4QFY2010 Result Update Outlook and Valuation The Indian power equipment market is in the midst of a structural change, with intensifying competition, both from the domestic and the overseas players. During FY2010-12E, we expect the company to post a top-line and bottom-line CAGR of 19.7% and 21.5%, respectively. At the CMP of Rs2,319, the stock is quoting at 21.2x FY2011E EPS and at 17.8x FY2012E EPS. Given the structural long-term concerns, we maintain our Neutral view on the stock. Exhibit 5: 12-month Forward Rolling P/E Band 4,500 4,000 36x 3,500 28x Sh are Price (Rs) 3,000 2,500 20x 2,000 1,500 12x 1,000 500 0 Apr-01 Oct-01 Apr-02 Oct-02 Apr-03 Oct-03 Apr-04 Oct-04 Apr-05 Oct-05 Apr-06 Oct-06 Apr-07 Oct-07 Apr-08 Oct-08 Apr-09 Oct-09 Apr-10 Source: C-line, Angel Research Exhibit 6: BHEL - Premium/Discount to Sensex P/E 100% 80% 60% 40% 20% 0% -20% -40% Oct-04 Oct-05 Oct-06 Oct-07 Oct-08 Oct-09 Apr-04 Apr-05 Apr-06 Apr-07 Apr-08 Apr-09 Apr-10 Source: C-line, Angel Research May 28, 2010 4
  • 5. BHEL I 4QFY2010 Result Update Profit & Loss Statement (Rs cr) Y/E March FY2007 FY2008 FY2009 FY2010E FY2011E FY2012E Net Sales 17,238 19,305 26,212 32,880 40,095 47,111 Other operating income - - - - - - Total operating income 17,238 19,305 26,212 32,880 40,095 47,111 % chg 28.9 12.0 35.8 25.4 21.9 17.5 Total Expenditure 14,038 16,024 22,569 27,315 32,847 38,562 Net Raw Materials 9,487 10,662 16,030 19,307 24,045 28,841 Other Mfg costs 2,181 2,754 3,555 2,854 3,308 3,891 Personnel 2,369 2,608 2,984 5,153 5,495 5,829 Other - - - - - - EBITDA 3,200 3,281 3,643 5,566 7,247 8,549 % chg 40.2 2.5 11.1 52.8 30.2 18.0 (% of Net Sales) 18.6 17.0 13.9 16.9 18.1 18.1 Depreciation & Amortisation 273.0 297.2 334.3 458.0 579.2 685.9 EBIT 2,927 2,984 3,309 5,108 6,668 7,863 % chg 43.7 1.9 10.9 54.4 30.5 17.9 (% of Net Sales) 17.0 15.5 12.6 15.5 16.6 16.7 Interest & other Charges 43.3 35.4 30.7 33.5 35.0 35.0 Other Income 823.6 1,444.8 1,497.4 1,516.4 1,611.7 1,963.1 (% of PBT) 22.2 32.9 31.4 23.0 19.5 20.0 Others - - - - - - Recurring PBT 3,707 4,393 4,776 6,591 8,245 9,791 % chg 46.9 18.5 8.7 38.0 25.1 18.8 Extraordinary Expense/(Inc.) (28.9) (37.4) (73.1) - - - PBT (reported) 3,736 4,430 4,849 6,591 8,245 9,791 Tax 1,321 1,571 1,711 2,280 2,886 3,427 (% of PBT) 35.4 35.5 35.3 34.6 35.0 35.0 PAT (reported) 2,415 2,859 3,138 4,311 5,359 6,364 Add: Share of earnings of - - - - - - associate Less: Minority interest (MI) - - - - - - Prior period items - - - - - - PAT after MI (reported) 2,415 2,859 3,138 4,311 5,359 6,364 ADJ. PAT 2,414 2,860 3,126 4,311 5,359 6,364 % chg 44.1 18.5 9.3 37.9 24.3 18.8 (% of Net Sales) 14.0 14.8 11.9 13.1 13.4 13.5 Basic EPS (Rs) 98.6 58.4 63.9 88.1 109.5 130.0 Fully Diluted EPS (Rs) 49.3 58.4 63.9 88.1 109.5 130.0 % chg 44.1 18.5 9.3 37.9 24.3 18.8 May 28, 2010 5
  • 6. BHEL I 4QFY2010 Result Update Balance Sheet (Rs cr) Y/E March FY2007 FY2008 FY2009 FY2010E FY2011E FY2012E SOURCES OF FUNDS Equity Share Capital 245 490 490 490 490 490 Preference Capital - - - - - - Reserves& Surplus 8,544 10,285 12,449 15,426 19,353 24,171 Shareholders Funds 8,788 10,774 12,939 15,915 19,842 24,661 Minority Interest - - - - - - Total Loans 89 95 149 128 128 128 Deferred Tax Liability (935) (1,338) (1,840) (1,527) (1,527) (1,527) Total Liabilities 7,942 9,531 11,248 14,516 18,443 23,261 APPLICATION OF FUNDS Gross Block 4,135 4,443 5,225 7,827 8,722 10,877 Less: Acc. Depreciation 3,146 3,462 3,754 4,171 4,750 5,436 Net Block 989 981 1,470 3,656 3,971 5,440 Capital Work-in-Progress 303 658 1,157 289 895 239 Goodwill - - - - - - Investments 8 8 52 80 80 80 Current Assets 20,980 27,906 36,901 42,933 50,985 58,863 Cash 5,809 8,386 10,315 9,788 12,720 15,165 Loans & Advances 1,141 1,388 2,424 2,814 3,208 3,769 Other 200 421 350 407 392 509 Current liabilities 14,337 20,022 28,333 32,442 37,488 41,361 Net Current Assets 6,643 7,884 8,568 10,491 13,497 17,502 Mis. Exp. not written off - - - - - - Total Assets 7,942 9,531 11,248 14,516 18,443 23,261 Cash Flow Statement (Rs cr) Y/E March FY2007 FY2008 FY2009 FY2010E FY2011E FY2012E Profit before tax 3,736 4,430 4,849 6,591 8,245 9,791 Depreciation 273 297 334 458 579 686 (Inc)/Dec in Working Capital 1,043 1,336 1,244 (2,450) (75) (1,559) Less: Other income 447 1,023 983 1,516 970 1,209 Direct taxes paid 1,484 1,974 2,213 2,280 2,886 3,427 Others 42 30 (18) (41) - - Cash Flow from Operations 3,163 3,097 3,214 762 4,894 4,282 (Inc.)/Dec.in Fixed Assets (431) (664) (1,280) (1,734) (1,500) (1,500) (Inc.)/Dec. in Investments - - (44) (27) - - Other income 447 1,023 983 1,516 970 1,209 Cash Flow from Investing 16 359 (341) (245) (530) (291) Issue of Equity - - - - - - Inc./(Dec.) in loans (469) 6 54 (22) - - Dividend Paid (Incl. Tax) 692 873 974 1,334 1,432 1,546 Others (343) (11) (24) 313 - - Cash Flow from Financing (1,161) (868) (919) (1,356) (1,432) (1,546) Inc./(Dec.) in Cash 1,675 2,577 1,929 (527) 2,932 2,445 Opening Cash balances 4,134 5,809 8,386 10,315 9,788 12,720 Closing Cash balances 5,809 8,386 10,315 9,788 12,720 15,165 May 28, 2010 6
  • 7. BHEL I 4QFY2010 Result Update Key Ratios Y/E March FY2007 FY2008 FY2009 FY2010E FY2011E FY2012E Valuation Ratios (x) P/E (on FDEPS) 47.0 39.7 36.3 26.3 21.2 17.8 P/CEPS 42.2 36.0 32.8 23.8 19.1 16.1 P/BV 12.9 10.5 8.8 7.1 5.7 4.6 Dividend yield (%) 1.1 0.7 0.7 1.0 1.1 1.2 EV/Sales 6.3 5.5 3.9 3.2 2.5 2.1 EV/EBITDA 30.1 28.4 24.8 18.6 12.8 10.6 EV/Total Assets 12.1 9.7 7.9 6.5 5.0 4.0 Per Share Data (Rs) EPS (Basic) 98.6 58.4 63.9 88.1 109.5 130.0 EPS (fully diluted) 49.3 58.4 63.9 88.1 109.5 130.0 Cash EPS 54.9 64.5 70.7 97.4 121.3 144.0 DPS 24.5 15.3 17.0 23.3 25.0 27.0 Book Value 179.5 220.1 264.3 325.1 405.3 503.8 DuPont Analysis EBIT margin (%) 17.0 15.5 12.6 15.5 16.6 16.7 Tax retention ratio 0.6 0.6 0.6 0.7 0.7 0.7 Asset turnover (x) 5.1 7.0 10.1 7.4 6.0 5.6 ROIC (Post-tax) (%) 55.8 69.6 82.4 75.1 65.0 61.2 Cost of Debt (Post Tax) (%) 8.6 24.8 16.3 15.8 17.8 17.8 Leverage (x) (0.7) (0.8) (0.8) (0.6) (0.6) (0.6) Operating RoE (%) 25.1 35.1 30.2 38.8 34.8 34.6 Returns (%) RoCE (Pre-tax) 39.5 34.5 31.9 35.1 40.6 38.5 Angel RoIC (Pre-tax) 105.0 148.9 226.2 137.1 120.2 110.6 RoE 30.0 29.2 26.4 29.9 30.0 28.6 Turnover Ratios (x) Asset Turnover (Gross Block) 4.3 4.5 5.4 5.0 4.8 4.8 Inventory / Sales (days) 84 94 95 95 94 92 Receivables (days) 178 204 195 204 200 195 Payables (days) 66 75 72 74 72 71 Working capital cycle (ex-cash) 18 (9) (24) 8 7 18 (days) Solvency Ratios (x) Net debt to equity (0.7) (0.8) (0.8) (0.6) (0.6) (0.6) Net debt to EBITDA (1.6) (2.2) (2.5) (1.7) (1.6) (1.6) Interest Coverage (EBIT / Int.) 76.2 96.2 124.5 152.5 208.8 246.2 May 28, 2010 7
  • 8. BHEL I 4QFY2010 Result Update Research Team Tel: 022- 4040 3800 E-mail: research@angeltrade.com Website: www.angeltrade.com DISCLAIMER This document is solely for the personal information of the recipient, and must not be singularly used as the basis of any investment decision. Nothing in this document should be construed as investment or financial advice. Each recipient of this document should make such investigations as they deem necessary to arrive at an independent evaluation of an investment in the securities of the companies referred to in this document (including the merits and risks involved), and should consult their own advisors to determine the merits and risks of such an investment. Angel Securities Limited, its affiliates, directors, its proprietary trading and investment businesses may, from time to time, make investment decisions that are inconsistent with or contradictory to the recommendations expressed herein. The views contained in this document are those of the analyst, and the company may or may not subscribe to all the views expressed within. Reports based on technical and derivative analysis center on studying charts of a stock's price movement, outstanding positions and trading volume, as opposed to focusing on a company's fundamentals and, as such, may not match with a report on a company's fundamentals. The information in this document has been printed on the basis of publicly available information, internal data and other reliable sources believed to be true, and are for general guidance only. Angel Securities Limited has not independently verified all the information contained within this document. Accordingly, we cannot testify, nor make any representation or warranty, express or implied, to the accuracy, contents or data contained within this document. While Angel Securities Limited endeavours to update on a reasonable basis the information discussed in this material, there may be regulatory, compliance, or other reasons that prevent us from doing so. This document is being supplied to you solely for your information, and its contents, information or data may not be reproduced, redistributed or passed on, directly or indirectly. Angel Securities Limited and its affiliates may seek to provide or have engaged in providing corporate finance, investment banking or other advisory services in a merger or specific transaction to the companies referred to in this report, as on the date of this report or in the past. Neither Angel Securities Limited, nor its directors, employees or affiliates shall be liable for any loss or damage that may arise from or in connection with the use of this information. Note: Please refer to the important `Stock Holding Disclosure' report on the Angel website (Research Section). Disclosure of Interest Statement BHEL 1. Analyst ownership of the stock No 2. Angel and its Group companies ownership of the stock Yes 3. Angel and its Group companies’ Directors ownership of the stock No 4. Broking relationship with company covered No Note: We have not considered any Exposure below Rs 1 lakh for Angel and its Group companies. Address: Acme Plaza, ‘A’ Wing, 3rd Floor, M.V. Road, Opp. Sangam Cinema, Andheri (E), Mumbai - 400 059. Tel : (022) 3952 4568 / 4040 3800 Angel Broking Ltd: BSE Sebi Regn No : INB 010996539 / CDSL Regn No: IN - DP - CDSL - 234 - 2004 / PMS Regn Code: PM/INP000001546 Angel Securities Ltd:BSE: INB010994639/INF010994639 NSE: INB230994635/INF230994635 Membership numbers: BSE 028/NSE:09946 Angel Capital & Debt Market Ltd: INB 231279838 / NSE FNO: INF 231279838 / NSE Member code -12798 Angel Commodities Broking (P) Ltd: MCX Member ID: 12685 / FMC Regn No: MCX / TCM / CORP / 0037 NCDEX : Member ID 00220 / FMC Regn No: NCDEX / TCM / CORP / 0302 May 28, 2010 8