1. Please refer to important disclosures at the end of this report 1
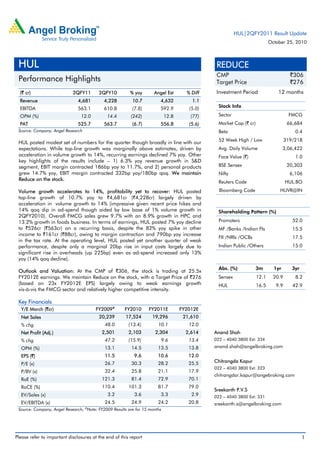
(` cr) 2QFY11 2QFY10 % yoy Angel Est % Diff
Revenue 4,681 4,228 10.7 4,632 1.1
EBITDA 563.1 610.8 (7.8) 592.9 (5.0)
OPM (%) 12.0 14.4 (242) 12.8 (77)
PAT 525.7 563.7 (6.7) 556.8 (5.6)
Source: Company, Angel Research
HUL posted modest set of numbers for the quarter though broadly in line with our
expectations. While top-line growth was marginally above estimates, driven by
acceleration in volume growth to 14%, recurring earnings declined 7% yoy. Other
key highlights of the results include – 1) 6.3% yoy revenue growth in S&D
segment, EBIT margin contracted 186bp yoy to 11.7%, and 2) personal products
grew 14.7% yoy, EBIT margin contracted 332bp yoy/180bp qoq. We maintain
Reduce on the stock.
Volume growth accelerates to 14%, profitability yet to recover: HUL posted
top-line growth of 10.7% yoy to `4,681cr (`4,228cr) largely driven by
acceleration in volume growth to 14% (impressive given recent price hikes and
14% qoq dip in ad-spend though aided by low base of 1% volume growth in
2QFY2010). Overall FMCG sales grew 9.7% with an 8.9% growth in HPC and
13.2% growth in foods business. In terms of earnings, HUL posted 7% yoy decline
to `526cr (`563cr) on a recurring basis, despite the 82% yoy spike in other
income to `161cr (`88cr), owing to margin contraction and 790bp yoy increase
in the tax rate. At the operating level, HUL posted yet another quarter of weak
performance, despite only a marginal 20bp rise in input costs largely due to
significant rise in overheads (up 225bp) even as ad-spend increased only 13%
yoy (14% qoq decline).
Outlook and Valuation: At the CMP of `306, the stock is trading at 25.5x
FY2012E earnings. We maintain Reduce on the stock, with a Target Price of `276
(based on 23x FY2012E EPS) largely owing to weak earnings growth
vis-à-vis the FMCG sector and relatively higher competitive intensity.
Key Financials
Y/E March (`cr) FY2009#
FY2010 FY2011E FY2012E
Net Sales 20,239 17,524 19,296 21,610
% chg 48.0 (13.4) 10.1 12.0
Net Profit (Adj.) 2,501 2,103 2,304 2,614
% chg 47.2 (15.9) 9.6 13.4
OPM (%) 13.1 14.5 13.5 13.8
EPS (`) 11.5 9.6 10.6 12.0
P/E (x) 26.7 30.3 28.2 25.5
P/BV (x) 32.4 25.8 21.1 17.9
RoE (%) 121.3 81.4 72.9 70.1
RoCE (%) 110.4 101.3 81.7 79.0
EV/Sales (x) 3.2 3.6 3.3 2.9
EV/EBITDA (x) 24.5 24.9 24.2 20.8
Source: Company, Angel Research; #
Note: FY2009 Results are for 15 months
REDUCE
CMP `306
Target Price `276
Investment Period 12 months
Stock Info
Sector FMCG
Market Cap (` cr) 66,684
Beta 0.4
52 Week High / Low 319/218
Avg. Daily Volume 3,06,422
Face Value (`) 1.0
BSE Sensex 20,303
Nifty 6,106
Reuters Code HUL.BO
Bloomberg Code HUVR@IN
Shareholding Pattern (%)
Promoters 52.0
MF /Banks /Indian FIs 15.5
FII /NRIs /OCBs 17.5
Indian Public /Others 15.0
Abs. (%) 3m 1yr 3yr
Sensex 12.1 20.9 8.2
HUL 16.5 9.9 42.9
Anand Shah
022 – 4040 3800 Ext: 334
anand.shah@angelbroking.com
Chitrangda Kapur
022 – 4040 3800 Ext: 323
chitrangdar.kapur@angebroking.com
Sreekanth P.V.S
022 – 4040 3800 Ext: 331
sreekanth.s@angelbroking.com
HUL
Performance Highlights
HUL|2QFY2011 Result Update
October 25, 2010
2. HUL | 2QFY2011 Result Update
October 25, 2010 2
Exhibit 1: Quarterly performance
Y/E March (` cr) 2QFY11 2QFY10 % yoy 1HFY2011 1HFY2010 % chg
Net Sales 4,680.9 4,228.1 10.7 9,474.8 8,703.8 8.9
Consumption of RM 2,383.0 2,144.1 11.1 4,829.6 4,455.8 8.4
(% of Sales) 50.9 50.7 51.0 51.2
Staff Costs 245.0 235.8 3.9 495.6 486.2 1.9
(% of Sales) 5.2 5.6 5.2 5.6
Advertising Expense 646.5 570.9 13.2 1,397.7 1,132.0 23.5
(% of Sales) 13.8 13.5 14.8 13.0
Other Expenses 843.3 666.4 26.5 1,590.2 1,330.9 19.5
(% of Sales) 18.0 15.8 16.8 15.3
Total Expenditure 4,117.8 3,617.3 13.8 8,313.1 7,404.9 12.3
Operating Profit 563.1 610.8 (7.8) 1,161.7 1,298.9 (10.6)
OPM (%) 12.0 14.4 12.3 14.9
Interest 0.1 1.5 (95.3) 0.2 6.7 (97.7)
Depreciation 55.4 46.2 19.7 108.9 88.7 22.7
Other Income 160.6 88.4 81.7 285.1 148.9 91.5
PBT (excl. Extr. Items) 668.3 651.5 2.6 1,337.8 1,352.4 (1.1)
Extr. Income/(Expense) 40.4 (135.2) 58.9 (128.7)
PBT (incl. Extr. Items) 708.7 516.3 37.3 1,396.7 1,223.8 14.1
(% of Sales) 15.1 12.2 14.7 14.1
Provision for Taxation 142.6 87.8 62.4 297.4 252.1 18.0
(% of PBT) 21.3 13.5 22.2 18.6
Recurring PAT 525.7 563.7 (6.7) 1,040.4 1,100.4 (5.5)
PATM (%) 11.2 13.3 11.0 12.6
Reported PAT 566.1 428.5 32.1 1,099.3 971.7 13.1
Equity shares (cr) 218.2 218.1 218.2 218.1
Adjusted EPS (`) 2.6 2.0 5.0 4.5
Source: Company, Angel Research
Top-line marginally above estimates, volume growth accelerates to 14%
HUL posted top-line growth of 10.7% yoy to `4,681cr (`4,228cr) largely driven by
acceleration in volume growth to 14% (impressive given recent price hikes and 14%
qoq dip in ad-spends though aided by pipeline filling ahead of price hikes and low
base of 1% volume growth in 2QFY2010). However, negative value of growth of
~3% (due to price cuts/promotional offers largely in detergents category, recent
round of price hikes will reflect only in 2HFY2011) dragged top-line growth.
Overall FMCG sales grew 9.7% with an 8.9% growth in HPC and 13.2% growth in
foods business. In HPC, soaps & detergents (S&D) segment posted a modest growth
of 6.3% yoy despite price cuts and intense competition in detergents category.
Management has indicated that both detergents and soaps grew ahead of market. In
detergents, all three brands grew well and soaps witnessed growth across all
segments. Personal products registered a 14.7% yoy growth, sixth consecutive
quarter of double-digit volume led growth. In foods business, all segments grew well
contributing to growth (beverages grew 9% yoy, processed foods grew 26% yoy and
ice creams grew 9% yoy).
3. HUL | 2QFY2011 Result Update
October 25, 2010 3
Exhibit 2: Back to double-digit top-line growth
Source: Company, Angel research
Exhibit 3: Volume growth accelerates on low base
Source: Company, Angel research
Recurring earnings declines 7% despite 82% jump in other income
In terms of earnings, HUL posted 7% yoy decline to `526cr (`563cr) on a recurring
basis, despite the 82% yoy spike in other income to `161cr (`88cr), owing to margin
contraction and 790bp yoy increase in tax rate (2QFY2010 had a tax credit of
`18cr). However, on a reported basis, HUL posted 32% yoy growth in earnings to
`566cr (`429cr) aided by the `40cr exceptional gain this quarter (owing to profit on
sale of properties and long-term investments) vis-à-vis `135cr exceptional loss in
2QFY2010 (owing to provisions related to settlement signed for the closed Sewri unit)
OPM dips 242bp due to higher overheads, ad-spend declines 14% qoq
At the operating level, HUL posted yet another quarter of weak performance, despite
only a marginal 20bp rise in input costs (aided by price hikes and buying efficiencies)
and savings in staff costs (down 34bp yoy) largely due to significant rise in overheads
(up 225bp) even as ad-spend increased only 13% yoy (14% qoq decline) indicating
competitive levels of advertising. We believe the sharp spike in overheads can be
attributed to – 1) mould expenses on account of new product launches, and
2) higher royalty and freight expenses. Hence, operating margin for the quarter
contracted by 242bp yoy to 12% (14.4%) resulting in an 8% yoy decline in EBITDA to
`563cr (`611cr). In terms of categories, S&D segment witnessed margin contraction
of 186bp yoy/70bp rise qoq impacted by the price cuts; personal products registered
margin contraction of 332bp yoy/180bp qoq and processed foods registered
positive EBIT margin of 4.6%.
Exhibit 4: Higher tax rate impacts recurring earnings
Source: Company, Angel Research
Exhibit 5: OPM contracts despite stable gross margins
Source: Company, Angel Research
-
5.0
10.0
15.0
20.0
25.0
-
1,000
2,000
3,000
4,000
5,000
6,000
2Q09
3Q09
4Q09
5Q09
1Q10
2Q10
3Q10
4Q10
1Q11
2Q11
(%)
(`cr)
Top-line (LHS) YoY growth (RHS)
8
7
2
(4)
2 1
5
11 11
14
(10)
(5)
-
5
10
15
2Q09
3Q09
4Q09
5Q09
1Q10
2Q10
3Q10
4Q10
1Q11
2Q11
(%)
(30.0)
(20.0)
(10.0)
-
10.0
20.0
30.0
40.0
10
110
210
310
410
510
610
710
2Q09
3Q09
4Q09
5Q09
1Q10
2Q10
3Q10
4Q10
1Q11
2Q11
(yoy%)
`cr)
PAT (LHS) YoY growth (RHS)
13.3 11.8
16.1
13.2 15.4 14.4 16.0
12.3 12.5 12.0
46.9 45.8 46.1 47.8 48.4 49.3 50.9 48.6 49.0 49.1
-
10.0
20.0
30.0
40.0
50.0
60.0
2Q09
3Q09
4Q09
5Q09
1Q10
2Q10
3Q10
4Q10
1Q11
2Q11
(%)
OPM Gross Margin
5. HUL | 2QFY2011 Result Update
October 25, 2010 5
S&D segment on recovery mode, margins have bottomed out
HUL’s S&D segment continued its recovery mode registering a growth of 6.3% yoy
post corrective price actions in detergents and brand re-launches in soaps (we
highlight HUL’s S&D segment had witnessed negative growth in 3QFY2010 and
4QFY2010). The acceleration in top-line growth this quarter was led by the
double-digit volume growth in detergents (all three brands grew well) aided by price
cuts, while the soaps portfolio registered growth across segments (Lifebuoy
re-launched). However, profitability took a hit as margins dipped 186bp yoy due to
price cuts, promotional offers and higher ad-spend. Nonetheless, we believe dip in
the S&D segment margins has bottomed out (70bp expansion qoq this quarter).
We believe the worst times of negative volume growth and declining margins is over
for HUL’s core category of S&D. While we have modeled in 7% CAGR in S&D
revenues and 200bp margin contraction over FY2010-12, we believe there exists
upside risks to our estimates. Going ahead, we expect the S&D category to post
higher volume growth (aided by low base, corrective actions). Moreover, recent price
hikes in select SKUs of soaps and detergents are likely to aid margin recovery in
2HFY2011. A key risk to our call of recovery in the S&D segment emanates from lack
of pricing power recovery, growing market share of ITC and rising palm oil prices.
Exhibit 7: S&D posts modest growth yoy
Source: Company, Angel research
Exhibit 8: EBIT margins dip yoy but improve qoq
Source: Company, Angel research
(5.0)
-
5.0
10.0
15.0
20.0
25.0
30.0
1,800
1,900
2,000
2,100
2,200
2,300
2Q09
3Q09
4Q09
5Q09
1Q10
2Q10
3Q10
4Q10
1Q11
2Q11
(%)
(`cr)
Top-line (LHS) YoY growth (RHS)
-
5.0
10.0
15.0
20.0
-
100
200
300
400
500
2Q09
3Q09
4Q09
5Q09
1Q10
2Q10
3Q10
4Q10
1Q11
2Q11
(%)
(`cr)
EBIT (LHS) EBIT % (RHS)
6. HUL | 2QFY2011 Result Update
October 25, 2010 6
PP sales continue to post double digit volume growth
The PP segment registered 14.7% yoy growth in terms of volumes, a sixth consecutive
quarter of double-digit growth. Innovations in the skincare segment with product
launches in the male grooming category and good performance of hair care
products led to this double-digit growth. However, the segment margins
disappointed with a contraction of 332bp yoy/180bp qoq to 23% impacted by
higher consumer offers in shampoos (competitive pressures have risen significantly),
higher overheads and sustained high levels of ad-spend.
Exhibit 9: PP sustains double-digit growth
Source: Company, Angel research
Exhibit 10: EBIT margins decline yoy and qoq
Source: Company, Angel research
Processed foods, ice creams do well, beverages disappoint
The foods segment recorded a growth of 13% yoy driven largely by strong growth in
processed foods (up 26% yoy) and ice creams (up 9% yoy). However, beverages
disappointed registering muted growth of 9% yoy as the tea market witnessed
slowdown, though coffee growth was robust. Processed foods grew in strong double
digits as Kissan and Knorr showed impressive volume-led growth. Knorr Soupy
Noodles is being rolled out nationally and has received good consumer response.
-
5.0
10.0
15.0
20.0
-
200
400
600
800
1,000
1,200
1,400
1,600
2Q09
3Q09
4Q09
5Q09
1Q10
2Q10
3Q10
4Q10
1Q11
2Q11
(%)
(`cr)
Top-line (LHS) YoY growth (RHS)
-
5.0
10.0
15.0
20.0
25.0
30.0
35.0
-
100
200
300
400
500
2Q09
3Q09
4Q09
5Q09
1Q10
2Q10
3Q10
4Q10
1Q11
2Q11
(%)
(`cr)
EBIT (LHS) EBIT % (RHS)
7. HUL | 2QFY2011 Result Update
October 25, 2010 7
Investment Concerns
High competitive intensity across categories, ITC a major threat: During the last
several quarters, management has constantly admitted that competitive intensity
across the key categories of soaps, detergents, shampoos and skin care has
increased and is likely to intensify further. While corrective steps taken by HUL
over the last several quarters in terms of correcting pricing, promotional activity
and strengthening distribution have helped stabilise market share losses, we
believe ITC’s commitment to categories like soaps, shampoos and skin care is a
major threat for HUL in the long run.
OPM to decline as re-investment in ad-spend to sustain: Over FY2010-12, we
have modeled in 70bp reduction in OPM (100bp in FY2011) despite
incremental gains from cost rationalisation measures and moderate decline in
gross margins, as we expect ad-spend to rise to ~14-14.5% levels from the
current 13.6% (though initial signs of moderation in ad-spend was reflected in
the current quarter) due to high competitive intensity. Hence, we expect EBITDA
to increase at a muted 8% CAGR over FY2010-12.
Rich valuations for a muted 11% CAGR unjustified: At the CMP of `253, HUL is
trading at rich valuations of 22.5x FY2012E earnings, which is unjustified given
the muted 11% CAGR expected over FY2010-12 (~2.5x PEG) vis-à-vis sector
growth (ex-HUL) of ~15-18%. In terms of historical valuations, HUL is trading at
50% premium to the Sensex (in line with 5-yr average) and ~5% discount of 5-yr
average P/E leaving little room for upside.
Outlook and Valuation
Sustained double-digit volume growth for three consecutive quarters (albeit on a low
base), qoq decline in advertising spends and steady performance of personal
products and foods business were the key positive takeaways from the 2QFY2011
results. Hence, we have marginally tweaked our estimates upwards. While the recent
round of price hikes in the S&D segment and peaking ad-spends does indicate some
signs of competitive easing, we await emergence of significant value growth (-3% in
2QFY2011 due to price cuts), which would play an important role post 3QFY2011
when the low base in terms of volume growth bottoms out.
We expect HUL to post 11% CAGR in top-line over FY2010-12 largely aided by the
recent price hikes in the S&D segment, steady performance of its personal care and
foods division (aided by innovations and higher ad-spend), spike in detergents
volume growth and modest performance of its soaps business (aided by brand
re-launches). In terms of earnings, we expect HUL to post a weak 11.5% CAGR
during the period impacted by the dip in margins (high base due to price cuts) and
higher tax rate (on account of increase in MAT).
At the CMP of `306, the stock is trading at 25.5x FY2012E earnings. We maintain
Reduce on the stock with a Target Price of `276 (based on 23x FY2012E EPS) largely
owing to weak earnings growth vis-à-vis the FMCG sector and relatively higher
competitive intensity.
13. HUL | 2QFY2011 Result Update
October 25, 2010 13
Research Team Tel: 022 - 4040 3800 E-mail: research@angeltrade.com Website: www.angeltrade.com
Disclaimer
This document is solely for the personal information of the recipient, and must not be singularly used as the basis of any investment
decision. Nothing in this document should be construed as investment or financial advice. Each recipient of this document should make
such investigations as they deem necessary to arrive at an independent evaluation of an investment in the securities of the companies
referred to in this document (including the merits and risks involved), and should consult their own advisors to determine the merits and
risks of such an investment.
Angel Broking Limited, its affiliates, directors, its proprietary trading and investment businesses may, from time to time, make
investment decisions that are inconsistent with or contradictory to the recommendations expressed herein. The views contained in this
document are those of the analyst, and the company may or may not subscribe to all the views expressed within.
Reports based on technical and derivative analysis center on studying charts of a stock's price movement, outstanding positions and
trading volume, as opposed to focusing on a company's fundamentals and, as such, may not match with a report on a company's
fundamentals.
The information in this document has been printed on the basis of publicly available information, internal data and other reliable
sources believed to be true, but we do not represent that it is accurate or complete and it should not be relied on as such, as this
document is for general guidance only. Angel Broking Limited or any of its affiliates/ group companies shall not be in any way
responsible for any loss or damage that may arise to any person from any inadvertent error in the information contained in this report.
Angel Broking Limited has not independently verified all the information contained within this document. Accordingly, we cannot testify,
nor make any representation or warranty, express or implied, to the accuracy, contents or data contained within this document. While
Angel Broking Limited endeavours to update on a reasonable basis the information discussed in this material, there may be regulatory,
compliance, or other reasons that prevent us from doing so.
This document is being supplied to you solely for your information, and its contents, information or data may not be reproduced,
redistributed or passed on, directly or indirectly.
Angel Broking Limited and its affiliates may seek to provide or have engaged in providing corporate finance, investment banking or
other advisory services in a merger or specific transaction to the companies referred to in this report, as on the date of this report or in
the past.
Neither Angel Broking Limited, nor its directors, employees or affiliates shall be liable for any loss or damage that may arise from or in
connection with the use of this information.
Note: Please refer to the important `Stock Holding Disclosure' report on the Angel website (Research Section). Also, please refer to the
latest update on respective stocks for the disclosure status in respect of those stocks. Angel Broking Limited and its affiliates may have
investment positions in the stocks recommended in this report.
Disclosure of Interest Statement HUL
1. Analyst ownership of the stock No
2. Angel and its Group companies ownership of the stock Yes
3. Angel and its Group companies' Directors ownership of the stock No
4. Broking relationship with company covered No
Note: We have not considered any Exposure below Rs 1 lakh for Angel, its Group companies and Directors.
Ratings (Returns) : Buy (> 15%) Accumulate (5% to 15%) Neutral (-5 to 5%)
Reduce (-5% to 15%) Sell (< -15%)