Call Girls In Yusuf Sarai Women Seeking Men 9654467111
Derivatives report -August 12, 2010
1. Derivative Report
India Research
Aug 12, 2010
Comments
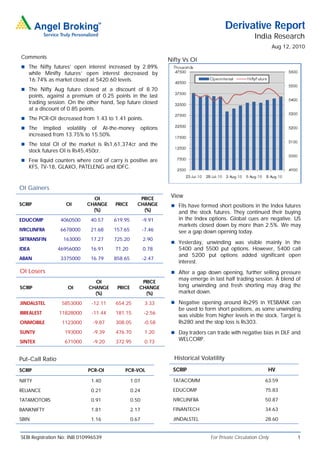
Nifty Vs OI
The Nifty futures’ open interest increased by 2.89%
while Minifty futures’ open interest decreased by
16.74% as market closed at 5420.60 levels.
The Nifty Aug future closed at a discount of 8.70
points, against a premium of 0.25 points in the last
trading session. On the other hand, Sep future closed
at a discount of 0.85 points.
The PCR-OI decreased from 1.43 to 1.41 points.
The Implied volatility of At-the-money options
increased from 13.75% to 15.50%.
The total OI of the market is Rs1,61,374cr and the
stock futures OI is Rs45,450cr.
Few liquid counters where cost of carry is positive are
KFS, TV-18, GLAXO, PATELENG and IDFC.
OI Gainers
OI PRICE
View
SCRIP OI CHANGE PRICE CHANGE FIIs have formed short positions in the Index futures
(%) (%) and the stock futures. They continued their buying
EDUCOMP 4060500 40.57 619.95 -9.91 in the Index options. Global cues are negative. US
markets closed down by more than 2.5%. We may
IVRCLINFRA 6678000 21.68 157.65 -7.46 see a gap down opening today.
SRTRANSFIN 163000 17.27 725.20 2.90
Yesterday, unwinding was visible mainly in the
IDEA 46956000 16.91 71.20 0.78 5400 and 5500 put options. However, 5400 call
and 5200 put options added significant open
ABAN 3375000 16.79 858.65 -2.47
interest.
OI Losers After a gap down opening, further selling pressure
may emerge in last half trading session. A blend of
OI PRICE
SCRIP OI CHANGE PRICE CHANGE long unwinding and fresh shorting may drag the
(%) (%) market down.
JINDALSTEL 5853000 -12.11 654.25 3.33 Negative opening around Rs295 in YESBANK can
be used to form short positions, as some unwinding
IBREALEST 11828000 -11.44 181.15 -2.56
was visible from higher levels in the stock. Target is
ONMOBILE 1123000 -9.87 308.05 -0.58 Rs280 and the stop loss is Rs303.
SUNTV 193000 -9.39 476.70 1.20 Day traders can trade with negative bias in DLF and
SINTEX 671000 -9.20 372.95 0.73
WELCORP.
Put-Call Ratio Historical Volatility
SCRIP PCR-OI PCR-VOL SCRIP HV
NIFTY 1.40 1.07 TATACOMM 63.59
RELIANCE 0.21 0.24 EDUCOMP 75.83
TATAMOTORS 0.91 0.50 IVRCLINFRA 50.87
BANKNIFTY 1.81 2.17 FINANTECH 34.63
SBIN 1.16 0.67 JINDALSTEL 28.60
SEBI Registration No: INB 010996539 For Private Circulation Only 1
2. Derivative Report | India Research
FII Statistics for 11-Aug-2010 Turnover on 11-Aug-2010
Open Interest
No. of Turnover Change
Detail Buy Sell Net Instrument
Contracts (Rs. in cr.) (%)
Contracts Value Change
(Rs. in cr.) (%)
INDEX Index Futures 505308 12881.39 22.31
1412.59 2249.25 (836.66) 629311 16982.75 1.10
FUTURES
INDEX Stock Futures 691685 21934.06 9.20
6513.40 4775.01 1738.39 2118249 57399.69 4.04
OPTIONS
STOCK Index Options 1831631 49968.5 23.28
1672.02 1951.95 (279.93) 1299027 35567.71 0.74
FUTURES
STOCK Stock Options 183378 6596.87 10.95
330.98 431.20 (100.23) 52259 1644.69 7.96
OPTIONS
TOTAL 9928.98 9407.41 521.58 4098846 111594.84 2.56 Total 3212002 91380.82 18.53
Nifty Spot = 5420.60 Lot Size = 50
Bull-Call Spreads Bear-Put Spreads
Action Strike Price Risk Reward BEP Action Strike Price Risk Reward BEP
Buy 5500 27.70 Buy 5400 64.90
21.70 78.30 5521.70 28.75 71.25 5371.25
Sell 5600 6.00 Sell 5300 36.15
Buy 5500 27.70 Buy 5400 64.90
26.00 174.00 5526.00 45.85 154.15 5354.15
Sell 5700 1.70 Sell 5200 19.05
Buy 5600 6.00 Buy 5300 36.15
4.30 95.70 5604.30 17.10 82.90 5282.90
Sell 5700 1.70 Sell 5200 19.05
Note: Above mentioned Bullish or Bearish Spreads in Nifty (August Series) are given as an information and not as a recommendation
Nifty Put-Call Analysis
For Private Circulation Only SEBI Registration No: INB 010996539 2
3. Derivative Report | India Research
Strategy Date Scrip Strategy Status
02-Aug-2010 IDBI Long Call Continue
02-Aug-2010 NIFTY Ratio Put Spread Continue
09-Aug-2010 RELIANCE Long Call Continue
09-Aug-2010 ICICIBANK Ratio Put Spread Continue
DISCLAIMER
This document is solely for the personal information of the recipient, and must not be singularly used as the basis of any investment
decision. Nothing in this document should be construed as investment or financial advice. Each recipient of this document should
make such investigations as they deem necessary to arrive at an independent evaluation of an investment in the securities of the
companies referred to in this document (including the merits and risks involved), and should consult their own advisors to determine
the merits and risks of such an investment.
Angel Broking Limited, its affiliates, directors, its proprietary trading and investment businesses may, from time to time, make
investment decisions that are inconsistent with or contradictory to the recommendations expressed herein. The views contained in this
document are those of the analyst, and the company may or may not subscribe to all the views expressed within.
Reports based on technical and derivative analysis center on studying charts of a stock's price movement, outstanding positions and
trading volume, as opposed to focusing on a company's fundamentals and, as such, may not match with a report on a company's
fundamentals.
The information in this document has been printed on the basis of publicly available information, internal data and other reliable
sources believed to be true, but we do not represent that it is accurate or complete and it should not be relied on as such, as this
document is for general guidance only. Angel Broking or any of its affiliates/ group companies shall not be in any way responsible
for any loss or damage that may arise to any person from any inadvertent error in the information contained in this report. Angel
Broking Limited has not independently verified all the information contained within this document. Accordingly, we cannot testify, nor
make any representation or warranty, express or implied, to the accuracy, contents or data contained within this document. While
Angel Broking Limited endeavours to update on a reasonable basis the information discussed in this material, there may be
regulatory, compliance, or other reasons that prevent us from doing so.
This document is being supplied to you solely for your information, and its contents, information or data may not be reproduced,
redistributed or passed on, directly or indirectly.
Angel Broking Limited and its affiliates may seek to provide or have engaged in providing corporate finance, investment banking or
other advisory services in a merger or specific transaction to the companies referred to in this report, as on the date of this report or
in the past.
Neither Angel Broking Limited, nor its directors, employees or affiliates shall be liable for any loss or damage that may arise from or
in connection with the use of this information.
Note: Please refer to the important `Stock Holding Disclosure' report on the Angel website (Research Section).
Derivative Research Team derivatives.desk@angeltrade.com
For Private Circulation Only SEBI Registration No: INB 010996539 3