SlideShare a Scribd company logo
1 of 12
Download to read offline
1QFY2011 Result Update | FMCG
                                                                                                                            July 28, 2010


 HUL                                                                                          REDUCE
                                                                                              CMP                                  Rs252
 Performance Highlights                                                                       Target Price                         Rs237
  (Rs cr)                   1QFY11       1QFY10          % yoy       Angel Est       % Diff   Investment Period             12 months
  Revenue                    4,793.9     4,475.7           7.1        4,732.6           1.3
  EBITDA                       598.6        688.1       (13.0)          674.4        (11.2)    Stock Info

  OPM (%)                       12.5         15.4     (289bp)               14.3    (176bp)    Sector                              FMCG
  PAT                          514.7        536.7         (4.1)         562.7         (8.5)    Market Cap (Rs cr)                  55,850
 Source: Company, Angel Research                                                               Beta                                   0.5
                                                                                               52 Week High / Low                 306/218
 HUL posted disappointing set of numbers for 1QFY2011, below our expectations
 on the profitability front. While top-line growth was marginally above estimates,             Avg. Daily Volume                  357,554
 driven by 11% volume growth, recurring earnings declined 4% yoy led by                        Face Value (Rs)                        1.0
 significant margin contraction due to 34% rise in ad-spends (on account of higher
 competitive intensity in categories like detergents, soaps and shampoos). Other               BSE Sensex                          17,957
 key highlights of the results include: 1) 2.4% yoy revenue growth in soaps and                Nifty                                5,398
 detergents (S&D) segment, 2) EBIT margin contracted 626bp yoy, and 3) double-
                                                                                               Reuters Code                        HLL.BO
 digit volume growth in detergents and personal products. We maintain Reduce on
 the stock.                                                                                     Bloomberg Code                HLVR@IN

 Modest top line growth, higher ad-spends contract margins: For 1QFY2011, HUL
 posted top-line growth of 7.1% yoy to Rs4,794cr (Rs4,476cr) largely driven by                 Shareholding Pattern (%)
 volume growth of 11% (low base of 2% growth yoy). However, negative value
 growth of ~4% (due to price cuts/promotional offers largely in detergents                     Promoters                             52.0
 category) dragged top-line growth. Overall FMCG sales grew 6.7% with a 5.2%                   MF /Banks /Indian FIs                 16.2
 growth in HPC and 13.4% growth in foods business. In terms of earnings, HUL
                                                                                               FII /NRIs /OCBs                       16.5
 posted 2% yoy decline to Rs533cr (Rs543cr) on a reported basis and 4% decline
 to Rs515cr (Rs537cr) on a recurring basis, despite the 106% yoy spike in other                Indian Public /Others                 15.3
 income to Rs124cr (Rs60cr), owing to weak top-line growth and significant
 margin contraction by 289bp yoy, as ad-spend surged 34% yoy. Tax rate
 remained stable at ~23% and interest costs reduced to almost nil.
                                                                                               Abs. (%)             3m     1yr        3yr
 Outlook and Valuation: At the CMP of Rs252, the stock is trading at 22.5x                     Sensex               3.3   17.1       17.9
 FY2012E earnings. We maintain a Reduce on the stock, with a Target Price of                   HUL                  4.2   (8.9)      28.5
 Rs237 (based on 21x FY2012E EPS) owing to weak earnings growth vis-à-vis the
 FMCG sector, uncertain earnings environment and significantly higher
 competitive intensity.

 Key Financials
  Y/E March (Rs cr)                    FY2009#        FY2010      FY2011E          FY2012E
  Net Sales                              20,239       17,524        19,343          21,515
  % chg                                     48.0        (13.4)         10.4           11.2
  Net Profit (Adj)                        2,501         2,103        2,159           2,449
  % chg                                     47.2        (15.9)          2.7           13.5
  EBITDA (%)                                13.1         14.5          13.2           13.6
  EPS (Rs)                                  11.5           9.6          9.9           11.2
  P/E (x)                                   22.0         25.0          25.5           22.5    Anand Shah
  P/BV (x)                                  26.7         21.3          18.6           16.4    022-4040 3800-334
  RoE (%)                                  121.3         81.4          73.0           72.8    anand.shah@angeltrade.com

  RoCE (%)                                 110.4        101.3          86.6           86.5
                                                                                              Chitrangda Kapur
  EV/Sales (x)                               2.6           3.0          2.7            2.4
                                                                                              022-4040 3800-323
  EV/EBITDA (x)                             20.1         20.3          20.1           17.4
                                                                                              chitrangdar.kapur@angeltrade.com
 Source: Company, Angel Research; #Note: FY2009 Results are for 15 Months


Please refer to important disclosures at the end of this report                                                                         1
HUL | 1QFY2011 Result Update


                Exhibit 1: Quarterly performance


                    Y/E March (Rs cr)         1QFY11       1QFY10       % yoy    FY2010      FY2009#      % chg
                    Net Sales                   4,793.9     4,475.7       7.1    17,523.8    20,239.3     (13.4)
                    Consumption of RM           2,446.6     2,311.7       5.8     8,877.9    10,810.0     (17.9)
                    (% of Sales)                   51.0        51.6                  50.7         53.4
                    Staff Costs                  250.6        250.4       0.1       936.3      1,152.1    (18.7)
                    (% of Sales)                    5.2          5.6                  5.3          5.7
                    Advertising Expense          751.2        561.1      33.9     2,391.4      2,130.9      12.2
                    (% of Sales)                   15.7        12.5                  13.6         10.5
                    Other Expenses               746.9        664.4      12.4     2,769.7      3,490.2    (20.6)
                    (% of Sales)                   15.6        14.8                  15.8         17.2
                    Total Expenditure           4,195.3     3,787.6      10.8    14,975.4    17,583.3     (14.8)
                    Operating Profit             598.6        688.1     (13.0)    2,548.4      2,656.0     (4.1)
                    OPM (%)                        12.5        15.4                  14.5         13.1
                    Interest                        0.1         5.2     (98.5)        7.0         25.3    (72.4)
                    Depreciation                   53.5        42.5      25.9       184.0        195.3     (5.8)
                    Other Income                 124.5         60.5     105.7       349.6        589.7    (40.7)
                    PBT (excl. Extr. Items)      669.5        700.9      (4.5)    2,707.1      3,025.1    (10.5)
                    Extr. Income/(Expense)         18.5         6.5                 111.3        (25.1)
                    PBT (incl. Extr. Items)      688.0        707.4      (2.7)    2,818.4      3,000.0     (6.1)
                    (% of Sales)                   14.4        15.8                  16.1         14.8
                    Provision for Taxation       154.8        164.3      (5.8)      616.4        503.6      22.4
                    (% of PBT)                     23.1        23.4                  22.8         16.6
                    Recurring PAT                514.7        536.7      (4.1)    2,090.7      2,521.6    (17.1)
                    PATM (%)                       10.7        12.0                  11.9         12.5
                    Reported PAT                 533.2        543.2      (1.8)    2,202.0      2,496.5    (11.8)
                    Equity shares (cr)           218.2        218.1                 218.2        218.1
                    Adjusted EPS (Rs)               2.4         2.5                  10.1         11.4

                    Source: Company, Angel Research; Note: #FY2009results are for 15months and not comparable


                Top-line growth above estimates, volume growth sustained at 11%

                For 1QFY2011, HUL posted top-line growth of 7.1% yoy to Rs4,794cr (Rs4,476cr)
                largely driven by volume growth of 11% (low base of 2% growth yoy). However,
                negative value of growth of ~4% (due to price cuts/promotional offers largely in
                detergents category) dragged top-line growth. Overall FMCG sales grew 6.7% with a
                5.2% growth in HPC and 13.4% growth in foods Business. In HPC, soaps &
                detergents (S&D) segment posted muted growth of 2.4% yoy due to price cuts and
                intense competition in detergents category.

                Management has indicated that detergents (all three brands grew well) registered
                double-digit volume growth and soaps regained volume momentum post portfolio
                rejuvenation with premium soaps portfolio growing by strong double digits. Personal
                products registered 11.4% yoy growth largely driven by double-digit volume growth.
                In foods business, all segments grew well contributing to growth (beverages grew 8%
                yoy, processed foods grew 23% yoy and ice creams grew 18% yoy).


July 28, 2010                                                                                                   2
HUL | 1QFY2011 Result Update


Exhibit 2: Sixth qtr of single digit top-line growth                                     Exhibit 3: Price cuts/low base boost volume growth
                                                                                               12                                                                        11       11
           6,000                                                        25.0
                                                                                               10        8
           5,000                                                                                 8                7
                                                                        20.0                                                                                      5
                                                                                                 6
           4,000
                                                                        15.0                     4                         2                  2


                                                                               (%)


                                                                                         (%)
(Rs cr)


                                                                                                 2                                                     1
           3,000
                                                                        10.0                   -
           2,000                                                                                (2)
           1,000                                                        5.0                     (4)
                                                                                                (6)                                (4)
              -                                                         -


                                                                                                       2QFY09

                                                                                                                3QFY09

                                                                                                                         4QFY09

                                                                                                                                   5QFY09

                                                                                                                                            1QFY10

                                                                                                                                                     2QFY10

                                                                                                                                                                3QFY10

                                                                                                                                                                         4QFY10

                                                                                                                                                                                  1QFY11
                   2QFY09    4QFY09      1QFY10     3QFY10     1QFY11
                            Top-line (LHS)        YoY growth (RHS)


Source: Company, Angel Research                                                          Source: Company, Angel Research


                                                               Recurring earnings declines 4% yoy despite 106% jump in other income

                                                               Earnings fell 2% yoy to Rs533cr (Rs543cr) on a reported basis and 4% to Rs515cr
                                                               (Rs537cr) on a recurring basis, despite the 106% yoy spike in other income to
                                                               Rs124cr (Rs60cr), owing to weak top-line growth and significant margin contraction.
                                                               Tax rates remained stable at ~23% and interest costs reduced to almost nil.

                                                               Significant spike in ad-spend leads to margin contraction by 289bp

                                                               At the operating level, HUL posted a weak performance, despite the fall in input costs
                                                               (down 61bp yoy, impressive given the price cuts undertaken this quarter) and savings
                                                               in staff costs (down 37bp yoy) largely due to higher overheads (up 73bp) and
                                                               significant jump in advertising spends (up 34% yoy in absolute terms, 313bp yoy)
                                                               due to intense competitive pressures (detergents, soaps and shampoos witnessing
                                                               higher competitive intensity). Hence, operating margin for the quarter contracted by
                                                               289bp yoy to 12.5% (15.4%) resulting in 13% yoy decline in EBITDA at Rs599cr
                                                               (Rs688cr).

                                                               In terms of categories, S&D segment witnessed sharp margin contraction by 626bp
                                                               yoy impacted by the price cuts and higher ad spends. Personal products registered a
                                                               margin expansion of 279bp yoy, while processed foods registered positive EBIT
                                                               margin of 5%.
                                                                
Exhibit 4: Earnings in red for second quarter                                            Exhibit 5: Spike in ad-spend continues, OPM dips
           710                                                          40.0                   60.0                                   50.9 48.6 49.0
           610                                                          30.0                            46.9 45.8 46.1 47.8 48.4 49.1
                                                                                               50.0
           510                                                          20.0
                                                                                               40.0
           410                                                          10.0
 (Rs cr)


                                                                                               30.0
                                                                               (yoy %)


                                                                                         (%)


           310                                                          -                                                  16.1                      16.0
                                                                                               20.0     13.3 11.8                     13.2 15.4 14.4      12.3 12.5
           210                                                          (10.0)
                                                                                               10.0
           110                                                          (20.0)
            10                                                          (30.0)                   -

                   2QFY09   4QFY09       1QFY10    3QFY10      1QFY11                                 2QFY09             4QFY09             1QFY10              3QFY10             1QFY11
                            PAT (LHS)             YoY growth (RHS)                                                          OPM                               Gross Margin

Source: Company, Angel Research                                                          Source: Company, Angel Research


July 28, 2010                                                                                                                                                                               3
HUL | 1QFY2011 Result Update


                Exhibit 6: Segment-wise Performance
                 Y/E March (Rs cr)             1QFY11     1QFY10     % chg     FY2010     FY2009#     % chg
                 Soaps and Detergents           2,264       2,212      2.4       8,266       9,885    (16.4)
                 Personal Product               1,366       1,226     11.4       5,048       5,385     (6.3)
                 Beverages                        538         500      7.7       2,142       2,300     (6.8)
                 Processed Foods                  211         172     22.7         731         808     (9.6)
                 Ice Creams                       105          89     18.1         231         235     (1.8)
                 Exports                          265         257      2.8       1,005       1,576    (36.2)
                 Others                           113          79     41.8         347         359     (3.3)
                 Less:Inter Segment Revenue           -        (4)                  (4)         (8)
                 Total Gross Income             4,861       4,530      7.3      17,766      20,539    (51.4)
                 Soaps and Detergents             249         381    (34.8)      1,185       1,482    (20.0)
                 Personal Products                339         270     25.5       1,297       1,429     (9.3)
                 Beverages                          70         70     (1.1)        320         308          3.8
                 Processed Foods                  10.6       (1.3)                   4            1   206.2
                 Ice Creams                         15         15     (1.0)         13            9    47.2
                 Exports                            23         21     10.5          59         108    (45.9)
                 Others                           (27)        (28)                 (72)       (134)
                 Total PBIT                       679         728     (6.8)      2,805       3,203    (12.4)
                 Less: Interest Exp.                (0)        (5)                  (7)        (25)
                 Less: Other Unallocable Exp         9        (20)                 (36)       (169)
                 PBT                              688         704     (2.2)      2,763       3,009     (8.2)
                 PBIT Margin (%)
                 Soap and Detergent               11.0       17.2                 14.3        15.0
                 Personal Product                 24.8       22.0                 25.7        26.5
                 Beverages                        12.9       14.1                 14.9        13.4
                 Processed Foods                   5.0       (0.7)                 0.6          0.2
                 Ice Creams                       14.6       17.5                  5.5          3.7
                 Exports                           8.6        8.0                  5.8          6.9
                 Others                         (23.6)      (35.2)               (20.8)      (37.5)
                Source: Company, Angel Research; Note: #FY2009results are for 15months and not comparable


                S&D sales beat estimates aided by strong volume growth

                HUL’s S&D segment witnessed 2% yoy growth, above our estimates of 3% decline,
                led by double-digit volume growth. However, overall growth was curtailed to single
                digits owing to the steep price cuts in the detergents segment due to price war with
                P&G. In detergents, Wheel delivered double-digit volume growth, while Rin sustained
                strong volume growth post its re-launch. Soaps recorded steady performance led by
                premium portfolio (grew ahead of market, Dove is now accessible to more customers
                at Rs20 price point). However, PBIT margins in the segment collapsed by 626bp yoy
                impacted by the steep price cuts and higher ad-spend.

                We believe HUL’s core category of S&D will continue to remain under pressure in the
                near-to-medium term until competitive pressures reduce. We expect the S&D
                segment to post 4% growth in top-line in FY2011E, as growth in soaps and spike in
                detergent volume due to the price cuts gets offset by negative value growth in
                detergents. Moreover, we have modeled in around 200bp erosion in S&D segment
                margins for FY2011E to factor in the impact of price cuts.


July 28, 2010                                                                                               4
HUL | 1QFY2011 Result Update


Exhibit 7: S&D continues to post low growth                                         Exhibit 8: EBIT margins dip to new lows of 11%
          2,300                                                       30.0                    500                                                      20.0
                                                                      25.0
          2,200                                                                               400
                                                                      20.0                                                                             15.0
          2,100                                                                               300


                                                                              (%)


                                                                                                                                                              (%)
                                                                      15.0
(Rs cr)


                                                                                    (Rs cr)
                                                                                                                                                       10.0
          2,000                                                       10.0                    200
                                                                      5.0                                                                              5.0
          1,900                                                                               100
                                                                      -
          1,800                                                       (5.0)                    -                                                       -
                  2QFY09    4QFY09      1QFY10    3QFY10     1QFY11                                 2QFY09   4QFY09       1QFY10   3QFY10     1QFY11
                           Top-line (LHS)        YoY growth (RHS)                                            EBIT (LHS)            EBIT % (RHS)


Source: Company, Angel Research                                                     Source: Company, Angel Research


                                                             PP sales below estimates, double-digit volume growth continues

                                                             The personal products (PP) segment registered 11.4% yoy growth, ~3% below our
                                                             estimates on account of lower sales in shampoos (higher competitive pressures).
                                                             However, in terms of profitability, the segment registered margin expansion of
                                                             280bp yoy, despite higher ad-spend on account of product mix gains and favourable
                                                             base.


Exhibit 9: PP growth slows down to 11%                                              Exhibit 10: EBIT margins improve yoy and qoq
          1,600                                                       20.0                    500                                                      35.0
          1,400                                                                                                                                        30.0
                                                                                              400
          1,200                                                       15.0                                                                             25.0
          1,000                                                                               300
                                                                              (%)


                                                                                                                                                              (%)
                                                                                                                                                       20.0
(Rs cr)


                                                                                    (Rs cr)


            800                                                       10.0
                                                                                              200                                                      15.0
            600
            400                                                       5.0                                                                              10.0
                                                                                              100
            200                                                                                                                                        5.0
             -                                                        -                        -                                                       -
                  2QFY09    4QFY09      1QFY10    3QFY10     1QFY11                                 2QFY09   4QFY09       1QFY10   3QFY10     1QFY11
                           Top-line (LHS)        YoY growth (RHS)                                            EBIT (LHS)            EBIT % (RHS)


Source: Company, Angel Research                                                     Source: Company, Angel Research


                                                             Processed foods, ice creams do well, beverages disappoints

                                                             The foods segment recorded a growth of 13.4% yoy driven largely by strong growth
                                                             in processed foods (up 23% yoy) and ice creams (up 18% yoy). However, beverages
                                                             disappointed registering muted growth of 8% yoy as the tea market witnessed
                                                             slowdown. Processed foods grew in strong double digits with improved profitability
                                                             (EBIT margins expand 574bp yoy). All three core brands, Knorr (Knorr soupy noodles
                                                             accepted well), Kissan and Annapurna did well. The ice cream segment was led by
                                                             Impulse and Take Home categories.


July 28, 2010                                                                                                                                                  5
HUL | 1QFY2011 Result Update


                Investment Concerns

                     High competitive intensity across categories, ITC a major threat: During the last
                     several quarters, management has constantly admitted that competitive intensity
                     across key categories of soaps, detergents, shampoos and skin care has
                     increased and is likely to further intensify. While corrective steps taken by HUL
                     over the last several quarters in terms of correcting pricing, promotional activity
                     and strengthening distribution have helped stabilise market share losses, we
                     believe ITC’s commitment to categories like soaps, shampoos and skin care is a
                     major threat for HUL in the long run.

                     OPM to decline as re-investment in ad-spend to sustain: Over FY2010-12E, we
                     have modeled in 100bp reduction in OPM (130bp in FY2011E) despite
                     incremental gains from cost rationalisation measures and moderate decline in
                     gross margins, as we expect ad spend to rise to ~14.5-15% levels from current
                     13.6% (reflected in 1QFY2011 results) due to high competitive intensity. Hence,
                     we expect EBITDA to log a muted 7% CAGR over FY2010-12E

                     Rich valuations for subdued 8% CAGR unjustified: At the CMP of Rs253, HUL is
                     trading at rich valuations of 22.5x FY2012E earnings, which is unjustified given
                     the subdued 8% CAGR expected over FY2010-12E (~3x PEG) vis-à-vis sector
                     growth (ex-HUL) of ~15-18%. In terms of historical valuations, HUL is trading at
                     50% premium to the Sensex (in line with the 5-yr average) and ~5% discount of
                     5-yr average P/E leaving little room for upside.


                Outlook and Valuation

                Post another quarter of weak results on the operational front, we have revised our
                earnings estimates downwards by ~1-2% modeling in lower OPMs on account of the
                significant increase in ad spends.

                Exhibit 11: Change in Estimates
                                   Old Estimate             New Estimate               % chg
                (Rs cr)         FY11E       FY12E         FY11E       FY12E       FY11E      FY12E
                Revenue        19,305      21,530        19,343      21,515          0.2       (0.1)
                OPM (%)           13.5       13.7          13.2         13.6      (30bp)    (15bp)
                EPS (Rs)          10.1       11.4           9.9         11.2        (2.1)     (1.2)
                Source: Company, Angel Research

                We expect HUL to post 10.8% CAGR in top-line over FY2010-12E, despite the steep
                price cuts largely aided by steady performance of its personal care and foods
                divisions (aided by innovations and higher ad spends), spike in detergents volume
                (due to price cuts) and modest performance of its soaps business (aided by brand
                re-launches and select price cuts). In terms of earnings, we expect HUL to post weak
                8% CAGR during the period impacted by the dip in margins (due to the price cuts)
                and higher tax rate (on account of increase in MAT). However, further price cuts,
                spillover of price war to other categories and poor response to brand re-launches,
                promotions and price cuts carry downside risks to our estimates.

                At the CMP of Rs252, the stock is trading at 22.5x FY2012E earnings. We maintain
                Reduce on the stock with a Target Price of Rs237 (based on 21x FY2012E EPS) owing
                to weak earnings growth vis-à-vis the FMCG sector, uncertain earnings environment
                and significantly higher competitive intensity.


July 28, 2010                                                                                          6
HUL | 1QFY2011 Result Update


Exhibit 12: Key Assumptions
                                                           FY2009#                 FY2010                  FY2011E        FY2012E
 Gross top-line (Rs cr)
 Soaps & Detergents                                           8,146                 8,266                     8,596         9,370
 Personal Products                                            4,366                 5,048                     5,780         6,531
 Beverages                                                    1,869                 2,142                     2,432         2,736
 Processed Foods                                                656                   731                       848           966
 Ice Creams                                                     198                   231                       268           303
 Exports                                                      1,177                 1,005                     1,126         1,250
 Others                                                         314                   347                       409           475
 Top-line growth (%)
 Soaps & Detergents                                                 -                  1.5                      4.0           9.0
 Personal Products                                                  -                 15.6                     14.5          13.0
 Beverages                                                          -                 14.7                     13.5          12.5
 Processed Foods                                                    -                 11.3                     16.0          14.0
 Ice Creams                                                         -                 16.5                     16.0          13.0
 Exports                                                            -               (14.6)                     12.0          11.0
 Others                                                             -                 10.3                     18.0          16.0
 PBIT (Rs cr)
 Soaps & Detergents                                           1,249                 1,185                     1,053         1,218
 Personal Products                                            1,183                 1,297                     1,517         1,731
 Beverages                                                       255                  320                       347           397
 Processed Foods                                                  (2)                    4                        13            17
 Ice Creams                                                       11                    13                        15            18
 Exports                                                          90                    59                        70            81
 Others                                                        (104)                  (72)                      (74)          (66)
 PBIT Margin (%)
 Soaps & Detergents                                             15.3                  14.3                      12.3          13.0
 Personal Products                                              27.1                  25.7                      26.3          26.5
 Beverages                                                      13.6                  14.9                      14.3          14.5
 Processed Foods                                               (0.3)                   0.6                       1.5           1.8
 Ice Creams                                                      5.6                   5.5                       5.5           5.8
 Exports                                                         7.7                   5.8                       6.3           6.5
 Others                                                       (33.1)                (20.8)                    (18.0)        (14.0)
Source: Company, Angel Research; # Note: FY2009 numbers are comparable 12 months numbers given for comparative purpose


July 28, 2010                                                                                                                        7
HUL | 1QFY2011 Result Update


Exhibit 13: Peer Valuation
 Company                 Reco                                Mcap                 CMP                    TP*               Upside                P/E (x)                             EV/Sales (x)       RoE (%)               CAGR #
                                                            (Rs cr)                (Rs)                  (Rs)                 (%)            FY11E FY12E                           FY11E FY12E       FY11E FY12E            Sales  PAT
 Asian Paints            Accumulate                        24,939                2,600                  2,773                       6.6       27.4                          23.4      3.2     2.6         40.8       37.8   17.5         17.4
 Colgate                 Reduce                            11,542                     849                798                    (6.0)         26.9                          23.5      4.9     4.3     117.3      108.8      14.3          7.8
 Dabur                   Neutral                           17,254                     200                195                    (2.7)         30.7                          25.7      4.3     3.6         39.9       39.1   17.4         16.0
 GSKCHL                  Reduce                              7,612               1,810                  1,622                (10.4)           27.8                          23.4      3.0     2.5         27.7       27.8   17.8         18.8
 GCPL                    Accumulate                        11,318                     350                397                    13.4          24.4                          19.4      3.6     2.9         34.2       30.1   44.5         27.9
 HUL                     Reduce                            54,970                     252                237                    (6.1)         25.5                          22.5      2.7     2.4         73.0       72.8   10.8          7.9
 ITC                     Neutral                          115,575                     307                310                        1.0       24.4                          21.8      5.2     4.5         31.4       30.1   14.4         15.2
 Marico                  Neutral                             7,676                    126                124                    (1.6)         26.6                          22.4      2.5     2.2         37.3       33.0   16.1         19.3
 Nestle                  Neutral                           28,493                2,955                  2,955                       0.0       36.2                          30.0      4.7     4.1     118.2      118.6      16.5         20.4
                                                                             #
Source: Company, Angel Research, Note: denotes CAGR for FY2010-12E, * In case of Neutral recommendation, TP = Fair value

Exhibit 14: Angel v/s Consensus estimates
 Top-line (Rs cr)                                                            FY2011E                                       FY2012E            EPS (Rs)                                                    FY2011E             FY2012E
 Angel estimates                                                              19,343                                        21,515            Angel estimates                                                  9.9               11.2
 Consensus                                                                    19,288                                        21,478            Consensus                                                      10.4                11.7
 Diff (%)                                                                         0.3                                           0.2           Diff (%)                                                       (4.9)               (4.0)
Source: Company, Angel Research

Exhibit 15: Returns - HUL v/s Sensex (Indexed to 100)                                                                                         Exhibit 16: One-yr forward P/E band

   200%                                                                                                                                                             350               18x           21x              24x           27x
                                                          Sensex                      HUL
                                                                                                                                                                    300
   150%                                                                                                                                                             250
                                                                                                                                                Share Price (Rs)


                                                                                                                                                                    200
   100%                                                                                                                                                             150
                                                                                                                                                                    100
       50%
                                                                                                                                                                        50
                                                                                                                                                                        -
       0%
                                                                                                                                                                              Jan-06


                                                                                                                                                                              Jan-07


                                                                                                                                                                              Jan-08


                                                                                                                                                                              Jan-09


                                                                                                                                                                              Jan-10
                                                                                                                                                                               Jul-05
                                                                                                                                                                              Oct-05


                                                                                                                                                                               Jul-06
                                                                                                                                                                              Oct-06


                                                                                                                                                                               Jul-07
                                                                                                                                                                              Oct-07


                                                                                                                                                                               Jul-08
                                                                                                                                                                              Oct-08


                                                                                                                                                                               Jul-09
                                                                                                                                                                              Oct-09


                                                                                                                                                                               Jul-10
                                                                                                                                                                              Apr-05


                                                                                                                                                                              Apr-06


                                                                                                                                                                              Apr-07


                                                                                                                                                                              Apr-08


                                                                                                                                                                              Apr-09


                                                                                                                                                                              Apr-10
                      Jul-07

                               Oct-07

                                        Jan-08


                                                           Jul-08

                                                                    Oct-08

                                                                             Jan-09


                                                                                               Jul-09

                                                                                                         Oct-09

                                                                                                                  Jan-10


                                                                                                                                    Jul-10
             Apr-07


                                                 Apr-08


                                                                                      Apr-09


                                                                                                                           Apr-10


Source: Company, Angel Research                                                                                                                Source: Company, Angel Research


Exhibit 17: One-yr forward P/E chart                                                                                                          Exhibit 18: One-yr forward Premium v/s Sensex chart

 40.0                                                                                                                                             200%
 35.0
                                                                                                                                                  150%
 30.0
 25.0                                                                                                                                             100%
 20.0
 15.0                                                                                                                                                     50%
 10.0
  5.0                                                                                                                                                              0%
   -
                                                                                                                                                     -50%
          Jan-03
          Jun-03


          Feb-05
           Jul-05

          May-06
          Oct-06
          Mar-07


          May-08
          Oct-08
          Mar-09

          Jan-10
          Jun-10
          Apr-02
          Aug-02


          Nov-03
          Apr-04


          Aug-07


          Aug-09
          Sep-04


          Dec-05


          Dec-07


                                                                                                                                                                        Jan-03


                                                                                                                                                                        Feb-05


                                                                                                                                                                        May-06
                                                                                                                                                                        Oct-06
                                                                                                                                                                        Mar-07


                                                                                                                                                                        May-08
                                                                                                                                                                        Oct-08
                                                                                                                                                                        Mar-09

                                                                                                                                                                        Jan-10
                                                                                                                                                                        Apr-02
                                                                                                                                                                        Aug-02


                                                                                                                                                                        Nov-03
                                                                                                                                                                        Apr-04


                                                                                                                                                                        Aug-07


                                                                                                                                                                        Aug-09
                                                                                                                                                                        Jun-03


                                                                                                                                                                        Sep-04

                                                                                                                                                                         Jul-05
                                                                                                                                                                        Dec-05


                                                                                                                                                                        Dec-07


                                                                                                                                                                        Jun-10


Source: Company, Angel Research, Note: Red line indicates 5-year average                                                                       Source: Company, Angel Research, Note: Red line indicates 5-year average


July 28, 2010                                                                                                                                                                                                                                   8
HUL | 1QFY2011 Result Update


                Profit & Loss Statement                                                                  Rs crore
                Y/E March                               CY06        CY07    FY09#     FY10     FY11E       FY12E
                Gross sales                           13,035       14,715   21,650   18,220    20,202     22,529
                Less: Excise duty                            932    1,040    1,410     696       859       1,014
                Net Sales                             12,103       13,675   20,239   17,524    19,343     21,515
                Total operating income                12,103       13,675   20,239   17,524    19,343     21,515
                % chg                                        9.4     13.0     48.0    (13.4)     10.4        11.2
                Total Expenditure                     10,455       11,797   17,583   14,975    16,790     18,595
                Cost of Materials                       6,503       7,269   10,810    8,878     9,884     11,059
                Advertising Exp                         1,273       1,440    2,131    2,391     2,863      3,098
                Personnel                                    643     768     1,152      936     1,025      1,140
                Others                                  2,037       2,320    3,490    2,770     3,018      3,297
                EBITDA                                 1,648        1,879    2,656    2,548     2,553      2,921
                % chg                                    14.2        14.0     41.4     (4.1)      0.2        14.4
                (% of Net Sales)                         13.6        13.7     13.1     14.5      13.2        13.6
                Depreciation& Amortisation                   130     138      195      184       209         228
                EBIT                                   1,518        1,740    2,461    2,364     2,344      2,693
                % chg                                    15.1        14.7     41.4     (3.9)     (0.8)       14.9
                (% of Net Sales)                         12.5        12.7     12.2     13.5      12.1        12.5
                Interest & other Charges                      11      25       25         7         1             1
                Other Income                                 355     432      590       350      460         510
                (% of PBT)                               19.0        20.1     19.5     12.9      16.4        15.9
                Share in profit of Associates                  -        -        -         -         -            -
                Recurring PBT                          1,862        2,146    3,025    2,707     2,803      3,202
                % chg                                    16.0        15.3     40.9    (10.5)      3.6        14.2
                Extraordinary Expense/(Inc.)            (316)       (182)       4       (99)        0             0
                PBT (reported)                         2,177        2,329    3,021    2,806     2,803      3,202
                Tax                                          322     403      524       604      645         752
                (% of PBT)                               17.3        18.8     17.3     22.3      23.0        23.5
                PAT (reported)                         1,540        1,743    2,501    2,103     2,159      2,449
                Add: Share of associates                       -        -        -         -         -            -
                Less: Minority interest (MI)                   -        -        -         -         -            -
                PAT after MI (reported)                1,540        1,743    2,501    2,103     2,159      2,449
                ADJ. PAT                               1,855        1,925    2,496    2,202     2,159      2,449
                % chg                                                 3.8     29.7    (11.8)     (2.0)       13.5
                (% of Net Sales)                         15.3        14.1     12.3     12.6      11.2        11.4
                Basic EPS (Rs)                               7.0      8.0     11.5      9.6       9.9       11.2
                Fully Diluted EPS (Rs)                       7.0      8.0     11.5      9.6       9.9       11.2
                % chg                                    12.4        14.7     43.3    (16.0)      2.7        13.5
                #
                    Note: FY2009 Results are for 15 Months


July 28, 2010                                                                                                 9
HUL | 1QFY2011 Result Update


                Balance Sheet                                                                               Rs crore
                Y/E March                             CY06         CY07      FY09#       FY10     FY11E       FY12E
                SOURCES OF FUNDS
                Equity Share Capital                    221          218       218        218        218        218
                Preference Capital                            -         -         -          -          -            -
                Reserves& Surplus                     2,503        1,221     1,844      2,365      2,737      3,145
                Shareholders Funds                    2,723        1,439     2,062      2,584      2,955      3,363
                Minority Interest                             -         -         -          -          -            -
                Total Loans                                  73       89       422          0          0           0
                Deferred Tax Liability                 (225)       (212)      (255)     (249)      (249)       (249)
                Total Liabilities                     2,572        1,315     2,229      2,335      2,707      3,114
                APPLICATION OF FUNDS
                Gross Block                           2,463        2,669     2,882      3,582      3,869      4,219
                Less: Acc. Depreciation               1,062        1,147     1,275      1,420      1,629      1,857
                Net Block                             1,401        1,523     1,607      2,162      2,240      2,362
                Capital Work-in-Progress                110          186       472        274        387        422
                Goodwill                                      -         -         -          -          -            -
                Investments                           2,414        1,441       333      1,264      1,764      2,264
                Current Assets                        3,170        3,277     5,601      5,368      5,697      6,247
                      Cash                              417          201     1,777      1,892      1,839      1,965
                      Loans & Advances                  765          680       758        617        696        796
                      Other                           1,988        2,397     3,066      2,858      3,162      3,486
                Current liabilities                   4,523        5,111     5,784      6,733      7,382      8,181
                Net Current Assets                  (1,353)       (1,834)     (183)    (1,365)    (1,684)    (1,934)
                Total Assets                          2,572        1,315     2,229      2,335      2,707      3,114
                #
                    Note: FY2009 Results are for 15 Months


                Cash Flow Statement                                                                         Rs crore
                Y/E March                              CY06         CY07      FY09#      FY10      FY11E       FY12E
                Profit before tax                      1,862        2,146     3,025      2,707      2,803      3,202
                Depreciation                             130          138       195        184       209         228
                Change in Working Capital                (13)         122     (330)      1,391       258         371
                Interest / Dividend (Net)               (136)       (142)     (126)      (122)      (134)       (144)
                Direct taxes paid                        322          403       524       604        645         752
                Others                                   567          (26)      (19)       (84)         8          4
                Cash Flow from Operations              2,087        1,836     2,220      3,473      2,499      2,909
                (Inc.)/ Dec. in Fixed Assets            (107)       (289)     (629)      (502)      (400)       (385)
                (Inc.)/ Dec. in Investments             (594)         998     1,167      (931)      (500)       (500)
                Cash Flow from Investing                (701)         709       538    (1,434)      (900)       (885)
                Issue of Equity                              36     (633)        39         32          0            0
                Inc./(Dec.) in loans                      16           16       333       (422)         0          0
                Dividend Paid (Incl. Tax)              1,511        2,292     1,677      1,656      1,787      2,042
                Interest / Dividend (Net)               (136)       (148)     (122)      (122)      (134)       (144)
                Cash Flow from Financing              (1,324)     (2,762)    (1,181)   (1,924)    (1,653)     (1,898)
                Inc./(Dec.) in Cash                          62     (216)     1,576        115       (53)        126
                Opening Cash balances                    355          417       201      1,777      1,892      1,839
                Closing Cash balances                    417          201     1,777      1,892      1,839      1,965
                #
                    Note: FY2009 Results are for 15 Months


July 28, 2010                                                                                                   10
HUL | 1QFY2011 Result Update


                Key Ratios
                Y/E March                           CY06     CY07      FY09#    FY10    FY11E   FY12E
                Valuation Ratio (x)
                P/E (on FDEPS)                       30.0    28.5       22.0     25.0    25.5    22.5
                P/CEPS                               33.0    29.3       20.4     24.1    23.3    20.6
                P/BV                                 20.2    38.3       26.7     21.3    18.6    16.4
                Dividend yield (%)                    2.4     3.6        3.0      2.6     2.8     3.2
                EV/Sales                              4.3     3.9        2.6      3.0     2.7     2.4
                EV/EBITDA                            31.7    28.4       20.1     20.3    20.1    17.4
                EV / Total Assets                    20.3    40.6       23.9     22.2    19.0    16.3
                Per Share Data (Rs)
                EPS (Basic)                           7.0     8.0       11.5      9.6     9.9    11.2
                EPS (fully diluted)                   7.1     8.0       11.5      9.6     9.9    11.2
                Cash EPS                              7.7     8.6       12.4     10.5    10.9    12.3
                DPS                                   6.0     9.1        7.5      6.5     7.0     8.0
                Book Value                           12.5     6.6        9.4     11.8    13.5    15.4
                Returns (%)
                RoCE                                 64.4    89.5      138.9    103.6    93.0    92.5
                Angel RoIC (Pre-tax)                     -       -          -       -       -        -
                RoE                                  61.2    83.7      142.9     90.5    77.9    77.5
                Turnover ratios (x)
                Asset Turnover                        4.9     5.1        7.0      4.9     5.0     5.1
                Inventory / Sales (days)               47      52         46      45      46      46
                Receivables (days)                     13      12         10      14      14      14
                Payables (days)                        97     102         77     110     110     109
                Net Working capital (days)            (53)    (54)       (35)    (68)    (66)    (66)
                #
                    Note: FY2009 Results are for 15 Months


July 28, 2010                                                                                   11
HUL | 1QFY2011 Result Update


 Research Team Tel: 022 - 4040 3800                    E-mail: research@angeltrade.com                    Website: www.angeltrade.com

 Disclaimer
 This document is solely for the personal information of the recipient, and must not be singularly used as the basis of any investment
 decision. Nothing in this document should be construed as investment or financial advice. Each recipient of this document should make
 such investigations as they deem necessary to arrive at an independent evaluation of an investment in the securities of the companies
 referred to in this document (including the merits and risks involved), and should consult their own advisors to determine the merits and
 risks of such an investment.
 Angel Broking Limited, its affiliates, directors, its proprietary trading and investment businesses may, from time to time, make
 investment decisions that are inconsistent with or contradictory to the recommendations expressed herein. The views contained in this
 document are those of the analyst, and the company may or may not subscribe to all the views expressed within.
 Reports based on technical and derivative analysis center on studying charts of a stock's price movement, outstanding positions and
 trading volume, as opposed to focusing on a company's fundamentals and, as such, may not match with a report on a company's
 fundamentals.
 The information in this document has been printed on the basis of publicly available information, internal data and other reliable
 sources believed to be true, but we do not represent that it is accurate or complete and it should not be relied on as such, as this
 document is for general guidance only. Angel Broking Limited or any of its affiliates/ group companies shall not be in any way
 responsible for any loss or damage that may arise to any person from any inadvertent error in the information contained in this report.
 Angel Broking Limited has not independently verified all the information contained within this document. Accordingly, we cannot testify,
 nor make any representation or warranty, express or implied, to the accuracy, contents or data contained within this document. While
 Angel Broking Limited endeavours to update on a reasonable basis the information discussed in this material, there may be regulatory,
 compliance, or other reasons that prevent us from doing so.
 This document is being supplied to you solely for your information, and its contents, information or data may not be reproduced,
 redistributed or passed on, directly or indirectly.
 Angel Broking Limited and its affiliates may seek to provide or have engaged in providing corporate finance, investment banking or
 other advisory services in a merger or specific transaction to the companies referred to in this report, as on the date of this report or in
 the past.
 Neither Angel Broking Limited, nor its directors, employees or affiliates shall be liable for any loss or damage that may arise from or in
 connection with the use of this information.
 Note: Please refer to the important `Stock Holding Disclosure' report on the Angel website (Research Section). Also, please refer to the
 latest update on respective stocks for the disclosure status in respect of those stocks. Angel Broking Limited and its affiliates may have
 investment positions in the stocks recommended in this report.


 Disclosure of Interest Statement                                                      HUL
 1. Analyst ownership of the stock                                                     No
 2. Angel and its Group companies ownership of the stock                               No
 3. Angel and its Group companies' Directors ownership of the stock                    No
 4. Broking relationship with company covered                                          No

 Note: We have not considered any Exposure below Rs 1 lakh for Angel, its Group companies and Directors.


 Ratings (Returns) :             Buy (> 15%)                      Accumulate (5% to 15%)                 Neutral (-5 to 5%)
                                 Reduce (-5% to 15%)              Sell (< -15%)

July 28, 2010                                                                                                                             12

More Related Content

What's hot

What's hot (19)

Dchl ru4 qfy2010-140510
Dchl ru4 qfy2010-140510Dchl ru4 qfy2010-140510
Dchl ru4 qfy2010-140510
 
Gcpl Result Update
Gcpl Result UpdateGcpl Result Update
Gcpl Result Update
 
Jyoti structures ru4 qfy2010-240510
Jyoti structures ru4 qfy2010-240510Jyoti structures ru4 qfy2010-240510
Jyoti structures ru4 qfy2010-240510
 
Mcnally Bharat
Mcnally BharatMcnally Bharat
Mcnally Bharat
 
Lupin
LupinLupin
Lupin
 
Dabur
Dabur Dabur
Dabur
 
Rallis
RallisRallis
Rallis
 
Greenply
Greenply Greenply
Greenply
 
McNally Result Update 4qfy2010-180510
McNally Result Update 4qfy2010-180510McNally Result Update 4qfy2010-180510
McNally Result Update 4qfy2010-180510
 
Hindalco
Hindalco Hindalco
Hindalco
 
Alembic
Alembic Alembic
Alembic
 
GCPL
GCPLGCPL
GCPL
 
Bajaj Electricals
Bajaj ElectricalsBajaj Electricals
Bajaj Electricals
 
Hindalco Novelis
Hindalco Novelis Hindalco Novelis
Hindalco Novelis
 
Graphite india ru4 qfy2010-140510
Graphite india ru4 qfy2010-140510Graphite india ru4 qfy2010-140510
Graphite india ru4 qfy2010-140510
 
Bayer India- Result Update
Bayer India- Result UpdateBayer India- Result Update
Bayer India- Result Update
 
Sail steel ru4 qfy2010-310510
Sail steel ru4 qfy2010-310510Sail steel ru4 qfy2010-310510
Sail steel ru4 qfy2010-310510
 
Shoppers stop result update 4 qfy2010 040510
Shoppers stop result update 4 qfy2010 040510Shoppers stop result update 4 qfy2010 040510
Shoppers stop result update 4 qfy2010 040510
 
RIL - result Update
RIL - result UpdateRIL - result Update
RIL - result Update
 

Viewers also liked

Technical Report - September 8, 2010
Technical Report - September 8, 2010Technical Report - September 8, 2010
Technical Report - September 8, 2010Angel Broking
 
Weekly Review - June 26, 2010
Weekly Review - June 26, 2010Weekly Review - June 26, 2010
Weekly Review - June 26, 2010Angel Broking
 
Market Outlook - 8 October 2010
Market Outlook - 8 October 2010Market Outlook - 8 October 2010
Market Outlook - 8 October 2010Angel Broking
 
Derivatives report 28 oct-2010
Derivatives report 28 oct-2010Derivatives report 28 oct-2010
Derivatives report 28 oct-2010Angel Broking
 
Gail ru4 qfy2010-18-05-10
Gail ru4 qfy2010-18-05-10Gail ru4 qfy2010-18-05-10
Gail ru4 qfy2010-18-05-10Angel Broking
 
Derivatives Report-July 21, 2010
Derivatives Report-July 21, 2010Derivatives Report-July 21, 2010
Derivatives Report-July 21, 2010Angel Broking
 
Derivatives report - 8 October 2010
Derivatives report - 8 October 2010Derivatives report - 8 October 2010
Derivatives report - 8 October 2010Angel Broking
 
Cadila ru2 qfy2011-191010
Cadila ru2 qfy2011-191010Cadila ru2 qfy2011-191010
Cadila ru2 qfy2011-191010Angel Broking
 
Derivatives Report - September 8, 2010
Derivatives Report - September 8, 2010Derivatives Report - September 8, 2010
Derivatives Report - September 8, 2010Angel Broking
 
Sail ru2 qfy2011-291010
Sail ru2 qfy2011-291010Sail ru2 qfy2011-291010
Sail ru2 qfy2011-291010Angel Broking
 
Derivatives report 02 june-2010
Derivatives report 02 june-2010Derivatives report 02 june-2010
Derivatives report 02 june-2010Angel Broking
 
Market outlook 28 05-10
Market outlook 28 05-10Market outlook 28 05-10
Market outlook 28 05-10Angel Broking
 
Derivatives report 30 apr-2010
Derivatives report 30 apr-2010Derivatives report 30 apr-2010
Derivatives report 30 apr-2010Angel Broking
 
Technical report - August 20, 2010
Technical report - August 20, 2010Technical report - August 20, 2010
Technical report - August 20, 2010Angel Broking
 
Derivatives Report - july 30, 2010
Derivatives Report - july 30, 2010Derivatives Report - july 30, 2010
Derivatives Report - july 30, 2010Angel Broking
 

Viewers also liked (20)

Technical Report - September 8, 2010
Technical Report - September 8, 2010Technical Report - September 8, 2010
Technical Report - September 8, 2010
 
Weekly Review - June 26, 2010
Weekly Review - June 26, 2010Weekly Review - June 26, 2010
Weekly Review - June 26, 2010
 
Market Outlook - 8 October 2010
Market Outlook - 8 October 2010Market Outlook - 8 October 2010
Market Outlook - 8 October 2010
 
Aurobindo Pharma
Aurobindo Pharma Aurobindo Pharma
Aurobindo Pharma
 
Derivatives report 28 oct-2010
Derivatives report 28 oct-2010Derivatives report 28 oct-2010
Derivatives report 28 oct-2010
 
Gail ru4 qfy2010-18-05-10
Gail ru4 qfy2010-18-05-10Gail ru4 qfy2010-18-05-10
Gail ru4 qfy2010-18-05-10
 
Derivatives Report-July 21, 2010
Derivatives Report-July 21, 2010Derivatives Report-July 21, 2010
Derivatives Report-July 21, 2010
 
Derivatives report - 8 October 2010
Derivatives report - 8 October 2010Derivatives report - 8 October 2010
Derivatives report - 8 October 2010
 
Cadila ru2 qfy2011-191010
Cadila ru2 qfy2011-191010Cadila ru2 qfy2011-191010
Cadila ru2 qfy2011-191010
 
Derivatives Report - September 8, 2010
Derivatives Report - September 8, 2010Derivatives Report - September 8, 2010
Derivatives Report - September 8, 2010
 
Sail ru2 qfy2011-291010
Sail ru2 qfy2011-291010Sail ru2 qfy2011-291010
Sail ru2 qfy2011-291010
 
Derivatives report 02 june-2010
Derivatives report 02 june-2010Derivatives report 02 june-2010
Derivatives report 02 june-2010
 
Ashoke Leyland
Ashoke LeylandAshoke Leyland
Ashoke Leyland
 
BRCM
BRCMBRCM
BRCM
 
Market outlook 28 05-10
Market outlook 28 05-10Market outlook 28 05-10
Market outlook 28 05-10
 
Derivatives report 30 apr-2010
Derivatives report 30 apr-2010Derivatives report 30 apr-2010
Derivatives report 30 apr-2010
 
DLF
DLFDLF
DLF
 
Bank of India
Bank of India Bank of India
Bank of India
 
Technical report - August 20, 2010
Technical report - August 20, 2010Technical report - August 20, 2010
Technical report - August 20, 2010
 
Derivatives Report - july 30, 2010
Derivatives Report - july 30, 2010Derivatives Report - july 30, 2010
Derivatives Report - july 30, 2010
 

Similar to HUL (20)

Hul ru4 qfy2010-250510
Hul ru4 qfy2010-250510Hul ru4 qfy2010-250510
Hul ru4 qfy2010-250510
 
Bharat Forge
Bharat ForgeBharat Forge
Bharat Forge
 
Marico
Marico Marico
Marico
 
Deccan Chronicle
Deccan Chronicle Deccan Chronicle
Deccan Chronicle
 
Subros
Subros Subros
Subros
 
Tech Mahindra
Tech Mahindra Tech Mahindra
Tech Mahindra
 
JP Associates
JP AssociatesJP Associates
JP Associates
 
Gipcl
Gipcl Gipcl
Gipcl
 
Jagran Prakashan
Jagran PrakashanJagran Prakashan
Jagran Prakashan
 
Fag y2010-220410
Fag y2010-220410Fag y2010-220410
Fag y2010-220410
 
ONGC
ONGCONGC
ONGC
 
Colgate ru4 qfy2010-270510
Colgate ru4 qfy2010-270510Colgate ru4 qfy2010-270510
Colgate ru4 qfy2010-270510
 
Blue Star
Blue StarBlue Star
Blue Star
 
SAIL
SAILSAIL
SAIL
 
Asian Paints
Asian PaintsAsian Paints
Asian Paints
 
GAIL
GAILGAIL
GAIL
 
Sun TV
Sun TVSun TV
Sun TV
 
Marico Result Update
Marico Result UpdateMarico Result Update
Marico Result Update
 
Dlf ru4 qfy2010-17052010
Dlf  ru4 qfy2010-17052010Dlf  ru4 qfy2010-17052010
Dlf ru4 qfy2010-17052010
 
Ongc ru4 qfy2010-280510
Ongc ru4 qfy2010-280510Ongc ru4 qfy2010-280510
Ongc ru4 qfy2010-280510
 

More from Angel Broking

Market outlook 110612
Market outlook 110612Market outlook 110612
Market outlook 110612Angel Broking
 
Axis%20 bank ru1qfy2012-220711
Axis%20 bank ru1qfy2012-220711Axis%20 bank ru1qfy2012-220711
Axis%20 bank ru1qfy2012-220711Angel Broking
 
Electrosteel castings
Electrosteel castingsElectrosteel castings
Electrosteel castingsAngel Broking
 
Derivative report 19th July 2011
Derivative report 19th July 2011Derivative report 19th July 2011
Derivative report 19th July 2011Angel Broking
 
Market outlook 19th July 2011
Market outlook 19th July 2011Market outlook 19th July 2011
Market outlook 19th July 2011Angel Broking
 
Weekly Report 18th July 2011
Weekly Report 18th July 2011Weekly Report 18th July 2011
Weekly Report 18th July 2011Angel Broking
 
Derivative Report 18th July 2011
Derivative Report 18th July 2011Derivative Report 18th July 2011
Derivative Report 18th July 2011Angel Broking
 
Technical Report 18th July 2011
Technical Report 18th July 2011Technical Report 18th July 2011
Technical Report 18th July 2011Angel Broking
 
Market Outlook 18th July 2011
Market Outlook 18th July 2011Market Outlook 18th July 2011
Market Outlook 18th July 2011Angel Broking
 
Bajaj auto Result Updated
Bajaj auto Result UpdatedBajaj auto Result Updated
Bajaj auto Result UpdatedAngel Broking
 
Tata consultancy services
Tata consultancy services Tata consultancy services
Tata consultancy services Angel Broking
 
Derivatives Report 15th July 2011
Derivatives Report 15th July 2011Derivatives Report 15th July 2011
Derivatives Report 15th July 2011Angel Broking
 
Technical Report 15th July 2011
Technical Report 15th July 2011Technical Report 15th July 2011
Technical Report 15th July 2011Angel Broking
 
Infosys Result Updated
Infosys Result UpdatedInfosys Result Updated
Infosys Result UpdatedAngel Broking
 
Derivative Report 13th July 2011
Derivative Report 13th July 2011Derivative Report 13th July 2011
Derivative Report 13th July 2011Angel Broking
 

More from Angel Broking (20)

Market outlook 110612
Market outlook 110612Market outlook 110612
Market outlook 110612
 
Axis%20 bank ru1qfy2012-220711
Axis%20 bank ru1qfy2012-220711Axis%20 bank ru1qfy2012-220711
Axis%20 bank ru1qfy2012-220711
 
Electrosteel castings
Electrosteel castingsElectrosteel castings
Electrosteel castings
 
Persistent systems
Persistent systemsPersistent systems
Persistent systems
 
Ht media
Ht mediaHt media
Ht media
 
Derivative report 19th July 2011
Derivative report 19th July 2011Derivative report 19th July 2011
Derivative report 19th July 2011
 
Market outlook 19th July 2011
Market outlook 19th July 2011Market outlook 19th July 2011
Market outlook 19th July 2011
 
Telecom sector
Telecom sectorTelecom sector
Telecom sector
 
Weekly Report 18th July 2011
Weekly Report 18th July 2011Weekly Report 18th July 2011
Weekly Report 18th July 2011
 
Derivative Report 18th July 2011
Derivative Report 18th July 2011Derivative Report 18th July 2011
Derivative Report 18th July 2011
 
Technical Report 18th July 2011
Technical Report 18th July 2011Technical Report 18th July 2011
Technical Report 18th July 2011
 
Market Outlook 18th July 2011
Market Outlook 18th July 2011Market Outlook 18th July 2011
Market Outlook 18th July 2011
 
South Indian Bank
 South Indian Bank South Indian Bank
South Indian Bank
 
Bajaj auto Result Updated
Bajaj auto Result UpdatedBajaj auto Result Updated
Bajaj auto Result Updated
 
Tata consultancy services
Tata consultancy services Tata consultancy services
Tata consultancy services
 
Fc4 e63c4d01
Fc4 e63c4d01Fc4 e63c4d01
Fc4 e63c4d01
 
Derivatives Report 15th July 2011
Derivatives Report 15th July 2011Derivatives Report 15th July 2011
Derivatives Report 15th July 2011
 
Technical Report 15th July 2011
Technical Report 15th July 2011Technical Report 15th July 2011
Technical Report 15th July 2011
 
Infosys Result Updated
Infosys Result UpdatedInfosys Result Updated
Infosys Result Updated
 
Derivative Report 13th July 2011
Derivative Report 13th July 2011Derivative Report 13th July 2011
Derivative Report 13th July 2011
 

Recently uploaded

VIP Call Girls LB Nagar ( Hyderabad ) Phone 8250192130 | ₹5k To 25k With Room...
VIP Call Girls LB Nagar ( Hyderabad ) Phone 8250192130 | ₹5k To 25k With Room...VIP Call Girls LB Nagar ( Hyderabad ) Phone 8250192130 | ₹5k To 25k With Room...
VIP Call Girls LB Nagar ( Hyderabad ) Phone 8250192130 | ₹5k To 25k With Room...Suhani Kapoor
 
Q3 2024 Earnings Conference Call and Webcast Slides
Q3 2024 Earnings Conference Call and Webcast SlidesQ3 2024 Earnings Conference Call and Webcast Slides
Q3 2024 Earnings Conference Call and Webcast SlidesMarketing847413
 
magnetic-pensions-a-new-blueprint-for-the-dc-landscape.pdf
magnetic-pensions-a-new-blueprint-for-the-dc-landscape.pdfmagnetic-pensions-a-new-blueprint-for-the-dc-landscape.pdf
magnetic-pensions-a-new-blueprint-for-the-dc-landscape.pdfHenry Tapper
 
Instant Issue Debit Cards - High School Spirit
Instant Issue Debit Cards - High School SpiritInstant Issue Debit Cards - High School Spirit
Instant Issue Debit Cards - High School Spiritegoetzinger
 
Monthly Market Risk Update: April 2024 [SlideShare]
Monthly Market Risk Update: April 2024 [SlideShare]Monthly Market Risk Update: April 2024 [SlideShare]
Monthly Market Risk Update: April 2024 [SlideShare]Commonwealth
 
Call Girls In Yusuf Sarai Women Seeking Men 9654467111
Call Girls In Yusuf Sarai Women Seeking Men 9654467111Call Girls In Yusuf Sarai Women Seeking Men 9654467111
Call Girls In Yusuf Sarai Women Seeking Men 9654467111Sapana Sha
 
VIP Kolkata Call Girl Serampore 👉 8250192130 Available With Room
VIP Kolkata Call Girl Serampore 👉 8250192130  Available With RoomVIP Kolkata Call Girl Serampore 👉 8250192130  Available With Room
VIP Kolkata Call Girl Serampore 👉 8250192130 Available With Roomdivyansh0kumar0
 
Stock Market Brief Deck for 4/24/24 .pdf
Stock Market Brief Deck for 4/24/24 .pdfStock Market Brief Deck for 4/24/24 .pdf
Stock Market Brief Deck for 4/24/24 .pdfMichael Silva
 
Andheri Call Girls In 9825968104 Mumbai Hot Models
Andheri Call Girls In 9825968104 Mumbai Hot ModelsAndheri Call Girls In 9825968104 Mumbai Hot Models
Andheri Call Girls In 9825968104 Mumbai Hot Modelshematsharma006
 
OAT_RI_Ep19 WeighingTheRisks_Apr24_TheYellowMetal.pptx
OAT_RI_Ep19 WeighingTheRisks_Apr24_TheYellowMetal.pptxOAT_RI_Ep19 WeighingTheRisks_Apr24_TheYellowMetal.pptx
OAT_RI_Ep19 WeighingTheRisks_Apr24_TheYellowMetal.pptxhiddenlevers
 
Stock Market Brief Deck for "this does not happen often".pdf
Stock Market Brief Deck for "this does not happen often".pdfStock Market Brief Deck for "this does not happen often".pdf
Stock Market Brief Deck for "this does not happen often".pdfMichael Silva
 
Classical Theory of Macroeconomics by Adam Smith
Classical Theory of Macroeconomics by Adam SmithClassical Theory of Macroeconomics by Adam Smith
Classical Theory of Macroeconomics by Adam SmithAdamYassin2
 
Lundin Gold April 2024 Corporate Presentation v4.pdf
Lundin Gold April 2024 Corporate Presentation v4.pdfLundin Gold April 2024 Corporate Presentation v4.pdf
Lundin Gold April 2024 Corporate Presentation v4.pdfAdnet Communications
 
Quantitative Analysis of Retail Sector Companies
Quantitative Analysis of Retail Sector CompaniesQuantitative Analysis of Retail Sector Companies
Quantitative Analysis of Retail Sector Companiesprashantbhati354
 
原版1:1复刻堪萨斯大学毕业证KU毕业证留信学历认证
原版1:1复刻堪萨斯大学毕业证KU毕业证留信学历认证原版1:1复刻堪萨斯大学毕业证KU毕业证留信学历认证
原版1:1复刻堪萨斯大学毕业证KU毕业证留信学历认证jdkhjh
 
The Triple Threat | Article on Global Resession | Harsh Kumar
The Triple Threat | Article on Global Resession | Harsh KumarThe Triple Threat | Article on Global Resession | Harsh Kumar
The Triple Threat | Article on Global Resession | Harsh KumarHarsh Kumar
 
letter-from-the-chair-to-the-fca-relating-to-british-steel-pensions-scheme-15...
letter-from-the-chair-to-the-fca-relating-to-british-steel-pensions-scheme-15...letter-from-the-chair-to-the-fca-relating-to-british-steel-pensions-scheme-15...
letter-from-the-chair-to-the-fca-relating-to-british-steel-pensions-scheme-15...Henry Tapper
 
call girls in Nand Nagri (DELHI) 🔝 >༒9953330565🔝 genuine Escort Service 🔝✔️✔️
call girls in  Nand Nagri (DELHI) 🔝 >༒9953330565🔝 genuine Escort Service 🔝✔️✔️call girls in  Nand Nagri (DELHI) 🔝 >༒9953330565🔝 genuine Escort Service 🔝✔️✔️
call girls in Nand Nagri (DELHI) 🔝 >༒9953330565🔝 genuine Escort Service 🔝✔️✔️9953056974 Low Rate Call Girls In Saket, Delhi NCR
 

Recently uploaded (20)

VIP Call Girls LB Nagar ( Hyderabad ) Phone 8250192130 | ₹5k To 25k With Room...
VIP Call Girls LB Nagar ( Hyderabad ) Phone 8250192130 | ₹5k To 25k With Room...VIP Call Girls LB Nagar ( Hyderabad ) Phone 8250192130 | ₹5k To 25k With Room...
VIP Call Girls LB Nagar ( Hyderabad ) Phone 8250192130 | ₹5k To 25k With Room...
 
Q3 2024 Earnings Conference Call and Webcast Slides
Q3 2024 Earnings Conference Call and Webcast SlidesQ3 2024 Earnings Conference Call and Webcast Slides
Q3 2024 Earnings Conference Call and Webcast Slides
 
magnetic-pensions-a-new-blueprint-for-the-dc-landscape.pdf
magnetic-pensions-a-new-blueprint-for-the-dc-landscape.pdfmagnetic-pensions-a-new-blueprint-for-the-dc-landscape.pdf
magnetic-pensions-a-new-blueprint-for-the-dc-landscape.pdf
 
Instant Issue Debit Cards - High School Spirit
Instant Issue Debit Cards - High School SpiritInstant Issue Debit Cards - High School Spirit
Instant Issue Debit Cards - High School Spirit
 
Monthly Market Risk Update: April 2024 [SlideShare]
Monthly Market Risk Update: April 2024 [SlideShare]Monthly Market Risk Update: April 2024 [SlideShare]
Monthly Market Risk Update: April 2024 [SlideShare]
 
Call Girls In Yusuf Sarai Women Seeking Men 9654467111
Call Girls In Yusuf Sarai Women Seeking Men 9654467111Call Girls In Yusuf Sarai Women Seeking Men 9654467111
Call Girls In Yusuf Sarai Women Seeking Men 9654467111
 
VIP Kolkata Call Girl Serampore 👉 8250192130 Available With Room
VIP Kolkata Call Girl Serampore 👉 8250192130  Available With RoomVIP Kolkata Call Girl Serampore 👉 8250192130  Available With Room
VIP Kolkata Call Girl Serampore 👉 8250192130 Available With Room
 
Monthly Economic Monitoring of Ukraine No 231, April 2024
Monthly Economic Monitoring of Ukraine No 231, April 2024Monthly Economic Monitoring of Ukraine No 231, April 2024
Monthly Economic Monitoring of Ukraine No 231, April 2024
 
Stock Market Brief Deck for 4/24/24 .pdf
Stock Market Brief Deck for 4/24/24 .pdfStock Market Brief Deck for 4/24/24 .pdf
Stock Market Brief Deck for 4/24/24 .pdf
 
Andheri Call Girls In 9825968104 Mumbai Hot Models
Andheri Call Girls In 9825968104 Mumbai Hot ModelsAndheri Call Girls In 9825968104 Mumbai Hot Models
Andheri Call Girls In 9825968104 Mumbai Hot Models
 
OAT_RI_Ep19 WeighingTheRisks_Apr24_TheYellowMetal.pptx
OAT_RI_Ep19 WeighingTheRisks_Apr24_TheYellowMetal.pptxOAT_RI_Ep19 WeighingTheRisks_Apr24_TheYellowMetal.pptx
OAT_RI_Ep19 WeighingTheRisks_Apr24_TheYellowMetal.pptx
 
Stock Market Brief Deck for "this does not happen often".pdf
Stock Market Brief Deck for "this does not happen often".pdfStock Market Brief Deck for "this does not happen often".pdf
Stock Market Brief Deck for "this does not happen often".pdf
 
Classical Theory of Macroeconomics by Adam Smith
Classical Theory of Macroeconomics by Adam SmithClassical Theory of Macroeconomics by Adam Smith
Classical Theory of Macroeconomics by Adam Smith
 
Lundin Gold April 2024 Corporate Presentation v4.pdf
Lundin Gold April 2024 Corporate Presentation v4.pdfLundin Gold April 2024 Corporate Presentation v4.pdf
Lundin Gold April 2024 Corporate Presentation v4.pdf
 
Quantitative Analysis of Retail Sector Companies
Quantitative Analysis of Retail Sector CompaniesQuantitative Analysis of Retail Sector Companies
Quantitative Analysis of Retail Sector Companies
 
原版1:1复刻堪萨斯大学毕业证KU毕业证留信学历认证
原版1:1复刻堪萨斯大学毕业证KU毕业证留信学历认证原版1:1复刻堪萨斯大学毕业证KU毕业证留信学历认证
原版1:1复刻堪萨斯大学毕业证KU毕业证留信学历认证
 
🔝+919953056974 🔝young Delhi Escort service Pusa Road
🔝+919953056974 🔝young Delhi Escort service Pusa Road🔝+919953056974 🔝young Delhi Escort service Pusa Road
🔝+919953056974 🔝young Delhi Escort service Pusa Road
 
The Triple Threat | Article on Global Resession | Harsh Kumar
The Triple Threat | Article on Global Resession | Harsh KumarThe Triple Threat | Article on Global Resession | Harsh Kumar
The Triple Threat | Article on Global Resession | Harsh Kumar
 
letter-from-the-chair-to-the-fca-relating-to-british-steel-pensions-scheme-15...
letter-from-the-chair-to-the-fca-relating-to-british-steel-pensions-scheme-15...letter-from-the-chair-to-the-fca-relating-to-british-steel-pensions-scheme-15...
letter-from-the-chair-to-the-fca-relating-to-british-steel-pensions-scheme-15...
 
call girls in Nand Nagri (DELHI) 🔝 >༒9953330565🔝 genuine Escort Service 🔝✔️✔️
call girls in  Nand Nagri (DELHI) 🔝 >༒9953330565🔝 genuine Escort Service 🔝✔️✔️call girls in  Nand Nagri (DELHI) 🔝 >༒9953330565🔝 genuine Escort Service 🔝✔️✔️
call girls in Nand Nagri (DELHI) 🔝 >༒9953330565🔝 genuine Escort Service 🔝✔️✔️
 

HUL

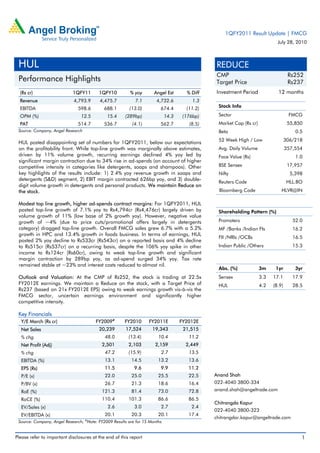
  • 1. 1QFY2011 Result Update | FMCG July 28, 2010 HUL REDUCE CMP Rs252 Performance Highlights Target Price Rs237 (Rs cr) 1QFY11 1QFY10 % yoy Angel Est % Diff Investment Period 12 months Revenue 4,793.9 4,475.7 7.1 4,732.6 1.3 EBITDA 598.6 688.1 (13.0) 674.4 (11.2) Stock Info OPM (%) 12.5 15.4 (289bp) 14.3 (176bp) Sector FMCG PAT 514.7 536.7 (4.1) 562.7 (8.5) Market Cap (Rs cr) 55,850 Source: Company, Angel Research Beta 0.5 52 Week High / Low 306/218 HUL posted disappointing set of numbers for 1QFY2011, below our expectations on the profitability front. While top-line growth was marginally above estimates, Avg. Daily Volume 357,554 driven by 11% volume growth, recurring earnings declined 4% yoy led by Face Value (Rs) 1.0 significant margin contraction due to 34% rise in ad-spends (on account of higher competitive intensity in categories like detergents, soaps and shampoos). Other BSE Sensex 17,957 key highlights of the results include: 1) 2.4% yoy revenue growth in soaps and Nifty 5,398 detergents (S&D) segment, 2) EBIT margin contracted 626bp yoy, and 3) double- Reuters Code HLL.BO digit volume growth in detergents and personal products. We maintain Reduce on the stock. Bloomberg Code HLVR@IN Modest top line growth, higher ad-spends contract margins: For 1QFY2011, HUL posted top-line growth of 7.1% yoy to Rs4,794cr (Rs4,476cr) largely driven by Shareholding Pattern (%) volume growth of 11% (low base of 2% growth yoy). However, negative value growth of ~4% (due to price cuts/promotional offers largely in detergents Promoters 52.0 category) dragged top-line growth. Overall FMCG sales grew 6.7% with a 5.2% MF /Banks /Indian FIs 16.2 growth in HPC and 13.4% growth in foods business. In terms of earnings, HUL FII /NRIs /OCBs 16.5 posted 2% yoy decline to Rs533cr (Rs543cr) on a reported basis and 4% decline to Rs515cr (Rs537cr) on a recurring basis, despite the 106% yoy spike in other Indian Public /Others 15.3 income to Rs124cr (Rs60cr), owing to weak top-line growth and significant margin contraction by 289bp yoy, as ad-spend surged 34% yoy. Tax rate remained stable at ~23% and interest costs reduced to almost nil. Abs. (%) 3m 1yr 3yr Outlook and Valuation: At the CMP of Rs252, the stock is trading at 22.5x Sensex 3.3 17.1 17.9 FY2012E earnings. We maintain a Reduce on the stock, with a Target Price of HUL 4.2 (8.9) 28.5 Rs237 (based on 21x FY2012E EPS) owing to weak earnings growth vis-à-vis the FMCG sector, uncertain earnings environment and significantly higher competitive intensity. Key Financials Y/E March (Rs cr) FY2009# FY2010 FY2011E FY2012E Net Sales 20,239 17,524 19,343 21,515 % chg 48.0 (13.4) 10.4 11.2 Net Profit (Adj) 2,501 2,103 2,159 2,449 % chg 47.2 (15.9) 2.7 13.5 EBITDA (%) 13.1 14.5 13.2 13.6 EPS (Rs) 11.5 9.6 9.9 11.2 P/E (x) 22.0 25.0 25.5 22.5 Anand Shah P/BV (x) 26.7 21.3 18.6 16.4 022-4040 3800-334 RoE (%) 121.3 81.4 73.0 72.8 anand.shah@angeltrade.com RoCE (%) 110.4 101.3 86.6 86.5 Chitrangda Kapur EV/Sales (x) 2.6 3.0 2.7 2.4 022-4040 3800-323 EV/EBITDA (x) 20.1 20.3 20.1 17.4 chitrangdar.kapur@angeltrade.com Source: Company, Angel Research; #Note: FY2009 Results are for 15 Months Please refer to important disclosures at the end of this report 1
  • 2. HUL | 1QFY2011 Result Update Exhibit 1: Quarterly performance   Y/E March (Rs cr) 1QFY11 1QFY10 % yoy FY2010 FY2009# % chg Net Sales 4,793.9 4,475.7 7.1 17,523.8 20,239.3 (13.4) Consumption of RM 2,446.6 2,311.7 5.8 8,877.9 10,810.0 (17.9) (% of Sales) 51.0 51.6 50.7 53.4 Staff Costs 250.6 250.4 0.1 936.3 1,152.1 (18.7) (% of Sales) 5.2 5.6 5.3 5.7 Advertising Expense 751.2 561.1 33.9 2,391.4 2,130.9 12.2 (% of Sales) 15.7 12.5 13.6 10.5 Other Expenses 746.9 664.4 12.4 2,769.7 3,490.2 (20.6) (% of Sales) 15.6 14.8 15.8 17.2 Total Expenditure 4,195.3 3,787.6 10.8 14,975.4 17,583.3 (14.8) Operating Profit 598.6 688.1 (13.0) 2,548.4 2,656.0 (4.1) OPM (%) 12.5 15.4 14.5 13.1 Interest 0.1 5.2 (98.5) 7.0 25.3 (72.4) Depreciation 53.5 42.5 25.9 184.0 195.3 (5.8) Other Income 124.5 60.5 105.7 349.6 589.7 (40.7) PBT (excl. Extr. Items) 669.5 700.9 (4.5) 2,707.1 3,025.1 (10.5) Extr. Income/(Expense) 18.5 6.5 111.3 (25.1) PBT (incl. Extr. Items) 688.0 707.4 (2.7) 2,818.4 3,000.0 (6.1) (% of Sales) 14.4 15.8 16.1 14.8 Provision for Taxation 154.8 164.3 (5.8) 616.4 503.6 22.4 (% of PBT) 23.1 23.4 22.8 16.6 Recurring PAT 514.7 536.7 (4.1) 2,090.7 2,521.6 (17.1) PATM (%) 10.7 12.0 11.9 12.5 Reported PAT 533.2 543.2 (1.8) 2,202.0 2,496.5 (11.8) Equity shares (cr) 218.2 218.1 218.2 218.1 Adjusted EPS (Rs) 2.4 2.5 10.1 11.4 Source: Company, Angel Research; Note: #FY2009results are for 15months and not comparable Top-line growth above estimates, volume growth sustained at 11% For 1QFY2011, HUL posted top-line growth of 7.1% yoy to Rs4,794cr (Rs4,476cr) largely driven by volume growth of 11% (low base of 2% growth yoy). However, negative value of growth of ~4% (due to price cuts/promotional offers largely in detergents category) dragged top-line growth. Overall FMCG sales grew 6.7% with a 5.2% growth in HPC and 13.4% growth in foods Business. In HPC, soaps & detergents (S&D) segment posted muted growth of 2.4% yoy due to price cuts and intense competition in detergents category. Management has indicated that detergents (all three brands grew well) registered double-digit volume growth and soaps regained volume momentum post portfolio rejuvenation with premium soaps portfolio growing by strong double digits. Personal products registered 11.4% yoy growth largely driven by double-digit volume growth. In foods business, all segments grew well contributing to growth (beverages grew 8% yoy, processed foods grew 23% yoy and ice creams grew 18% yoy). July 28, 2010 2
  • 3. HUL | 1QFY2011 Result Update Exhibit 2: Sixth qtr of single digit top-line growth Exhibit 3: Price cuts/low base boost volume growth 12 11 11 6,000 25.0 10 8 5,000 8 7 20.0 5 6 4,000 15.0 4 2 2 (%) (%) (Rs cr) 2 1 3,000 10.0 - 2,000 (2) 1,000 5.0 (4) (6) (4) - - 2QFY09 3QFY09 4QFY09 5QFY09 1QFY10 2QFY10 3QFY10 4QFY10 1QFY11 2QFY09 4QFY09 1QFY10 3QFY10 1QFY11 Top-line (LHS) YoY growth (RHS) Source: Company, Angel Research Source: Company, Angel Research Recurring earnings declines 4% yoy despite 106% jump in other income Earnings fell 2% yoy to Rs533cr (Rs543cr) on a reported basis and 4% to Rs515cr (Rs537cr) on a recurring basis, despite the 106% yoy spike in other income to Rs124cr (Rs60cr), owing to weak top-line growth and significant margin contraction. Tax rates remained stable at ~23% and interest costs reduced to almost nil. Significant spike in ad-spend leads to margin contraction by 289bp At the operating level, HUL posted a weak performance, despite the fall in input costs (down 61bp yoy, impressive given the price cuts undertaken this quarter) and savings in staff costs (down 37bp yoy) largely due to higher overheads (up 73bp) and significant jump in advertising spends (up 34% yoy in absolute terms, 313bp yoy) due to intense competitive pressures (detergents, soaps and shampoos witnessing higher competitive intensity). Hence, operating margin for the quarter contracted by 289bp yoy to 12.5% (15.4%) resulting in 13% yoy decline in EBITDA at Rs599cr (Rs688cr). In terms of categories, S&D segment witnessed sharp margin contraction by 626bp yoy impacted by the price cuts and higher ad spends. Personal products registered a margin expansion of 279bp yoy, while processed foods registered positive EBIT margin of 5%.   Exhibit 4: Earnings in red for second quarter Exhibit 5: Spike in ad-spend continues, OPM dips 710 40.0 60.0 50.9 48.6 49.0 610 30.0 46.9 45.8 46.1 47.8 48.4 49.1 50.0 510 20.0 40.0 410 10.0 (Rs cr) 30.0 (yoy %) (%) 310 - 16.1 16.0 20.0 13.3 11.8 13.2 15.4 14.4 12.3 12.5 210 (10.0) 10.0 110 (20.0) 10 (30.0) - 2QFY09 4QFY09 1QFY10 3QFY10 1QFY11 2QFY09 4QFY09 1QFY10 3QFY10 1QFY11 PAT (LHS) YoY growth (RHS) OPM Gross Margin Source: Company, Angel Research Source: Company, Angel Research July 28, 2010 3
  • 4. HUL | 1QFY2011 Result Update Exhibit 6: Segment-wise Performance Y/E March (Rs cr) 1QFY11 1QFY10 % chg FY2010 FY2009# % chg Soaps and Detergents 2,264 2,212 2.4 8,266 9,885 (16.4) Personal Product 1,366 1,226 11.4 5,048 5,385 (6.3) Beverages 538 500 7.7 2,142 2,300 (6.8) Processed Foods 211 172 22.7 731 808 (9.6) Ice Creams 105 89 18.1 231 235 (1.8) Exports 265 257 2.8 1,005 1,576 (36.2) Others 113 79 41.8 347 359 (3.3) Less:Inter Segment Revenue - (4) (4) (8) Total Gross Income 4,861 4,530 7.3 17,766 20,539 (51.4) Soaps and Detergents 249 381 (34.8) 1,185 1,482 (20.0) Personal Products 339 270 25.5 1,297 1,429 (9.3) Beverages 70 70 (1.1) 320 308 3.8 Processed Foods 10.6 (1.3) 4 1 206.2 Ice Creams 15 15 (1.0) 13 9 47.2 Exports 23 21 10.5 59 108 (45.9) Others (27) (28) (72) (134) Total PBIT 679 728 (6.8) 2,805 3,203 (12.4) Less: Interest Exp. (0) (5) (7) (25) Less: Other Unallocable Exp 9 (20) (36) (169) PBT 688 704 (2.2) 2,763 3,009 (8.2) PBIT Margin (%) Soap and Detergent 11.0 17.2 14.3 15.0 Personal Product 24.8 22.0 25.7 26.5 Beverages 12.9 14.1 14.9 13.4 Processed Foods 5.0 (0.7) 0.6 0.2 Ice Creams 14.6 17.5 5.5 3.7 Exports 8.6 8.0 5.8 6.9 Others (23.6) (35.2) (20.8) (37.5) Source: Company, Angel Research; Note: #FY2009results are for 15months and not comparable S&D sales beat estimates aided by strong volume growth HUL’s S&D segment witnessed 2% yoy growth, above our estimates of 3% decline, led by double-digit volume growth. However, overall growth was curtailed to single digits owing to the steep price cuts in the detergents segment due to price war with P&G. In detergents, Wheel delivered double-digit volume growth, while Rin sustained strong volume growth post its re-launch. Soaps recorded steady performance led by premium portfolio (grew ahead of market, Dove is now accessible to more customers at Rs20 price point). However, PBIT margins in the segment collapsed by 626bp yoy impacted by the steep price cuts and higher ad-spend. We believe HUL’s core category of S&D will continue to remain under pressure in the near-to-medium term until competitive pressures reduce. We expect the S&D segment to post 4% growth in top-line in FY2011E, as growth in soaps and spike in detergent volume due to the price cuts gets offset by negative value growth in detergents. Moreover, we have modeled in around 200bp erosion in S&D segment margins for FY2011E to factor in the impact of price cuts. July 28, 2010 4
  • 5. HUL | 1QFY2011 Result Update Exhibit 7: S&D continues to post low growth Exhibit 8: EBIT margins dip to new lows of 11% 2,300 30.0 500 20.0 25.0 2,200 400 20.0 15.0 2,100 300 (%) (%) 15.0 (Rs cr) (Rs cr) 10.0 2,000 10.0 200 5.0 5.0 1,900 100 - 1,800 (5.0) - - 2QFY09 4QFY09 1QFY10 3QFY10 1QFY11 2QFY09 4QFY09 1QFY10 3QFY10 1QFY11 Top-line (LHS) YoY growth (RHS) EBIT (LHS) EBIT % (RHS) Source: Company, Angel Research Source: Company, Angel Research PP sales below estimates, double-digit volume growth continues The personal products (PP) segment registered 11.4% yoy growth, ~3% below our estimates on account of lower sales in shampoos (higher competitive pressures). However, in terms of profitability, the segment registered margin expansion of 280bp yoy, despite higher ad-spend on account of product mix gains and favourable base. Exhibit 9: PP growth slows down to 11% Exhibit 10: EBIT margins improve yoy and qoq 1,600 20.0 500 35.0 1,400 30.0 400 1,200 15.0 25.0 1,000 300 (%) (%) 20.0 (Rs cr) (Rs cr) 800 10.0 200 15.0 600 400 5.0 10.0 100 200 5.0 - - - - 2QFY09 4QFY09 1QFY10 3QFY10 1QFY11 2QFY09 4QFY09 1QFY10 3QFY10 1QFY11 Top-line (LHS) YoY growth (RHS) EBIT (LHS) EBIT % (RHS) Source: Company, Angel Research Source: Company, Angel Research Processed foods, ice creams do well, beverages disappoints The foods segment recorded a growth of 13.4% yoy driven largely by strong growth in processed foods (up 23% yoy) and ice creams (up 18% yoy). However, beverages disappointed registering muted growth of 8% yoy as the tea market witnessed slowdown. Processed foods grew in strong double digits with improved profitability (EBIT margins expand 574bp yoy). All three core brands, Knorr (Knorr soupy noodles accepted well), Kissan and Annapurna did well. The ice cream segment was led by Impulse and Take Home categories. July 28, 2010 5
  • 6. HUL | 1QFY2011 Result Update Investment Concerns High competitive intensity across categories, ITC a major threat: During the last several quarters, management has constantly admitted that competitive intensity across key categories of soaps, detergents, shampoos and skin care has increased and is likely to further intensify. While corrective steps taken by HUL over the last several quarters in terms of correcting pricing, promotional activity and strengthening distribution have helped stabilise market share losses, we believe ITC’s commitment to categories like soaps, shampoos and skin care is a major threat for HUL in the long run. OPM to decline as re-investment in ad-spend to sustain: Over FY2010-12E, we have modeled in 100bp reduction in OPM (130bp in FY2011E) despite incremental gains from cost rationalisation measures and moderate decline in gross margins, as we expect ad spend to rise to ~14.5-15% levels from current 13.6% (reflected in 1QFY2011 results) due to high competitive intensity. Hence, we expect EBITDA to log a muted 7% CAGR over FY2010-12E Rich valuations for subdued 8% CAGR unjustified: At the CMP of Rs253, HUL is trading at rich valuations of 22.5x FY2012E earnings, which is unjustified given the subdued 8% CAGR expected over FY2010-12E (~3x PEG) vis-à-vis sector growth (ex-HUL) of ~15-18%. In terms of historical valuations, HUL is trading at 50% premium to the Sensex (in line with the 5-yr average) and ~5% discount of 5-yr average P/E leaving little room for upside. Outlook and Valuation Post another quarter of weak results on the operational front, we have revised our earnings estimates downwards by ~1-2% modeling in lower OPMs on account of the significant increase in ad spends. Exhibit 11: Change in Estimates Old Estimate New Estimate % chg (Rs cr) FY11E FY12E FY11E FY12E FY11E FY12E Revenue 19,305 21,530 19,343 21,515 0.2 (0.1) OPM (%) 13.5 13.7 13.2 13.6 (30bp) (15bp) EPS (Rs) 10.1 11.4 9.9 11.2 (2.1) (1.2) Source: Company, Angel Research We expect HUL to post 10.8% CAGR in top-line over FY2010-12E, despite the steep price cuts largely aided by steady performance of its personal care and foods divisions (aided by innovations and higher ad spends), spike in detergents volume (due to price cuts) and modest performance of its soaps business (aided by brand re-launches and select price cuts). In terms of earnings, we expect HUL to post weak 8% CAGR during the period impacted by the dip in margins (due to the price cuts) and higher tax rate (on account of increase in MAT). However, further price cuts, spillover of price war to other categories and poor response to brand re-launches, promotions and price cuts carry downside risks to our estimates. At the CMP of Rs252, the stock is trading at 22.5x FY2012E earnings. We maintain Reduce on the stock with a Target Price of Rs237 (based on 21x FY2012E EPS) owing to weak earnings growth vis-à-vis the FMCG sector, uncertain earnings environment and significantly higher competitive intensity. July 28, 2010 6
  • 7. HUL | 1QFY2011 Result Update Exhibit 12: Key Assumptions FY2009# FY2010 FY2011E FY2012E Gross top-line (Rs cr) Soaps & Detergents 8,146 8,266 8,596 9,370 Personal Products 4,366 5,048 5,780 6,531 Beverages 1,869 2,142 2,432 2,736 Processed Foods 656 731 848 966 Ice Creams 198 231 268 303 Exports 1,177 1,005 1,126 1,250 Others 314 347 409 475 Top-line growth (%) Soaps & Detergents - 1.5 4.0 9.0 Personal Products - 15.6 14.5 13.0 Beverages - 14.7 13.5 12.5 Processed Foods - 11.3 16.0 14.0 Ice Creams - 16.5 16.0 13.0 Exports - (14.6) 12.0 11.0 Others - 10.3 18.0 16.0 PBIT (Rs cr) Soaps & Detergents 1,249 1,185 1,053 1,218 Personal Products 1,183 1,297 1,517 1,731 Beverages 255 320 347 397 Processed Foods (2) 4 13 17 Ice Creams 11 13 15 18 Exports 90 59 70 81 Others (104) (72) (74) (66) PBIT Margin (%) Soaps & Detergents 15.3 14.3 12.3 13.0 Personal Products 27.1 25.7 26.3 26.5 Beverages 13.6 14.9 14.3 14.5 Processed Foods (0.3) 0.6 1.5 1.8 Ice Creams 5.6 5.5 5.5 5.8 Exports 7.7 5.8 6.3 6.5 Others (33.1) (20.8) (18.0) (14.0) Source: Company, Angel Research; # Note: FY2009 numbers are comparable 12 months numbers given for comparative purpose July 28, 2010 7
  • 8. HUL | 1QFY2011 Result Update Exhibit 13: Peer Valuation Company Reco Mcap CMP TP* Upside P/E (x) EV/Sales (x) RoE (%) CAGR # (Rs cr) (Rs) (Rs) (%) FY11E FY12E FY11E FY12E FY11E FY12E Sales PAT Asian Paints Accumulate 24,939 2,600 2,773 6.6 27.4 23.4 3.2 2.6 40.8 37.8 17.5 17.4 Colgate Reduce 11,542 849 798 (6.0) 26.9 23.5 4.9 4.3 117.3 108.8 14.3 7.8 Dabur Neutral 17,254 200 195 (2.7) 30.7 25.7 4.3 3.6 39.9 39.1 17.4 16.0 GSKCHL Reduce 7,612 1,810 1,622 (10.4) 27.8 23.4 3.0 2.5 27.7 27.8 17.8 18.8 GCPL Accumulate 11,318 350 397 13.4 24.4 19.4 3.6 2.9 34.2 30.1 44.5 27.9 HUL Reduce 54,970 252 237 (6.1) 25.5 22.5 2.7 2.4 73.0 72.8 10.8 7.9 ITC Neutral 115,575 307 310 1.0 24.4 21.8 5.2 4.5 31.4 30.1 14.4 15.2 Marico Neutral 7,676 126 124 (1.6) 26.6 22.4 2.5 2.2 37.3 33.0 16.1 19.3 Nestle Neutral 28,493 2,955 2,955 0.0 36.2 30.0 4.7 4.1 118.2 118.6 16.5 20.4 # Source: Company, Angel Research, Note: denotes CAGR for FY2010-12E, * In case of Neutral recommendation, TP = Fair value Exhibit 14: Angel v/s Consensus estimates Top-line (Rs cr) FY2011E FY2012E EPS (Rs) FY2011E FY2012E Angel estimates 19,343 21,515 Angel estimates 9.9 11.2 Consensus 19,288 21,478 Consensus 10.4 11.7 Diff (%) 0.3 0.2 Diff (%) (4.9) (4.0) Source: Company, Angel Research Exhibit 15: Returns - HUL v/s Sensex (Indexed to 100) Exhibit 16: One-yr forward P/E band 200% 350 18x 21x 24x 27x Sensex HUL 300 150% 250 Share Price (Rs) 200 100% 150 100 50% 50 - 0% Jan-06 Jan-07 Jan-08 Jan-09 Jan-10 Jul-05 Oct-05 Jul-06 Oct-06 Jul-07 Oct-07 Jul-08 Oct-08 Jul-09 Oct-09 Jul-10 Apr-05 Apr-06 Apr-07 Apr-08 Apr-09 Apr-10 Jul-07 Oct-07 Jan-08 Jul-08 Oct-08 Jan-09 Jul-09 Oct-09 Jan-10 Jul-10 Apr-07 Apr-08 Apr-09 Apr-10 Source: Company, Angel Research Source: Company, Angel Research Exhibit 17: One-yr forward P/E chart Exhibit 18: One-yr forward Premium v/s Sensex chart 40.0 200% 35.0 150% 30.0 25.0 100% 20.0 15.0 50% 10.0 5.0 0% - -50% Jan-03 Jun-03 Feb-05 Jul-05 May-06 Oct-06 Mar-07 May-08 Oct-08 Mar-09 Jan-10 Jun-10 Apr-02 Aug-02 Nov-03 Apr-04 Aug-07 Aug-09 Sep-04 Dec-05 Dec-07 Jan-03 Feb-05 May-06 Oct-06 Mar-07 May-08 Oct-08 Mar-09 Jan-10 Apr-02 Aug-02 Nov-03 Apr-04 Aug-07 Aug-09 Jun-03 Sep-04 Jul-05 Dec-05 Dec-07 Jun-10 Source: Company, Angel Research, Note: Red line indicates 5-year average Source: Company, Angel Research, Note: Red line indicates 5-year average July 28, 2010 8
  • 9. HUL | 1QFY2011 Result Update Profit & Loss Statement Rs crore Y/E March CY06 CY07 FY09# FY10 FY11E FY12E Gross sales 13,035 14,715 21,650 18,220 20,202 22,529 Less: Excise duty 932 1,040 1,410 696 859 1,014 Net Sales 12,103 13,675 20,239 17,524 19,343 21,515 Total operating income 12,103 13,675 20,239 17,524 19,343 21,515 % chg 9.4 13.0 48.0 (13.4) 10.4 11.2 Total Expenditure 10,455 11,797 17,583 14,975 16,790 18,595 Cost of Materials 6,503 7,269 10,810 8,878 9,884 11,059 Advertising Exp 1,273 1,440 2,131 2,391 2,863 3,098 Personnel 643 768 1,152 936 1,025 1,140 Others 2,037 2,320 3,490 2,770 3,018 3,297 EBITDA 1,648 1,879 2,656 2,548 2,553 2,921 % chg 14.2 14.0 41.4 (4.1) 0.2 14.4 (% of Net Sales) 13.6 13.7 13.1 14.5 13.2 13.6 Depreciation& Amortisation 130 138 195 184 209 228 EBIT 1,518 1,740 2,461 2,364 2,344 2,693 % chg 15.1 14.7 41.4 (3.9) (0.8) 14.9 (% of Net Sales) 12.5 12.7 12.2 13.5 12.1 12.5 Interest & other Charges 11 25 25 7 1 1 Other Income 355 432 590 350 460 510 (% of PBT) 19.0 20.1 19.5 12.9 16.4 15.9 Share in profit of Associates - - - - - - Recurring PBT 1,862 2,146 3,025 2,707 2,803 3,202 % chg 16.0 15.3 40.9 (10.5) 3.6 14.2 Extraordinary Expense/(Inc.) (316) (182) 4 (99) 0 0 PBT (reported) 2,177 2,329 3,021 2,806 2,803 3,202 Tax 322 403 524 604 645 752 (% of PBT) 17.3 18.8 17.3 22.3 23.0 23.5 PAT (reported) 1,540 1,743 2,501 2,103 2,159 2,449 Add: Share of associates - - - - - - Less: Minority interest (MI) - - - - - - PAT after MI (reported) 1,540 1,743 2,501 2,103 2,159 2,449 ADJ. PAT 1,855 1,925 2,496 2,202 2,159 2,449 % chg 3.8 29.7 (11.8) (2.0) 13.5 (% of Net Sales) 15.3 14.1 12.3 12.6 11.2 11.4 Basic EPS (Rs) 7.0 8.0 11.5 9.6 9.9 11.2 Fully Diluted EPS (Rs) 7.0 8.0 11.5 9.6 9.9 11.2 % chg 12.4 14.7 43.3 (16.0) 2.7 13.5 # Note: FY2009 Results are for 15 Months July 28, 2010 9
  • 10. HUL | 1QFY2011 Result Update Balance Sheet Rs crore Y/E March CY06 CY07 FY09# FY10 FY11E FY12E SOURCES OF FUNDS Equity Share Capital 221 218 218 218 218 218 Preference Capital - - - - - - Reserves& Surplus 2,503 1,221 1,844 2,365 2,737 3,145 Shareholders Funds 2,723 1,439 2,062 2,584 2,955 3,363 Minority Interest - - - - - - Total Loans 73 89 422 0 0 0 Deferred Tax Liability (225) (212) (255) (249) (249) (249) Total Liabilities 2,572 1,315 2,229 2,335 2,707 3,114 APPLICATION OF FUNDS Gross Block 2,463 2,669 2,882 3,582 3,869 4,219 Less: Acc. Depreciation 1,062 1,147 1,275 1,420 1,629 1,857 Net Block 1,401 1,523 1,607 2,162 2,240 2,362 Capital Work-in-Progress 110 186 472 274 387 422 Goodwill - - - - - - Investments 2,414 1,441 333 1,264 1,764 2,264 Current Assets 3,170 3,277 5,601 5,368 5,697 6,247 Cash 417 201 1,777 1,892 1,839 1,965 Loans & Advances 765 680 758 617 696 796 Other 1,988 2,397 3,066 2,858 3,162 3,486 Current liabilities 4,523 5,111 5,784 6,733 7,382 8,181 Net Current Assets (1,353) (1,834) (183) (1,365) (1,684) (1,934) Total Assets 2,572 1,315 2,229 2,335 2,707 3,114 # Note: FY2009 Results are for 15 Months Cash Flow Statement Rs crore Y/E March CY06 CY07 FY09# FY10 FY11E FY12E Profit before tax 1,862 2,146 3,025 2,707 2,803 3,202 Depreciation 130 138 195 184 209 228 Change in Working Capital (13) 122 (330) 1,391 258 371 Interest / Dividend (Net) (136) (142) (126) (122) (134) (144) Direct taxes paid 322 403 524 604 645 752 Others 567 (26) (19) (84) 8 4 Cash Flow from Operations 2,087 1,836 2,220 3,473 2,499 2,909 (Inc.)/ Dec. in Fixed Assets (107) (289) (629) (502) (400) (385) (Inc.)/ Dec. in Investments (594) 998 1,167 (931) (500) (500) Cash Flow from Investing (701) 709 538 (1,434) (900) (885) Issue of Equity 36 (633) 39 32 0 0 Inc./(Dec.) in loans 16 16 333 (422) 0 0 Dividend Paid (Incl. Tax) 1,511 2,292 1,677 1,656 1,787 2,042 Interest / Dividend (Net) (136) (148) (122) (122) (134) (144) Cash Flow from Financing (1,324) (2,762) (1,181) (1,924) (1,653) (1,898) Inc./(Dec.) in Cash 62 (216) 1,576 115 (53) 126 Opening Cash balances 355 417 201 1,777 1,892 1,839 Closing Cash balances 417 201 1,777 1,892 1,839 1,965 # Note: FY2009 Results are for 15 Months July 28, 2010 10
  • 11. HUL | 1QFY2011 Result Update Key Ratios Y/E March CY06 CY07 FY09# FY10 FY11E FY12E Valuation Ratio (x) P/E (on FDEPS) 30.0 28.5 22.0 25.0 25.5 22.5 P/CEPS 33.0 29.3 20.4 24.1 23.3 20.6 P/BV 20.2 38.3 26.7 21.3 18.6 16.4 Dividend yield (%) 2.4 3.6 3.0 2.6 2.8 3.2 EV/Sales 4.3 3.9 2.6 3.0 2.7 2.4 EV/EBITDA 31.7 28.4 20.1 20.3 20.1 17.4 EV / Total Assets 20.3 40.6 23.9 22.2 19.0 16.3 Per Share Data (Rs) EPS (Basic) 7.0 8.0 11.5 9.6 9.9 11.2 EPS (fully diluted) 7.1 8.0 11.5 9.6 9.9 11.2 Cash EPS 7.7 8.6 12.4 10.5 10.9 12.3 DPS 6.0 9.1 7.5 6.5 7.0 8.0 Book Value 12.5 6.6 9.4 11.8 13.5 15.4 Returns (%) RoCE 64.4 89.5 138.9 103.6 93.0 92.5 Angel RoIC (Pre-tax) - - - - - - RoE 61.2 83.7 142.9 90.5 77.9 77.5 Turnover ratios (x) Asset Turnover 4.9 5.1 7.0 4.9 5.0 5.1 Inventory / Sales (days) 47 52 46 45 46 46 Receivables (days) 13 12 10 14 14 14 Payables (days) 97 102 77 110 110 109 Net Working capital (days) (53) (54) (35) (68) (66) (66) # Note: FY2009 Results are for 15 Months July 28, 2010 11
  • 12. HUL | 1QFY2011 Result Update Research Team Tel: 022 - 4040 3800 E-mail: research@angeltrade.com Website: www.angeltrade.com Disclaimer This document is solely for the personal information of the recipient, and must not be singularly used as the basis of any investment decision. Nothing in this document should be construed as investment or financial advice. Each recipient of this document should make such investigations as they deem necessary to arrive at an independent evaluation of an investment in the securities of the companies referred to in this document (including the merits and risks involved), and should consult their own advisors to determine the merits and risks of such an investment. Angel Broking Limited, its affiliates, directors, its proprietary trading and investment businesses may, from time to time, make investment decisions that are inconsistent with or contradictory to the recommendations expressed herein. The views contained in this document are those of the analyst, and the company may or may not subscribe to all the views expressed within. Reports based on technical and derivative analysis center on studying charts of a stock's price movement, outstanding positions and trading volume, as opposed to focusing on a company's fundamentals and, as such, may not match with a report on a company's fundamentals. The information in this document has been printed on the basis of publicly available information, internal data and other reliable sources believed to be true, but we do not represent that it is accurate or complete and it should not be relied on as such, as this document is for general guidance only. Angel Broking Limited or any of its affiliates/ group companies shall not be in any way responsible for any loss or damage that may arise to any person from any inadvertent error in the information contained in this report. Angel Broking Limited has not independently verified all the information contained within this document. Accordingly, we cannot testify, nor make any representation or warranty, express or implied, to the accuracy, contents or data contained within this document. While Angel Broking Limited endeavours to update on a reasonable basis the information discussed in this material, there may be regulatory, compliance, or other reasons that prevent us from doing so. This document is being supplied to you solely for your information, and its contents, information or data may not be reproduced, redistributed or passed on, directly or indirectly. Angel Broking Limited and its affiliates may seek to provide or have engaged in providing corporate finance, investment banking or other advisory services in a merger or specific transaction to the companies referred to in this report, as on the date of this report or in the past. Neither Angel Broking Limited, nor its directors, employees or affiliates shall be liable for any loss or damage that may arise from or in connection with the use of this information. Note: Please refer to the important `Stock Holding Disclosure' report on the Angel website (Research Section). Also, please refer to the latest update on respective stocks for the disclosure status in respect of those stocks. Angel Broking Limited and its affiliates may have investment positions in the stocks recommended in this report. Disclosure of Interest Statement HUL 1. Analyst ownership of the stock No 2. Angel and its Group companies ownership of the stock No 3. Angel and its Group companies' Directors ownership of the stock No 4. Broking relationship with company covered No Note: We have not considered any Exposure below Rs 1 lakh for Angel, its Group companies and Directors. Ratings (Returns) : Buy (> 15%) Accumulate (5% to 15%) Neutral (-5 to 5%) Reduce (-5% to 15%) Sell (< -15%) July 28, 2010 12