1. 1QFY2011 Result Update | Media
August 2, 2010
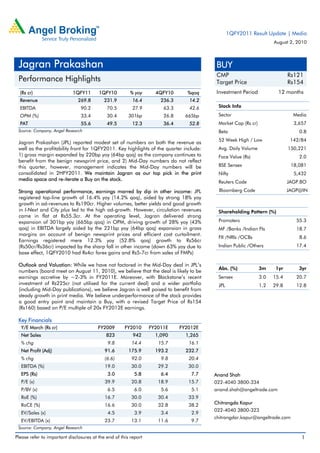
Jagran Prakashan BUY
CMP Rs121
Performance Highlights Target Price Rs154
(Rs cr) 1QFY11 1QFY10 % yoy 4QFY10 %qoq Investment Period 12 months
Revenue 269.8 231.9 16.4 236.3 14.2
EBITDA 90.2 70.5 27.9 63.3 42.6 Stock Info
OPM (%) 33.4 30.4 301bp 26.8 665bp Sector Media
PAT 55.6 49.5 12.3 36.4 52.8 Market Cap (Rs cr) 3,657
Source: Company, Angel Research Beta 0.8
52 Week High / Low 142/84
Jagran Prakashan (JPL) reported modest set of numbers on both the revenue as
well as the profitability front for 1QFY2011. Key highlights of the quarter include: Avg. Daily Volume 150,221
1) gross margin expanded by 220bp yoy (64bp qoq) as the company continues to Face Value (Rs) 2.0
benefit from the benign newsprint price, and 2) Mid-Day numbers do not reflect
this quarter, however, management indicates the Mid-Day numbers will be BSE Sensex 18,081
consolidated in 2HFY2011. We maintain Jagran as our top pick in the print Nifty 5,432
media space and re-iterate a Buy on the stock.
Reuters Code JAGP.BO
Strong operational performance, earnings marred by dip in other income: JPL Bloomberg Code JAGP@IN
registered top-line growth of 16.4% yoy (14.2% qoq), aided by strong 18% yoy
growth in ad-revenues to Rs190cr. Higher volumes, better yields and good growth
in I-Next and City plus led to the high ad-growth. However, circulation revenues Shareholding Pattern (%)
came in flat at Rs55.3cr. At the operating level, Jagran delivered strong
expansion of 301bp yoy (665bp qoq) in OPM, driving growth of 28% yoy (43% Promoters 55.3
qoq) in EBITDA largely aided by the 221bp yoy (64bp qoq) expansion in gross MF /Banks /Indian FIs 18.7
margins on account of benign newsprint prices and efficient cost curtailment.
FII /NRIs /OCBs 8.6
Earnings registered mere 12.3% yoy (52.8% qoq) growth to Rs56cr
(Rs50cr/Rs36cr) impacted by the sharp fall in other income (down 63% yoy due to Indian Public /Others 17.4
base effect, 1QFY2010 had Rs4cr forex gains and Rs5-7cr from sales of FMPs)
Outlook and Valuation: While we have not factored in the Mid-Day deal in JPL’s
Abs. (%) 3m 1yr 3yr
numbers (board meet on August 11, 2010), we believe that the deal is likely to be
earnings accretive by ~2-3% in FY2011E. Moreover, with Blackstone’s recent Sensex 3.0 15.4 20.7
investment of Rs225cr (not utilised for the current deal) and a wider portfolio JPL 1.2 29.8 12.8
(including Mid-Day publications), we believe Jagran is well poised to benefit from
steady growth in print media. We believe underperformance of the stock provides
a good entry point and maintain a Buy, with a revised Target Price of Rs154
(Rs160) based on P/E multiple of 20x FY2012E earnings.
Key Financials
Y/E March (Rs cr) FY2009 FY2010 FY2011E FY2012E
Net Sales 823 942 1,090 1,265
% chg 9.8 14.4 15.7 16.1
Net Profit (Adj) 91.6 175.9 193.2 232.7
% chg (6.6) 92.0 9.8 20.4
EBITDA (%) 19.0 30.0 29.2 30.0
EPS (Rs) 3.0 5.8 6.4 7.7 Anand Shah
P/E (x) 39.9 20.8 18.9 15.7 022-4040 3800-334
P/BV (x) 6.5 6.0 5.6 5.1 anand.shah@angeltrade.com
RoE (%) 16.7 30.0 30.4 33.9
RoCE (%) 16.6 30.0 32.8 38.2 Chitrangda Kapur
022-4040 3800-323
EV/Sales (x) 4.5 3.9 3.4 2.9
chitrangdar.kapur@angeltrade.com
EV/EBITDA (x) 23.7 13.1 11.6 9.7
Source: Company, Angel Research
Please refer to important disclosures at the end of this report 1
2. Jagran Prakashan|1QFY2011 Result Update
Exhibit 1: Quarterly Performance (Consolidated)
Y/E March (Rs cr) 1QFY11 1QFY10 % yoy 4QFY10 % qoq FY2010 FY2009 % chg
Net Sales 269.8 231.9 16.4 236.3 14.2 941.9 823.4 14.4
Consumption of RM 75.6 70.1 7.9 67.8 11.6 273.6 317.9 (13.9)
(% of Sales) 28.0 30.2 28.7 29.0 38.6
Staff Costs 34.7 28.9 20.1 31.9 8.7 121.2 106.5 13.8
(% of Sales) 12.9 12.5 13.5 12.9 12.9
Other Expenses 69.3 62.3 11.1 73.3 (5.5) 264.8 242.3 9.3
(% of Sales) 25.7 26.9 31.0 28.1 29.4
Total Expenditure 179.6 161.4 11.3 173.0 3.8 659.6 666.7 (1.1)
Operating Profit 90.2 70.5 27.9 63.3 42.6 282.3 156.7 80.1
OPM (%) 33.4 30.4 26.8 30.0 19.0
Interest 1.2 1.4 (10.3) 2.4 (48.6) 6.6 5.9 11.3
Depreciation 12.5 12.4 1.0 13.5 (7.4) 50.8 38.3 32.4
Other Income 5.7 15.7 (63.3) 6.6 (12.9) 34.3 22.7 50.8
PBT (excl. Ext Items) 82.2 72.4 13.5 54.0 52.3 259.2 135.2 91.7
Ext Income/(Expense) - - - - -
PBT (incl. Ext Items) 82.2 72.4 13.5 54.0 52.3 259.2 135.2 91.7
(% of Sales) 30.5 31.2 22.8 27.5 16.4
Provision for Taxation 26.6 22.9 16.0 17.6 51.2 83.3 43.6 91.2
(% of PBT) 32.4 31.7 32.6 32.1 32.2
Recurring PAT 55.6 49.5 12.3 36.4 52.8 175.9 91.6 92.0
PATM (%) 20.6 21.4 15.4 18.7 11.1
Reported PAT 55.6 49.5 12.3 36.4 52.8 175.9 91.6 92.0
Equity shares (cr) 30.1 30.1 30.1 30.1 30.1
EPS (Rs) 1.8 1.6 1.2 5.8 3.0
Source: Company, Angel Research
Advertisement aids top-line, grows 18% yoy, while circulation remains flat
JPL reported robust top-line growth of 16.4% yoy (14.2% qoq) to Rs270cr
(Rs232cr/Rs236cr), aided by the strong 18% yoy (21%qoq) growth in advertising
revenue to Rs190cr (Rs161cr/Rs158cr). Higher volumes, better yields and good
growth in I-Next and City plus led to high ad-growth. The strong advertisement
revenues is notable considering that it comes on a high base (1QFY2010 had the
national elections). However, circulation revenues came in flat at Rs55.3cr (Rs54.5cr),
as JPL reacted to the entry of DB Corp in Jharkhand and slashed its cover price. The
company’s other businesses (event, outdoor and digital businesses) continue to show
strong traction with revenues growing 50% yoy to Rs20cr.
Management expects ad revenue growth of 17-18% in FY2011E and expects growth
to be back-ended in 2HFY2011E. Hence, it has guided for a weaker 2QFY2011E (in
comparison to 1QFY2011), as the festive season this time is slated for 3QFY2011E.
August 2, 2010 2
3. Jagran Prakashan|1QFY2011 Result Update
Exhibit 2: Top-line growth gaining momentum Exhibit 3: Traction in ad-revenues to drive top-line
300 20.0 200 190
250 140
15.0 150
200
(Rs cr)
(Rs cr)
150 10.0 100
(%)
48 55
100 50 15 20
5.0
50
-
- -
Ad-revenue Circulation Non-publishing
1QFY09
2QFY09
3QFY09
4QFY09
1QFY10
2QFY10
3QFY10
4QFY10
1QFY11
Revenue business
1QFY09 2QFY09 3QFY09 4QFY09 1QFY10
Top-line (LHS) YoY (RHS) 2QFY10 3QFY10 4QFY10 1QFY11
Source: Company, Angel Research Source: Company, Angel Research
Strong operational performance, earnings marred by dip in other income
At the operating level, Jagran delivered a strong expansion of 301bp yoy (665bp
qoq) in OPM, driving 28% yoy (43% qoq) growth in EBITDA to Rs90cr
(Rs71cr/Rs63cr) largely aided by the 221bp yoy (64bp qoq) expansion in gross
margins on account of benign newsprint prices and efficient cost curtailment, as
other expenses registered a decline of 121bp yoy/536bp qoq to Rs69cr
(Rs62cr/Rs73cr). Management has indicated that if its nascent businesses were to be
excluded, margins would be higher at 40% on standalone print business. However,
JPL’s earnings for the quarter registered 12.3% yoy (52.8% qoq) growth to Rs56cr
(Rs50cr/Rs36cr) impacted by the sharp fall in other income (down 63% yoy due to
base effect, 1QFY2010 had Rs4cr forex gains and Rs5-7cr from sales of FMPs not
recurring this quarter).
Going ahead, we expect gross margins to fall by ~30-50bp from current levels as
we model in: 1) cover price cuts in Jharkhand from Rs4 to Rs2 due to entry of DB
Corp leading to higher circulation, and 2) ~10% rise in newsprint costs for JPL in
FY2011E (newsprint prices are currently trading at ~US $700/tonne) as JPL has
already booked substantial inventory for imported newsprint.
Exhibit 4: Bottom-line growth to pick up Exhibit 5: Higher gross margins drive OPM
60 200.0 80 65 65 70 72 70 71 72
50 150.0 59 57
60
40 100.0
(Rs cr)
30 50.0 30 34 33
(%)
40 28
(%)
24 27
20 - 18 19
13
10 (50.0) 20
- (100.0)
-
1QFY09
2QFY09
3QFY09
4QFY09
1QFY10
2QFY10
3QFY10
4QFY10
1QFY11
1QFY09
2QFY09
3QFY09
4QFY09
1QFY10
2QFY10
3QFY10
4QFY10
1QFY11
PAT (LHS) YoY growth (RHS) OPM Gross Margins
Source: Company, Angel Research Source: Company, Angel Research
August 2, 2010 3
4. Jagran Prakashan|1QFY2011 Result Update
Investment Rationale
Strong ad-revenue growth despite high base, aiding top-line CAGR of 16%: JPL
recorded strong ad-revenue growth on a high base (as in 1QFY2010 national
elections were held and higher advertisement spend) primarily aided by higher
volumes and colour ad-inventory (management has indicated colour ad
inventory of 55% and pagination increase of 3–4% yoy). For FY2010-12E, we
expect JPL’s ad-revenue to post a CAGR of 19% (on higher proportion of colour
ads, rate hikes and pickup in ad spend), aiding top-line CAGR of ~16% over the
period.
Margins to remain stable on significant cost efficiencies: For FY2011E, we
expect operating margins to marginally dip on the back of ~8-10% rise in
newsprint costs (JPL already has substantial inventory booked for imported
newsprint) and increasing competitive intensity with the entry of DB Corp in
Jharkhand (cover prices cut in Jharkhand from Rs4 to Rs2). However, strong ad
revenue growth, cost curtailment measures and improving profitability in the
nascent businesses of I-Next/City plus and OOH/event management are likely to
protect any sharp margin decline. Hence, we estimate the company’s operating
margins to remain stable at 30% levels in FY2012E.
Underperformance a good entry point, JPL attractive at 15.7x FY2012E EPS: JPL
acquired the print business from Mid-Day Multimedia whose presence in
markets like Mumbai, Delhi, Bangalore and Pune (recently launched) is likely to
fill the gap in JPL’s portfolio v/s its peers HT Media (HT and Hindustan) and DB
Corp (Dainik Bhaskar and DNA) which offer both English and Hindi publications
to its advertisers. Hence, we believe that JPL’s combined offerings are likely to
boost its advertising revenues due to the bundling effect. While we have not
factored the deal in JPL’s numbers, we believe the deal is likely to be earnings
accretive by ~2–3% in FY2011E. Moreover, with Blackstone’s recent investment
of Rs225cr and a wider portfolio (including Mid-Day publications), we believe
that JPL is well poised to benefit from steady growth in print media. The
underperformance of the stock and attractive valuations (at the CMP, the stock
trades at 15.7x FY2012E EPS) provides a good entry point for investors.
Outlook and Valuation
Post the 1QFY2011 results, we have marginally revised our estimates factoring in flat
circulation revenues posted during the quarter. We expect JPL to post a modest
15.9% CAGR in top-line over FY2010-12E driven by the 19.1% CAGR in advertising
revenues and 3.9% CAGR in circulation revenues. The other businesses (OOH, event
management and SMS services) are estimated to record CAGR of 22% during the
mentioned period on better traction. In terms of earnings, we expect JPL to report
modest CAGR of 15% over FY2010-12E driven largely by top-line growth and
sustained margins.
Exhibit 6: Change in Estimates
Old Estimate New Estimate % chg
(Rs cr) FY2011E FY2012E FY2011E FY2012E FY2011E FY2012E
Revenue 1,088 1,260 1,090 1,265 0.1 0.4
OPM (%) 29.8 30.6 29.2 30.0 (60bp) (65bp)
EPS 6.6 7.9 6.4 7.7 (2.1) (2.0)
Source: Company, Angel Research
We believe underperformance of the stock provides a good entry point and maintain
a Buy, with a Target Price of Rs154, based on a P/E multiple of 20x FY2012E (in line
with historical valuations).
August 2, 2010 4
10. Jagran Prakashan|1QFY2011 Result Update
Research Team Tel: 022 - 4040 3800 E-mail: research@angeltrade.com Website: www.angeltrade.com
Disclaimer
This document is solely for the personal information of the recipient, and must not be singularly used as the basis of any investment
decision. Nothing in this document should be construed as investment or financial advice. Each recipient of this document should make
such investigations as they deem necessary to arrive at an independent evaluation of an investment in the securities of the companies
referred to in this document (including the merits and risks involved), and should consult their own advisors to determine the merits and
risks of such an investment.
Angel Broking Limited, its affiliates, directors, its proprietary trading and investment businesses may, from time to time, make
investment decisions that are inconsistent with or contradictory to the recommendations expressed herein. The views contained in this
document are those of the analyst, and the company may or may not subscribe to all the views expressed within.
Reports based on technical and derivative analysis center on studying charts of a stock's price movement, outstanding positions and
trading volume, as opposed to focusing on a company's fundamentals and, as such, may not match with a report on a company's
fundamentals.
The information in this document has been printed on the basis of publicly available information, internal data and other reliable
sources believed to be true, but we do not represent that it is accurate or complete and it should not be relied on as such, as this
document is for general guidance only. Angel Broking Limited or any of its affiliates/ group companies shall not be in any way
responsible for any loss or damage that may arise to any person from any inadvertent error in the information contained in this report.
Angel Broking Limited has not independently verified all the information contained within this document. Accordingly, we cannot testify,
nor make any representation or warranty, express or implied, to the accuracy, contents or data contained within this document. While
Angel Broking Limited endeavours to update on a reasonable basis the information discussed in this material, there may be regulatory,
compliance, or other reasons that prevent us from doing so.
This document is being supplied to you solely for your information, and its contents, information or data may not be reproduced,
redistributed or passed on, directly or indirectly.
Angel Broking Limited and its affiliates may seek to provide or have engaged in providing corporate finance, investment banking or
other advisory services in a merger or specific transaction to the companies referred to in this report, as on the date of this report or in
the past.
Neither Angel Broking Limited, nor its directors, employees or affiliates shall be liable for any loss or damage that may arise from or in
connection with the use of this information.
Note: Please refer to the important `Stock Holding Disclosure' report on the Angel website (Research Section). Also, please refer to the
latest update on respective stocks for the disclosure status in respect of those stocks. Angel Broking Limited and its affiliates may have
investment positions in the stocks recommended in this report.
Disclosure of Interest Statement JPL
1. Analyst ownership of the stock No
2. Angel and its Group companies ownership of the stock No
3. Angel and its Group companies' Directors ownership of the stock No
4. Broking relationship with company covered No
Note: We have not considered any Exposure below Rs 1 lakh for Angel, its Group companies and Directors.
Ratings (Returns) : Buy (> 15%) Accumulate (5% to 15%) Neutral (-5 to 5%)
Reduce (-5% to 15%) Sell (< -15%)
August 2, 2010 10