Famous Kala Jadu, Black magic expert in Faisalabad and Kala ilam specialist i...
JP Associates
1. 1QFY2011 Result Update | Infrastructure
July 26, 2010
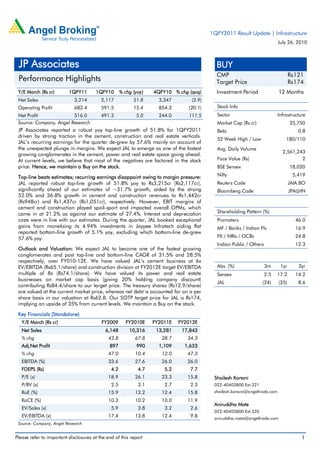
JP Associates BUY
CMP Rs121
Performance Highlights Target Price Rs174
Y/E March (Rs cr) 1QFY11 1QFY10 % chg (yoy) 4QFY10 % chg (qoq) Investment Period 12 Months
Net Sales 3,214 2,117 51.8 3,347 (3.9)
Operating Profit 682.4 591.5 15.4 854.3 (20.1) Stock Info
Net Profit 516.0 491.3 5.0 244.0 111.5 Sector Infrastructure
Source: Company, Angel Research Market Cap (Rs cr) 25,750
JP Associates reported a robust yoy top-line growth of 51.8% for 1QFY2011 Beta 0.8
driven by strong traction in the cement, construction and real estate verticals.
52 Week High / Low 180/110
JAL’s recurring earnings for the quarter de-grew by 57.6% mainly on account of
the unexpected plunge in margins. We expect JAL to emerge as one of the fastest Avg. Daily Volume
2,561,243
growing conglomerates in the cement, power and real estate space going ahead.
At current levels, we believe that most of the negatives are factored in the stock Face Value (Rs) 2
price. Hence, we maintain a Buy on the stock. BSE Sensex 18,020
Top-line beats estimates; recurring earnings disappoint owing to margin pressure: Nifty 5,419
JAL reported robust top-line growth of 51.8% yoy to Rs3,215cr (Rs2,117cr), Reuters Code JAIA.BO
significantly ahead of our estimates of ~31.7% growth, aided by the strong Bloomberg Code JPA@IN
52.0% and 36.8% growth in cement and construction revenues to Rs1,442cr
(Rs948cr) and Rs1,437cr (Rs1,051cr), respectively. However, EBIT margins of
cement and construction played spoil-sport and impacted overall OPMs, which
came in at 21.2% as against our estimate of 27.4%. Interest and depreciation Shareholding Pattern (%)
costs were in line with our estimates. During the quarter, JAL booked exceptional Promoters 46.0
gains from monetising its 4.94% investments in Jaypee Infratech aiding flat MF / Banks / Indian Fls 16.9
reported bottom-line growth of 5.1% yoy, excluding which bottom-line de-grew
57.6% yoy. FII / NRIs / OCBs 24.8
Indian Public / Others 12.3
Outlook and Valuation: We expect JAL to become one of the fastest growing
conglomerates and post top-line and bottom-line CAGR of 31.5% and 28.5%
respectively, over FY010-12E. We have valued JAL’s cement business at 6x
EV/EBITDA (Rs65.1/share) and construction division at FY2012E target EV/EBITDA Abs. (%) 3m 1yr 3yr
multiple of 8x (Rs74.1/share). We have valued its power and real estate Sensex 2.5 17.2 14.2
businesses on market cap basis (giving 20% holding company discount)
JAL (24) (25) 8.6
contributing Rs84.4/share to our target price. The treasury shares (Rs12.9/share)
are valued at the current market price, whereas net debt is accounted for on a per
share basis in our valuation at Rs62.8. Our SOTP target price for JAL is Rs174,
implying an upside of 35% from current levels. We maintain a Buy on the stock.
Key Financials (Standalone)
Y/E March (Rs cr) FY2009 FY2010E FY2011E FY2012E
Net Sales 6,148 10,316 13,281 17,843
% chg 43.8 67.8 28.7 34.3
Adj.Net Profit 897 990 1,109 1,633
% chg 47.0 10.4 12.0 47.3
EBITDA (%) 33.6 27.6 26.0 26.0
FDEPS (Rs) 4.2 4.7 5.2 7.7
P/E (x) 18.9 26.1 23.3 15.8 Shailesh Kanani
P/BV (x) 2.5 3.1 2.7 2.3 022-40403800 Ext:321
RoE (%) 15.9 13.2 12.4 15.8 shailesh.kanani@angeltrade.com
RoCE (%) 10.3 10.2 10.0 11.9
Aniruddha Mate
EV/Sales (x) 5.9 3.8 3.2 2.6
022-40403800 Ext:335
EV/EBITDA (x) 17.4 13.8 12.4 9.8 aniruddha.mate@angeltrade.com
Source: Company, Angel Research
Please refer to important disclosures at the end of this report 1
3. JP Associates |1QFY2011 Result Update
Exhibit 3: 1QFY2011 Segmental standalone performance
Y/E March (Rs cr) 1QFY2011 1QFY2010 % chg
Segment Revenue
Cement & Cement Products 1,441 948 52.0
Construction 1,437 1,051 36.8
Power 11 11 (1.4)
Hotel/Hospitality and Golf Course 37 34 9.6
Real Estate 366 95 284.6
Investment 3 - -
Others 4 5 (18.5)
Unallocated 30 18 63.7
Less: Inter-Segmental Performance 112 45 149.9
Total Sales Income 3,218 2,117 52.0
Segment Results
Cement & Cement Products 286.3 301.6 (5.1)
Construction 104.8 183.3 (42.9)
Power 7.0 7.1 (2.1)
Hotel/Hospitality and Golf Course (1.3) 2.2 -
Real Estate 155.8 44.7 248.8
Investment 3.3 - -
Others 0.7 (1.5) -
Exceptional item : Profit on Sale of Shares 513.2 374.6
Total PBIT 1,070 912.1 17.3
Less: Interest Expense 327.9 221.9 47.8
Less: Exceptional Item - 101.6 0.0
Less: Unallocable Expense 21.9 47.6 (53.9)
PBT 719.9 541.0 33.1
PBIT Margin (%) bp chg
Cement & Cement Products 19.9 31.8 (1,194)
Construction 7.3 17.5 (1,016)
Power 63.1 63.6 (44)
Hotel/Hospitality and Golf Course (3.4) 6.6 -
Real Estate 42.6 46.9 (437.0)
Investment 100.0 - -
Others 19.2 (31.5) -
Capital Employed in Segment
Cement & Cement Products 12,990 9,954 30.5
Construction 2,900 1,833 58.2
Power 596 255 133.9
Hotel/Hospitality and Golf Course 481 621 (22.6)
Real Estate 2,154 612 251.8
Investment 5,727 4,504 27.1
Others 262 139 89.0
Unallocated 3,173 4,077 (22.2)
Total 28,282 21,995 28.6
Source: Company, Angel Research
July 26, 2010 3
4. JP Associates |1QFY2011 Result Update
Segment-wise performance
Cement division
JAL’s cement division reported revenue growth of 52.0% yoy to Rs1,441cr
(Rs948.2cr), 7.8% above our estimate of Rs1,337cr. The divisional EBIT margin
came in at 19.9% (31.8%). JAL currently has an installed cement capacity of ~24
MTPA and 1QFY2011 dispatch volumes of ~3.8MTPA. We expect the company to
achieve dispatch volumes of 14.6mtpa and top-line of Rs4,636cr for FY2011E.
Construction division
The construction division reported revenue growth of 36.8% yoy to Rs1,437cr
(Rs1,050cr) as against our expectation of Rs1,171cr. The divisional EBIT margin
came in at 7.3% (17.5%). The in-house construction segment faced margin
pressure due to stoppage of work at Baglihar II and Srisailam canal projects.
Real estate division
The real estate division reported 284.6% yoy revenue growth to Rs366cr (Rs95.2cr)
as against our expectation of Rs183cr. The divisional EBIT margin came in at
42.6% (46.9%).
Exhibit 4: Quarterly revenue trend Exhibit 5: Quarterly EBITDA trend
4,000 113.8 120.0 900
37.0
40.0
3,500 60.5 800 34.0 35.0
82.6 51.8 100.0
3,000 700 28.5 25.5 30.0
62.9 80.0
2,500 600 23.1
21.2 25.0
48.3 53.0 25.8 23.6
2,000 60.0 500
20.0
1,500 38.3 400
40.0 15.0
1,000 300
20.0 10.0
500 200
0 - 100 5.0
2QFY09
3QFY09
4QFY09
1QFY10
2QFY10
3QFY10
4QFY10
1QFY11
0 -
2QFY09
3QFY09
4QFY09
1QFY10
2QFY10
3QFY10
4QFY10
1QFY11
Sales (Rs cr, LHS) Growth (yoy %, RHS) EBITDA (Rs cr, LHS) EBITDAM (%, RHS)
Source: Company, Angel Research Source: Company, Angel Research
Exhibit 6: Quarterly net profit trend
1,000 60.0
900
800 47.7 50.0
700 40.0
600
500 30.0
400 23.2
300 18.5 20.0
17.1 16.1
200 12.6 10.0
100 7.3
3.6
0 -
2QFY09
3QFY09
4QFY09
1QFY10
2QFY10
3QFY10
4QFY10
1QFY11
PAT (Rs cr, LHS) PATM (%, RHS)
Source: Company, Angel Research
July 26, 2010 4
5. JP Associates |1QFY2011 Result Update
Investment Arguments
On schedule cement capacity expansion instills confidence: JAL is on its way to
become one of the leading players in the cement space following capacity
expansion from 9.0mtpa in FY2008 to 37.6mtpa in FY2012E. The capacity
expansion is on track and in line with management guidance. Cement contributed
44%, 35% and 38% to standalone top-line in FY2008, FY2009 and FY2010
respectively, and is expected to contribute 35% and 38% in FY2011E and
FY2012E, respectively. We believe that the cement capacity size that JAL proposes
to set up would enable it to have substantial bargaining power, result in operating
leverage benefits and catapult JAL into the league of cement majors.
Exhibit 7: JAL's cement capacity vis-a-vis peers
60.0 48.9
50.0 37.6
40.0 27 30.4
30.0
15.8 14.0
20.0
10.0 5.4
-
ACC
Ambuja
Madras Cem
India Cements
JP Associates
JK Lakshmi
Grasim (Incl.
Ultratech)
Cem
FY09 FY10E FY11E FY12E
Source: Company, Angel Research
Construction arm to log 26.4% CAGR over FY2010-12E: JAL is developing the
160km, 6-lane (extendable to 8 lanes) access controlled Yamuna expressway
between Noida and Agra. The Yamuna expressway (YE) project also involves real
estate development to the tune of 530mn.sq.ft. The cost of YE is Rs9,739cr and
has a concession period of 36 years. Financial closure of the YE is done with 69%
of the TPC already put in (equity component of Rs1,250cr, IPO proceeds of
Rs1,500cr and debt of Rs4,477cr). Moreover, Jaypee Infratech is in possession of
96.5% of the land required for construction of the highway, and work is on
schedule. Thus, JAL’s strong execution track record backed by in-place funding
and acquired land renders strong visibility to its construction arm.
Diversified play: JAL is a unique play on the ongoing infrastructure theme with a
bouquet of offerings in construction, cement, power and real-estate. Moreover, not
only does the company have a diversified set of offerings, but also enjoys scale
benefits in each of them. We believe that the company stands to benefit as the
infrastructure theme pans out going ahead.
Outlook and Valuation: We expect JAL to be one of the fastest growing
conglomerates and post top-line and bottom-line CAGR of 31.5% and 28.5%
respectively, over FY010-12E. We have valued JAL’s cement business at 6x
EV/EBITDA (Rs65.1/share) and construction division at FY2012E target EV/EBITDA
multiple of 8x (Rs74.1/share). We have valued its power and real estate businesses
on market cap basis (giving 20% holding company discount) contributing
Rs84.4/share to our target price. The treasury shares (Rs12.9/share) are valued at
the current market price, whereas net debt is accounted for on a per share basis in
our valuation at Rs62.8. Our SOTP target price for JAL is Rs174, implying an
upside of 35% from current levels. We maintain a Buy on the stock.
July 26, 2010 5
6. JP Associates |1QFY2011 Result Update
Exhibit 8: SOTP Valuation Summary
Business Segment Methodology Rs cr Rs/share % to Target Price
Cement EV/EBIDTA (x) 6x EV/EBITDA 13,848 65.1 37.4
Construction EV/EBIDTA (x) 8x EV/EBITDA 15,760 74.1 42.5
Power Mcap of JPVL @20% holding co discount 9,190 43.2 24.8
Real Estate NAV , Mcap Jaypee InfraTech + Jaypee Greens 8,651 40.7 23.4
Hotels - 8x FY2012E Net Profit 148 0.7 0.4
Treasury Stock At CMP 2,758 13.0 7.4
Net Debt - Net Debt for Cement, Construction and Real Estate Business (13,311) (62.6) (35.9)
Total 37,044 174.1 100.0
Source: Company, Angel Research
Exhibit 9: Key Assumptions
Particulars FY2009 FY2010 FY2011E FY2012E
Cement Capacity (MT) 14.7 20.6 26.4 30.8
Cement Production (MT) 7.6 11.2 15.5 22.0
Cement Sales (MT) 7.0 10.6 14.6 20.8
Realisations /Ton 3,594 3,754 3,491 3,631
Source: Company, Angel Research
Exhibit 10: Angel EPS forecast v/s consensus
(Rs) Angel Forecast Bloomberg Consensus Variation
FY2011E 5.2 5.9 13.2
FY2012E 7.7 6.9 (10.4)
Source: Company, Angel Research
July 26, 2010 6
12. JP Associates |1QFY2011 Result Update
Research Team Tel: 022 - 4040 3800 E-mail: research@angeltrade.com Website: www.angeltrade.com
DISCLAIMER
This document is solely for the personal information of the recipient, and must not be singularly used as the basis of any investment
decision. Nothing in this document should be construed as investment or financial advice. Each recipient of this document should make
such investigations as they deem necessary to arrive at an independent evaluation of an investment in the securities of the companies
referred to in this document (including the merits and risks involved), and should consult their own advisors to determine the merits and
risks of such an investment.
Angel Broking Limited, its affiliates, directors, its proprietary trading and investment businesses may, from time to time, make
investment decisions that are inconsistent with or contradictory to the recommendations expressed herein. The views contained in this
document are those of the analyst, and the company may or may not subscribe to all the views expressed within.
Reports based on technical and derivative analysis center on studying charts of a stock's price movement, outstanding positions and
trading volume, as opposed to focusing on a company's fundamentals and, as such, may not match with a report on a company's
fundamentals.
The information in this document has been printed on the basis of publicly available information, internal data and other reliable
sources believed to be true, but we do not represent that it is accurate or complete and it should not be relied on as such, as this
document is for general guidance only. Angel Broking Limited or any of its affiliates/ group companies shall not be in any way
responsible for any loss or damage that may arise to any person from any inadvertent error in the information contained in this report.
Angel Broking Limited has not independently verified all the information contained within this document. Accordingly, we cannot testify,
nor make any representation or warranty, express or implied, to the accuracy, contents or data contained within this document. While
Angel Broking Limited endeavours to update on a reasonable basis the information discussed in this material, there may be regulatory,
compliance, or other reasons that prevent us from doing so.
This document is being supplied to you solely for your information, and its contents, information or data may not be reproduced,
redistributed or passed on, directly or indirectly.
Angel Broking Limited and its affiliates may seek to provide or have engaged in providing corporate finance, investment banking or
other advisory services in a merger or specific transaction to the companies referred to in this report, as on the date of this report or in
the past.
Neither Angel Broking Limited, nor its directors, employees or affiliates shall be liable for any loss or damage that may arise from or in
connection with the use of this information.
Note: Please refer to the important `Stock Holding Disclosure' report on the Angel website (Research Section). Also, please
refer to the latest update on respective stocks for the disclosure status in respect of those stocks. Angel Broking Limited and
its affiliates may have investment positions in the stocks recommended in this report.
Disclosure of Interest Statement (Company name) JP Associates
1. Analyst ownership of the stock No
2. Angel and its Group companies ownership of the stock No
3. Angel and its Group companies' Directors ownership of the stock No
4. Broking relationship with company covered No
Note: We have not considered any Exposure below Rs 1 lakh for Angel, its Group companies and Directors.
Ratings (Returns) : Buy (> 15%) Accumulate (5% to 15%) Neutral (-5 to 5%)
Reduce (-5% to 15%) Sell (< -15%)
July 26, 2010 12