NMDC 1QFY2011 Results | Strong Sales Growth Driven by Higher Realisations
•
0 likes•259 views

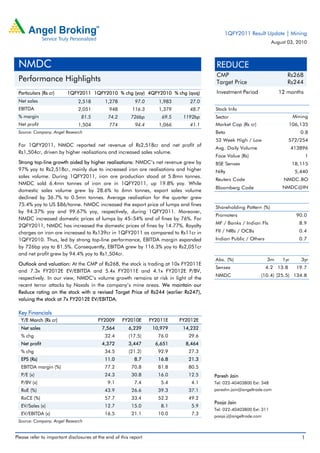
For 1QFY2011, NMDC reported a 97% increase in net sales to Rs2,518cr driven by higher iron ore realizations and sales volume. Net profit grew 94.4% to Rs1,504cr due to strong top-line growth. EBITDA margin expanded significantly by 726bps to 81.5% despite higher royalty charges. The company aims to increase production capacity to 50mn tonnes by FY2014-15 through mine expansion projects, however volume growth faces risks from ongoing Naxal activities in its mine areas. At the current market price, the stock trades at lower multiples compared to its historical averages.

Recommended
More Related Content
What's hot
What's hot (18)
Viewers also liked
Viewers also liked (18)
Similar to NMDC 1QFY2011 Results | Strong Sales Growth Driven by Higher Realisations
Similar to NMDC 1QFY2011 Results | Strong Sales Growth Driven by Higher Realisations (20)
More from Angel Broking
More from Angel Broking (20)
Recently uploaded
Recently uploaded (20)
NMDC 1QFY2011 Results | Strong Sales Growth Driven by Higher Realisations
- 1. 1QFY2011 Result Update | Mining August 03, 2010 NMDC REDUCE CMP Rs268 Performance Highlights Target Price Rs244 Particulars (Rs cr) 1QFY2011 1QFY2010 % chg (yoy) 4QFY2010 % chg (qoq) Investment Period 12 months Net sales 2,518 1,278 97.0 1,983 27.0 EBITDA 2,051 948 116.3 1,379 48.7 Stock Info % margin 81.5 74.2 726bp 69.5 1192bp Sector Mining Net profit 1,504 774 94.4 1,066 41.1 Market Cap (Rs cr) 106,135 Source: Company, Angel Research Beta 0.8 52 Week High / Low 572/254 For 1QFY2011, NMDC reported net revenue of Rs2,518cr and net profit of Avg. Daily Volume 413896 Rs1,504cr, driven by higher realisations and increased sales volume. Face Value (Rs) 1 Strong top-line growth aided by higher realisations: NMDC’s net revenue grew by BSE Sensex 18,115 97% yoy to Rs2,518cr, mainly due to increased iron ore realisations and higher Nifty 5,440 sales volume. During 1QFY2011, iron ore production stood at 5.8mn tonnes. Reuters Code NMDC.BO NMDC sold 6.4mn tonnes of iron ore in 1QFY2011, up 19.8% yoy. While Bloomberg Code NMDC@IN domestic sales volume grew by 28.6% to 6mn tonnes, export sales volume declined by 36.7% to 0.5mn tonnes. Average realisation for the quarter grew 75.4% yoy to US $86/tonne. NMDC increased the export price of lumps and fines Shareholding Pattern (%) by 94.37% yoy and 99.67% yoy, respectively, during 1QFY2011. Moreover, Promoters 90.0 NMDC increased domestic prices of lumps by 45–54% and of fines by 76%. For MF / Banks / Indian Fls 8.9 2QFY2011, NMDC has increased the domestic prices of fines by 14.77%. Royalty charges on iron ore increased to Rs139cr in 1QFY2011 as compared to Rs11cr in FII / NRIs / OCBs 0.4 1QFY2010. Thus, led by strong top-line performance, EBITDA margin expanded Indian Public / Others 0.7 by 726bp yoy to 81.5%. Consequently, EBITDA grew by 116.3% yoy to Rs2,051cr and net profit grew by 94.4% yoy to Rs1,504cr. Abs. (%) 3m 1yr 3yr Outlook and valuation: At the CMP of Rs268, the stock is trading at 10x FY2011E Sensex 4.2 13.8 19.7 and 7.3x FY2012E EV/EBITDA and 5.4x FY2011E and 4.1x FY2012E P/BV, NMDC (10.4) (25.5) 134.8 respectively. In our view, NMDC’s volume growth remains at risk in light of the recent terror attacks by Naxals in the company’s mine areas. We maintain our Reduce rating on the stock with a revised Target Price of Rs244 (earlier Rs247), valuing the stock at 7x FY2012E EV/EBITDA. Key Financials Y/E March (Rs cr) FY2009 FY2010E FY2011E FY2012E Net sales 7,564 6,239 10,979 14,232 % chg 32.4 (17.5) 76.0 29.6 Net profit 4,372 3,447 6,651 8,464 % chg 34.5 (21.2) 92.9 27.3 EPS (Rs) 11.0 8.7 16.8 21.3 EBITDA margin (%) 77.2 70.8 81.8 80.5 P/E (x) 24.3 30.8 16.0 12.5 Paresh Jain P/BV (x) 9.1 7.4 5.4 4.1 Tel: 022-40403800 Ext: 348 RoE (%) 43.9 26.6 39.3 37.1 pareshn.jain@angeltrade.com RoCE (%) 57.7 33.4 52.2 49.2 Pooja Jain EV/Sales (x) 12.7 15.0 8.1 5.9 Tel: 022-40403800 Ext: 311 EV/EBITDA (x) 16.5 21.1 10.0 7.3 pooja.j@angeltrade.com Source: Company, Angel Research Please refer to important disclosures at the end of this report 1
- 2. NMDC | 1QFY2011 Result Update Exhibit 1: 1QFY2011 performance Y/E March (Rs cr) 1QFY11 1QFY10 yoy % FY2010 FY2009 yoy % Net sales 2,518 1,278 97.0 6,239 7,564 (17.5) Raw material (23) 12 - 2 (127) - % of net sales - 0.9 0.0 - Consumption of stores 45 43 3.8 209 214 (1.9) & spares % of net sales 1.8 3.4 3.4 2.8 Staff cost 110 93 18.8 420 421 (0.4) % of net sales 4.4 7.3 6.7 5.6 Other expenditure 335 183 83.6 1,189 1,219 (2.4) % of net sales 13.3 14.3 19.1 16.1 Total expenditure 467 330 41.6 1,820 1,726 5.4 % of net sales 18.5 25.8 29.2 22.8 Operating profit 2,051 948 116.3 4,419 5,838 (24.3) OPM% 81.5 74.2 70.8 77.2 Other operating income - - - - - - EBITDA 2,051 948 116.3 4,419 5,838 (24.3) EBITDA margins (%) 81.5 74.2 70.8 77.2 Interest - - - - - - Depreciation 24 5 357.9 73 74 (0.5) Other income 222 229 (3.1) 862 884 (2.5) Exceptional items - - - - - - PBT 2,249 1,172 91.9 5,207 6,648 (21.7) % of net sales 89.3 91.7 83.5 87.9 Tax 745 398 87.0 1,760 2,276 (22.7) % of PBT 33.1 34.0 33.8 34.2 PAT 1,504 774 94.4 3,447 4,372 (21.2) % of net sales 59.7 60.5 55.3 57.8 EPS (Rs) 3.8 2.0 94.4 8.7 11.0 (21.2) Source: Company, Angel Research August 03, 2010 2
- 3. NMDC | 1QFY2011 Result Update Result highlights Strong top-line growth aided by higher realisations… Average realisation for the quarter grew by 75.4% yoy to US $86/tonne. NMDC increased the export price of lumps and fines by 94.36% and 99.67% yoy, respectively, during the quarter. Moreover, NMDC increased domestic prices of lumps by 45–54% and of fines by 76%. For 2QFY2011, the company has increased the domestic prices of fines by 14.77%. During the quarter, iron ore production stood at 5.8mn tonnes. The company sold 6.4mn tonnes of iron ore in 1QFY2011, higher by 19.8% yoy. While domestic sales volume increased by 28.6% to 6mn tonnes, export sales volume declined by 36.7% to 0.5mn tonnes. Consequently, net revenue grew by 97.0% yoy to Rs2,518cr primarily on account of increased iron ore realisations and higher sales volume. Exhibit 2: Net revenue grew by 97.0% 3,000 125 2,518 2,500 100 1,983 75 2,000 1,588 50 (Rs cr) 1,390 1,500 1,278 25 1,000 0 500 (25) 0 (50) 1QFY10 2QFY10 3QFY10 4QFY10 1QFY11 Net revenue (LHS) yoy change (RHS) Source: Company, Angel Research …drives operating performance Despite royalty charge on iron ore increasing to Rs139cr in 1QFY2011 as compared to Rs11cr in 1QFY2010 as the government started charging royalty on an ad valorem basis from 2QFY2010, EBITDA margin expanded by 726bp yoy to 81.5%, led by strong top-line performance. Thus, EBITDA increased by 116.3% yoy to Rs2,051cr. August 03, 2010 3
- 4. NMDC | 1QFY2011 Result Update Exhibit 3: EBITDA margin expands by 726bp 2,500 90 2,051 2,000 80 1,500 1,379 (Rs cr) 1,079 70 (%) 948 1,016 1,000 60 500 0 50 1QFY10 2QFY10 3QFY10 4QFY10 1QFY11 EBITDA (LHS) EBITDA margin (RHS) Source: Company, Angel Research …leading to strong net profit growth While depreciation expenses increased by 357.9% yoy to Rs24cr, other income declined 3.1% yoy to Rs222cr. Thus, led by strong operational performance, net profit increased by 94.4% yoy to Rs1,504cr. Exhibit 4: Net profit grew by 94.4% yoy 1,600 1,504 62 1,400 60 1,200 1,066 58 1,000 860 774 771 56 (Rs cr) 800 (%) 54 600 400 52 200 50 0 48 1QFY10 2QFY10 3QFY10 4QFY10 1QFY11 Net profit (LHS) Net profit margin (RHS) Source: Company, Angel Research August 03, 2010 4
- 5. NMDC | 1QFY2011 Result Update Investment rationale Increased production to 50mn tonnes by FY2014-15E Management plans to ramp up its production capacity to 50mn tonnes by FY2014-15E through increased exploration of its existing mines and development of new mines, i.e., Deposit 11B and Deposit 13 in Bailadila and Kumaraswany in Karnataka. The targeted cost for the development of the three mines is Rs2,400cr. Exhibit 5: Expansion projects undertaken to increase mining capacity Capacity Capex Mine Location Date Comments (mn tonnes) (Rs cr) Original plan was October 2010, 56% completed till Deposit 11B Bailadila 7 607 Mar-11 March 2010. Rs213cr spent till March 2010 Deposit 13 Bailadila 10 - In a JV with CMDC Kumaraswamy Karnataka 7 Mar-12 In a JV with CMDC, will supply iron ore to the steel Deposit 4 - 10 - plant at Nagarnar near Jagdalpur, Chhattisgarh Source: Company, Angel Research However, lately the company’s volumes have been impacted by ongoing Naxal activities in the Dantewada region of Chhattisgarh. Positioned at the lower end of the cost curve NMDC's operating cost (excluding freight) of US $7.2/tonne is at the lower end of the global iron ore cost curve. The company enjoys the benefit of low costs on account of its mines’ close proximity to ports and railways. Considering the additional capacity coming on stream, management also plans to invest Rs3,500cr in building a 10mn tonne slurry pipeline from Bacheli to the Vizag port, which would help it maintain margins. Seeking to diversify into steel making and acquire mines abroad Management intends to diversify its operations by moving downstream through the establishment of steel plants and pellet plants. Accordingly, the company has lined up capex of Rs26,500cr for the next five years. Of the total amount, management plans to invest Rs15,500cr in setting up an integrated steel plant, while Rs1,400cr would be incurred towards setting up two pellet plants. Moreover, majority of the cash outflow will start from FY2013E. In addition, management has indicated its plans to acquire mines in Australia, Brazil and South Africa. August 03, 2010 5
- 6. NMDC | 1QFY2011 Result Update Outlook and valuation At the CMP of Rs268, the stock is trading at 10x FY2011E and 7.3x FY2012E EV/EBITDA and 5.4x FY2011E and 4.1x FY2012E P/BV, respectively. In our view, NMDC’s volume growth remains at risk in light of the recent terror attacks by Naxals in the company’s mine areas. Consequently, we have revised our FY2011E sales volume estimates downwards from 29mn tonnes to 27mn tonnes. We maintain our Reduce rating on the stock with a revised Target Price of Rs244 (earlier Rs247), valuing the stock at 7x FY2012E EV/EBITDA. Exhibit 6: Key assumptions FY11E FY12E Sales volume (mn tonnes) 27 35 Average realisation (US $/tonne) 87 87 Source: Angel Research Exhibit 7: Change in estimates (Rs cr) Earlier estimates Revised estimates Upgrade/(downgrade) (%) FY11E FY12E FY11E FY12E FY11E FY12E Net sales 11,793 14,232 10,979 14,232 (6.9) 0.0 EBITDA 9,721 11,550 8,985 11,460 (7.6) (0.8) EBITDA margin (%) 82.4 81.2 81.8 80.5 (60bp) (63bp) PBT 10,715 12,847 9,926 12,633 (7.4) (1.7) Net income 7,179 8,607 6,651 8,464 (7.4) (1.7) Net margin (%) 60.9 60.5 60.6 59.5 (30bp) (101bp) Source: Company, Angel Research Exhibit 8: EPS - Angel forecast vs. consensus Year (%) Angel forecast Bloomberg consensus Variation (%) FY11E 16.8 16.9 (0.5) FY12E 21.3 20.0 6.6 Source: Bloomberg, Angel Research August 03, 2010 6
- 7. NMDC | 1QFY2011 Result Update Exhibit 9: EV/EBITDA band 300,000 30x 250,000 24x 200,000 18x (Rs cr) 150,000 12x 100,000 50,000 6x 0 Apr-06 Apr-07 Apr-08 Apr-09 Apr-10 Source: Bloomberg, Angel Research Exhibit 10: P/E band 800 700 40x 600 500 30x (Rs) 400 20x 300 200 10x 100 0 Apr-06 Apr-07 Apr-08 Apr-09 Apr-10 Source: Bloomberg, Angel Research Exhibit 11: P/BV band 900 16x 800 700 12x 600 500 (Rs) 8x 400 300 200 4x 100 0 Apr-06 Apr-07 Apr-08 Apr-09 Apr-10 Source: Bloomberg, Angel Research August 03, 2010 7
- 8. NMDC | 1QFY2011 Result Update Exhibit 12: Recommendation summary Companies CMP Target Price Reco. Mcap Upside P/E (x) P/BV (x) EV/EBITDA (x) RoE (%) RoCE (%) FY11E FY12E FY11E FY12E FY11E FY12E FY11E FY12E FY11E FY12E SAIL 201 - Neutral 83,166 - 13.3 11.7 2.2 1.9 8.7 7.6 17.9 17.6 16.3 16.9 Tata Steel 547 697 Buy 48,494 27.4 9.0 9.6 1.5 1.3 6.8 6.2 17.9 14.7 11.8 11.7 JSW Steel 1,128 1,344 Buy 28,817 19.2 14.8 11.3 1.5 1.3 7.0 5.5 13.9 12.4 12.5 12.6 Sesa Goa 370 - Neutral 30,739 - 7.3 7.6 2.6 1.9 4.0 3.2 45.9 31.5 43.7 34.7 NMDC 268 244 Reduce 106,135 (8.9) 16.0 12.5 5.4 4.1 10.0 7.3 39.3 37.1 52.2 49.2 Hindalco 165 208 Buy 31,652 25.8 8.7 8.1 1.2 1.1 6.1 5.8 15.1 14.2 10.3 10.0 Nalco 425 316 Sell 27,370 (25.6) 26.9 22.7 2.5 2.3 15.5 12.2 9.7 10.7 10.7 12.5 Sterlite 179 228 Buy 59,976 27.7 12.5 9.1 1.4 1.2 6.7 4.6 11.6 14.2 11.1 14.1 Hindustan Zinc 1,077 1,227 Buy 45,488 14.0 11.2 8.6 2.1 1.7 6.4 4.1 20.4 21.6 20.7 22.3 Source: Company, Angel Research August 03, 2010 8
- 9. NMDC | 1QFY2011 Result Update Profit & Loss Statement Y/E March (Rs cr) FY2007 FY2008 FY2009 FY2010 FY2011E FY2012E Net sales 4,186 5,711 7,564 6,239 10,979 14,232 Other operating income - - - - - - Total operating income 4,186 5,711 7,564 6,239 10,979 14,232 % chg 12.8 36.4 32.4 (17.5) 76.0 29.6 Total expenditure 962 1,374 1,726 1,820 1,995 2,773 Net raw materials 164 145 86 211 243 362 Other mfg costs Personnel 198 356 421 420 405 578 Other 600 874 1,219 1,189 1,347 1,833 EBITDA 3,224 4,337 5,838 4,419 8,985 11,460 % chg 20.1 34.5 34.6 (24.3) 103.3 27.5 (% of Net sales) 77.0 75.9 77.2 70.8 81.8 80.5 Depreciation 80 60 74 73 115 190 EBIT 3,144 4,277 5,764 4,346 8,870 11,270 % chg 22.3 36.1 34.8 (24.6) 104.1 27.1 (% of Net sales) 75.1 74.9 76.2 69.7 80.8 79.2 Interest charges - - - - - - Other income 355 671 884 862 1,056 1,364 (% of PBT) 10.1 13.6 13.3 16.5 10.6 10.8 Share in profit of asso. - - - - - - Recurring PBT 3,498 4,947 6,648 5,207 9,926 12,633 % chg 26.3 41.4 34.4 (21.7) 90.6 27.3 Extra. Inc/(Expense) - - - - - - PBT (reported) 3,498 4,947 6,648 5,207 9,926 12,633 Tax 1,178 1,696 2,276 1,760 3,276 4,169 (% of PBT) 33.7 34.3 34.2 33.8 33.0 33.0 PAT (reported) 2,320 3,251 4,372 3,447 6,651 8,464 Add: Earnings of asso. - - - - - - Less: Minority interest - - - - - - Extra. Expense/(Inc.) - - - - - - PAT after MI (reported) 2,320 3,251 4,372 3,447 6,651 8,464 ADJ. PAT 2,320 3,251 4,372 3,447 6,651 8,464 % chg 26.9 40.1 34.5 (21.2) 92.9 27.3 (% of Net sales) 55.4 56.9 57.8 55.3 60.6 59.5 Basic EPS (Rs) 5.9 8.2 11.0 8.7 16.8 21.3 Fully Diluted EPS (Rs) 5.9 8.2 11.0 8.7 16.8 21.3 % chg 26.9 40.1 34.5 (21.2) 92.9 27.3 August 03, 2010 9
- 10. NMDC | 1QFY2011 Result Update Balance Sheet Y/E March (Rs cr) FY2007 FY2008 FY2009 FY2010E FY2011E FY2012E SOURCES OF FUNDS Equity share capital 132 132 396 396 396 396 Reserves & surplus 5,669 8,157 11,240 13,876 19,135 25,744 Shareholders’ funds 5,801 8,290 11,637 14,272 19,531 26,140 Share warrants - - - - - - Minority interest - - - - - - Total loans - - - - - - Deferred tax liability 27 6 58 85 85 85 Total liabilities 5,828 8,296 11,695 14,357 19,616 26,225 APPLICATION OF FUNDS Gross block 1,304 1,421 1,669 1,771 2,771 3,771 Less: Acc. 799 853 923 984 1,099 1,289 depreciation Net Block 505 568 747 787 1,673 2,482 Capital work-in- 113 112 248 556 556 556 progress Goodwill - - - - - - Investments 74 83 72 76 76 76 Current assets 5,526 8,283 11,771 14,264 18,609 24,599 Cash 4,849 7,199 9,740 12,855 16,696 22,292 Loans & advances 182 244 403 519 519 519 Other 494 840 1,628 890 1,394 1,789 Current liabilities 417 775 1,165 1,348 1,319 1,511 Net current assets 5,108 7,508 10,606 12,916 17,290 23,088 Mis. exp. not written 27 25 22 22 22 22 off Total assets 5,828 8,296 11,695 14,357 19,616 26,225 August 03, 2010 10
- 11. NMDC | 1QFY2011 Result Update Cash flow statement Y/E March (Rs cr) FY2007 FY2008 FY2009 FY2010E FY2011E FY2012E Profit before tax 3,498 4,947 6,648 5,207 9,926 12,633 Depreciation 80 60 74 73 115 190 Change in working (190) (661) (785) 926 (533) (203) capital Less: Other income (101) (105) (866) (832) - - Direct taxes paid (1,236) (1,765) (2,292) (1,770) (3,276) (4,169) Cash flow from 2,052 2,476 2,778 3,604 6,233 8,451 operations (Inc.)/ Dec. in fixed (113) (123) (389) (422) (1,000) (1,000) assets (Inc.)/ Dec. in - - - - - - investments (Inc.)/ Dec. in loans - - - - - - and advances Other income 330 640 880 828 - - Cash flow from 217 517 491 407 (1,000) (1,000) investing Issue of equity - - - - - - Inc./(Dec.) in loans - - - - - - Dividend paid (529) (643) (728) (895) (1,392) (1,855) Others (0) - - - - - Cash flow from (530) (643) (728) (895) (1,392) (1,855) financing Inc./(Dec.) in cash 1,740 2,350 2,541 3,115 3,841 5,596 Opening cash bal. 3,109 4,849 7,199 9,740 12,855 16,696 Closing cash bal. 4,849 7,199 9,740 12,855 16,696 22,292 August 03, 2010 11
- 12. NMDC | 1QFY2011 Result Update Key ratios Y/E March FY2007 FY2008 FY2009 FY2010E FY2011E FY2012E Valuation ratio (x) P/E (on FDEPS) 45.7 32.6 24.3 30.8 16.0 12.5 P/CEPS 44.2 32.1 23.9 30.1 15.7 12.3 P/BV 18.3 12.8 9.1 7.4 5.4 4.1 Dividend yield (%) 1.3 1.8 0.8 0.7 1.1 1.5 EV/Sales 24.2 17.3 12.7 15.0 8.1 5.9 EV/EBITDA 31.4 22.8 16.5 21.1 10.0 7.3 EV/Total assets 17.4 11.9 8.2 6.5 4.6 3.2 Per share data (Rs) EPS (Basic) 5.9 8.2 11.0 8.7 16.8 21.3 EPS (fully diluted) 5.9 8.2 11.0 8.7 16.8 21.3 Cash EPS 6.1 8.4 11.2 8.9 17.1 21.8 DPS 3.5 4.9 2.2 2.0 3.0 4.0 Book value 14.6 20.9 29.4 36.0 49.3 65.9 DuPont analysis EBIT margin 75.1 74.9 76.2 69.7 80.8 79.2 Tax retention ratio (%) 66.3 65.7 65.8 66.2 67.0 67.0 Asset turnover (x) 4.4 5.5 5.0 3.6 5.0 4.2 RoIC (Post-tax) 219.2 270.9 248.4 166.4 268.7 220.3 Cost of debt (post tax) Leverage (x) Operating RoE 219.2 270.9 248.4 166.4 268.7 220.3 Returns (%) RoCE (Pre-tax) 63.8 60.6 57.7 33.4 52.2 49.2 Angel RoIC (pre-tax) 374.8 436.9 349.6 504.5 389.1 342.3 RoE 47.3 46.1 43.9 26.6 39.3 37.1 Turnover ratios (x) Asset turnover (gross 3.3 4.2 4.9 3.6 4.8 4.4 block) Inventory (days) 48 44 64 60 60 60 Receivables (days) 25 31 50 25 30 30 Payables (days) 49 61 81 104 90 90 WC cycle (days) 26 23 33 34 16 22 Solvency ratios (x) Net debt to equity (0.8) (0.9) (0.8) (0.9) (0.9) (0.9) Net debt to EBITDA (1.5) (1.7) (1.7) (2.9) (1.9) (1.9) Interest coverage - - - - - - August 03, 2010 12
- 13. NMDC | 1QFY2011 Result Update Research Team Tel: 022 - 4040 3800 E-mail: research@angeltrade.com Website: www.angeltrade.com DISCLAIMER This document is solely for the personal information of the recipient, and must not be singularly used as the basis of any investment decision. Nothing in this document should be construed as investment or financial advice. Each recipient of this document should make such investigations as they deem necessary to arrive at an independent evaluation of an investment in the securities of the companies referred to in this document (including the merits and risks involved), and should consult their own advisors to determine the merits and risks of such an investment. Angel Broking Limited, its affiliates, directors, its proprietary trading and investment businesses may, from time to time, make investment decisions that are inconsistent with or contradictory to the recommendations expressed herein. The views contained in this document are those of the analyst, and the company may or may not subscribe to all the views expressed within. Reports based on technical and derivative analysis center on studying charts of a stock's price movement, outstanding positions and trading volume, as opposed to focusing on a company's fundamentals and, as such, may not match with a report on a company's fundamentals. The information in this document has been printed on the basis of publicly available information, internal data and other reliable sources believed to be true, but we do not represent that it is accurate or complete and it should not be relied on as such, as this document is for general guidance only. Angel Broking Limited or any of its affiliates/ group companies shall not be in any way responsible for any loss or damage that may arise to any person from any inadvertent error in the information contained in this report. Angel Broking Limited has not independently verified all the information contained within this document. Accordingly, we cannot testify, nor make any representation or warranty, express or implied, to the accuracy, contents or data contained within this document. While Angel Broking Limited endeavours to update on a reasonable basis the information discussed in this material, there may be regulatory, compliance, or other reasons that prevent us from doing so. This document is being supplied to you solely for your information, and its contents, information or data may not be reproduced, redistributed or passed on, directly or indirectly. Angel Broking Limited and its affiliates may seek to provide or have engaged in providing corporate finance, investment banking or other advisory services in a merger or specific transaction to the companies referred to in this report, as on the date of this report or in the past. Neither Angel Broking Limited, nor its directors, employees or affiliates shall be liable for any loss or damage that may arise from or in connection with the use of this information. Note: Please refer to the important `Stock Holding Disclosure' report on the Angel website (Research Section). Also, please refer to the latest update on respective stocks for the disclosure status in respect of those stocks. Angel Broking Limited and its affiliates may have investment positions in the stocks recommended in this report. Disclosure of Interest Statement NMDC 1. Analyst ownership of the stock No 2. Angel and its Group companies ownership of the stock No 3. Angel and its Group companies' Directors ownership of the stock No 4. Broking relationship with company covered No Note: We have not considered any Exposure below Rs 1 lakh for Angel, its Group companies and Directors. Ratings (Returns) : Buy (> 15%) Accumulate (5% to 15%) Neutral (-5 to 5%) Reduce (-5% to 15%) Sell (< -15%) August 03, 2010 13