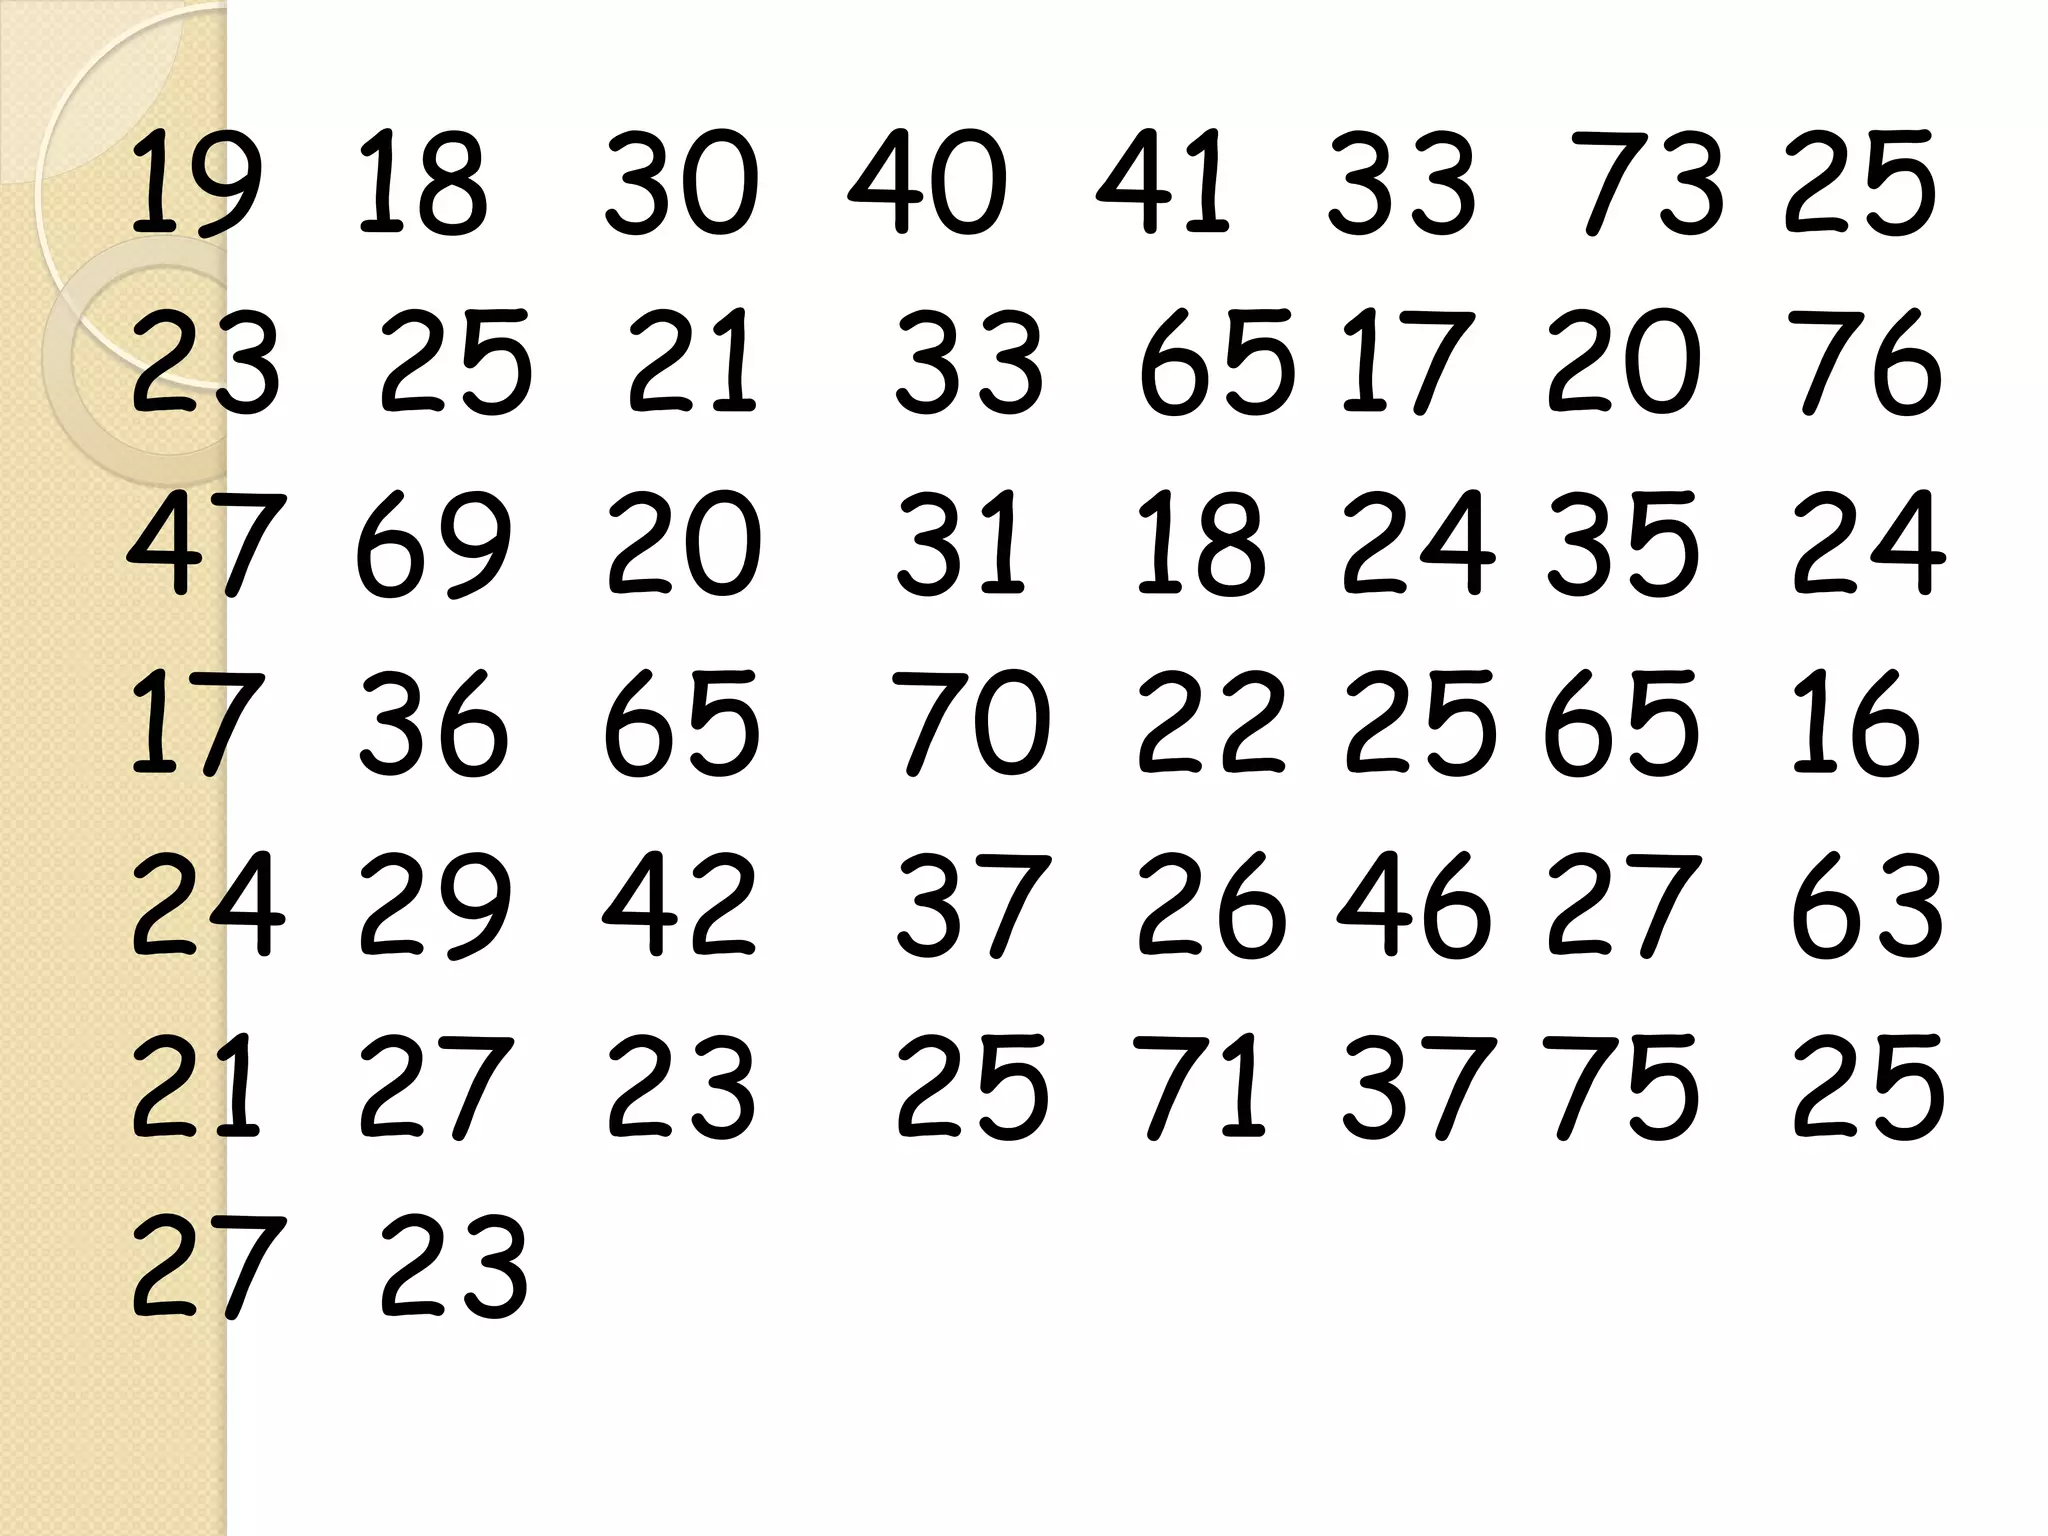
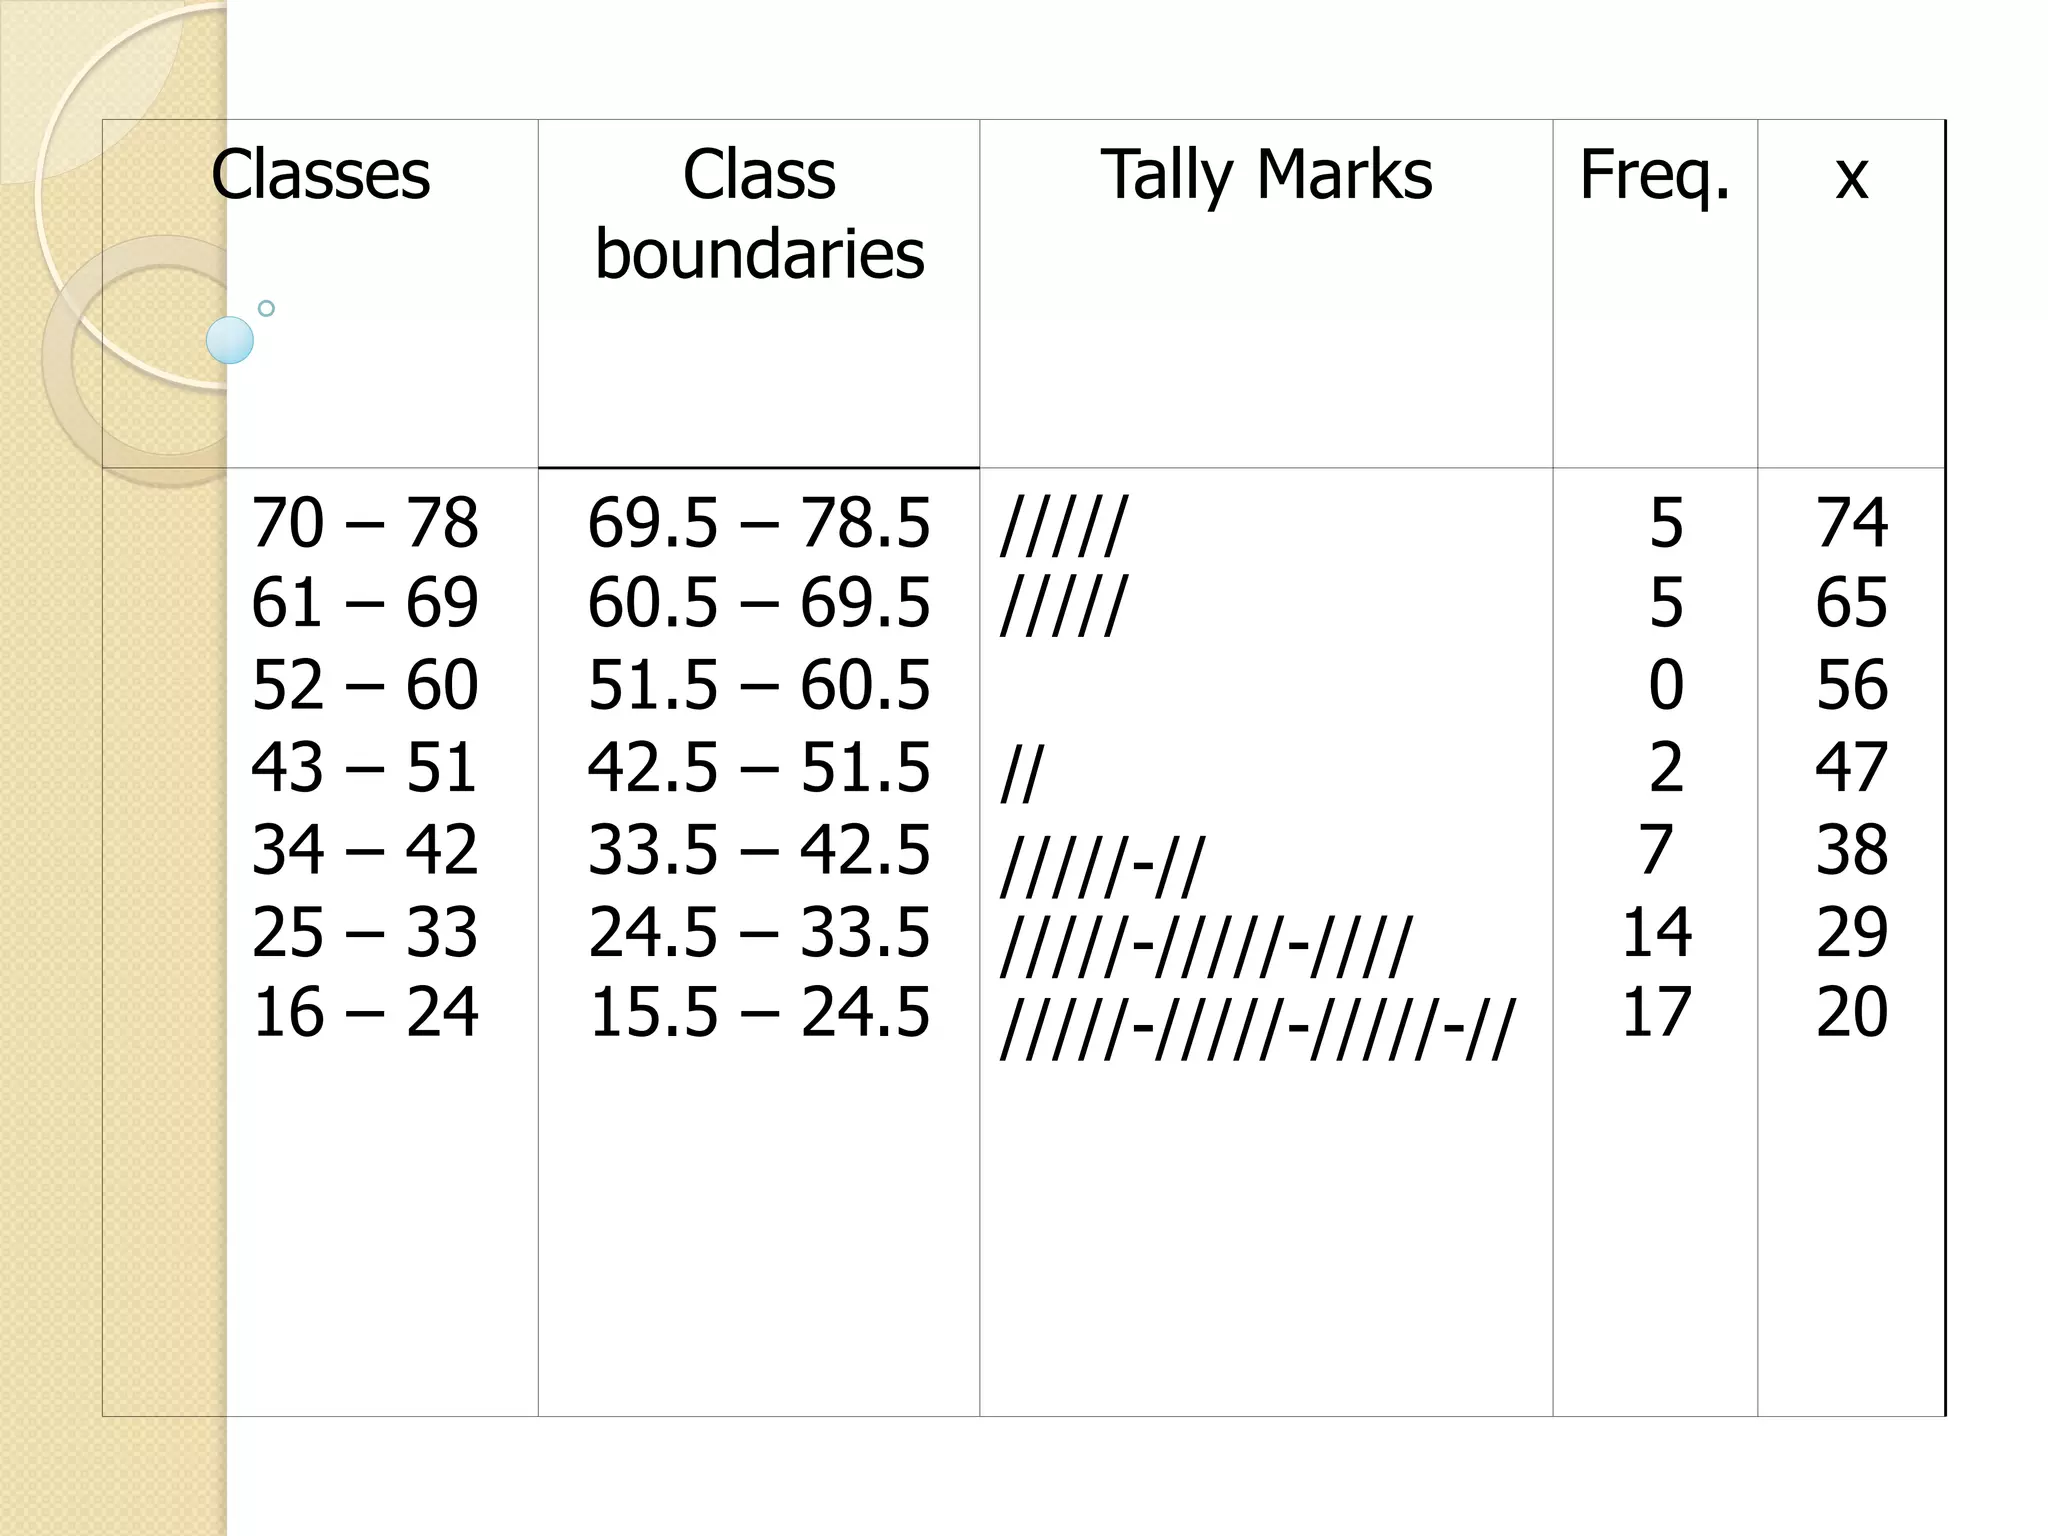
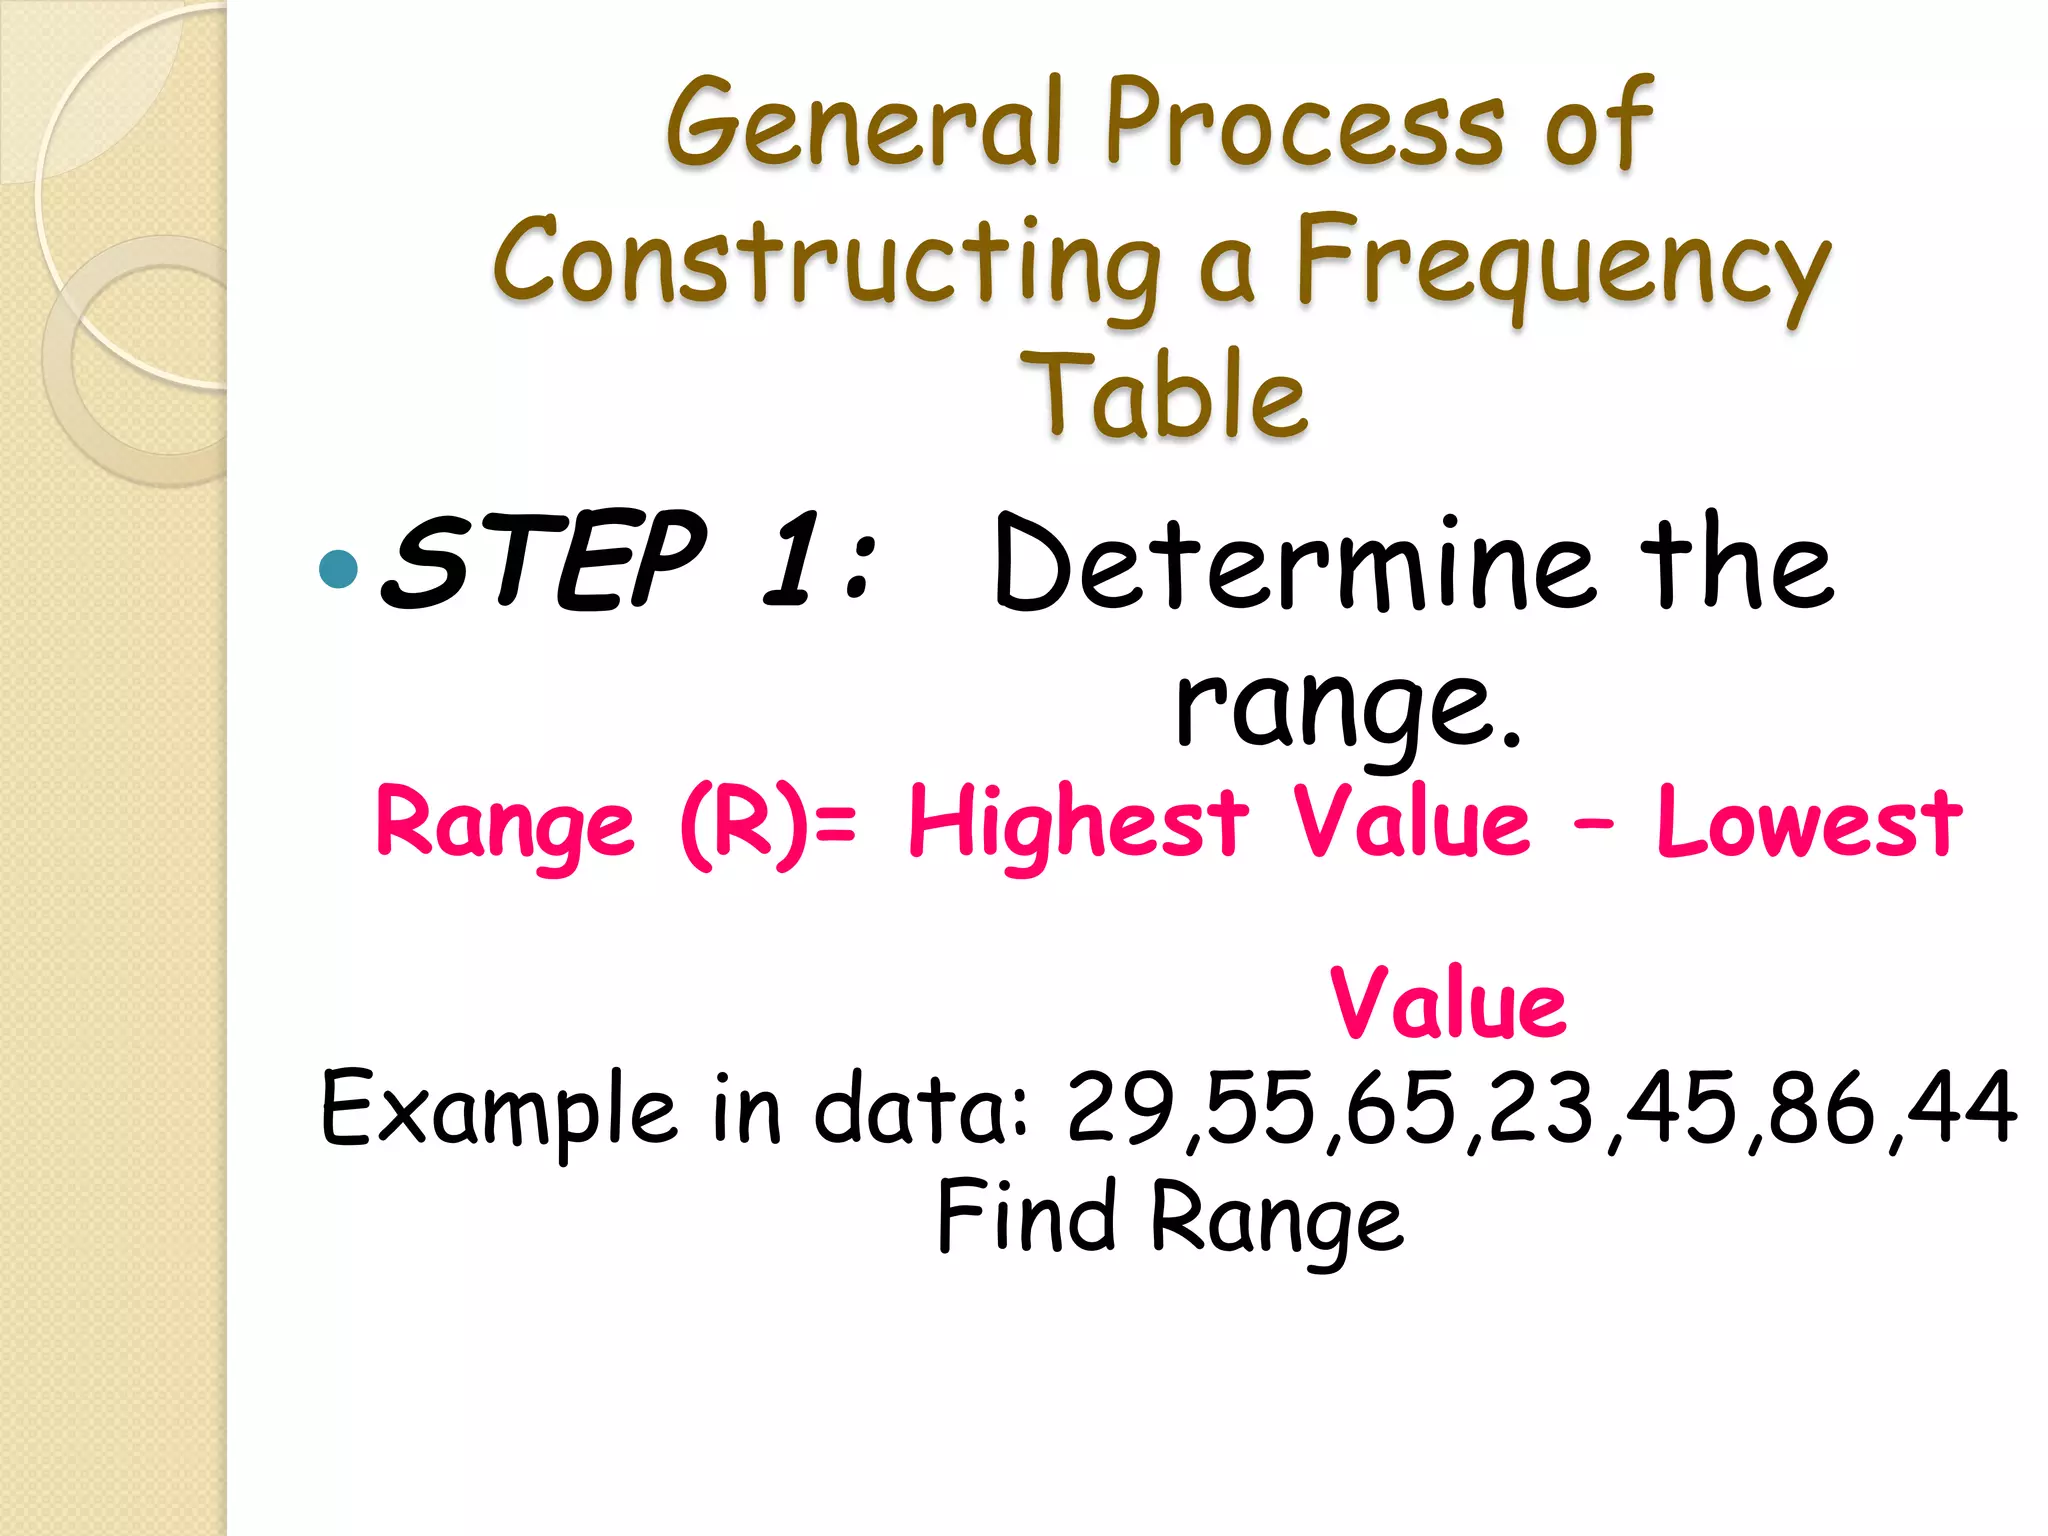
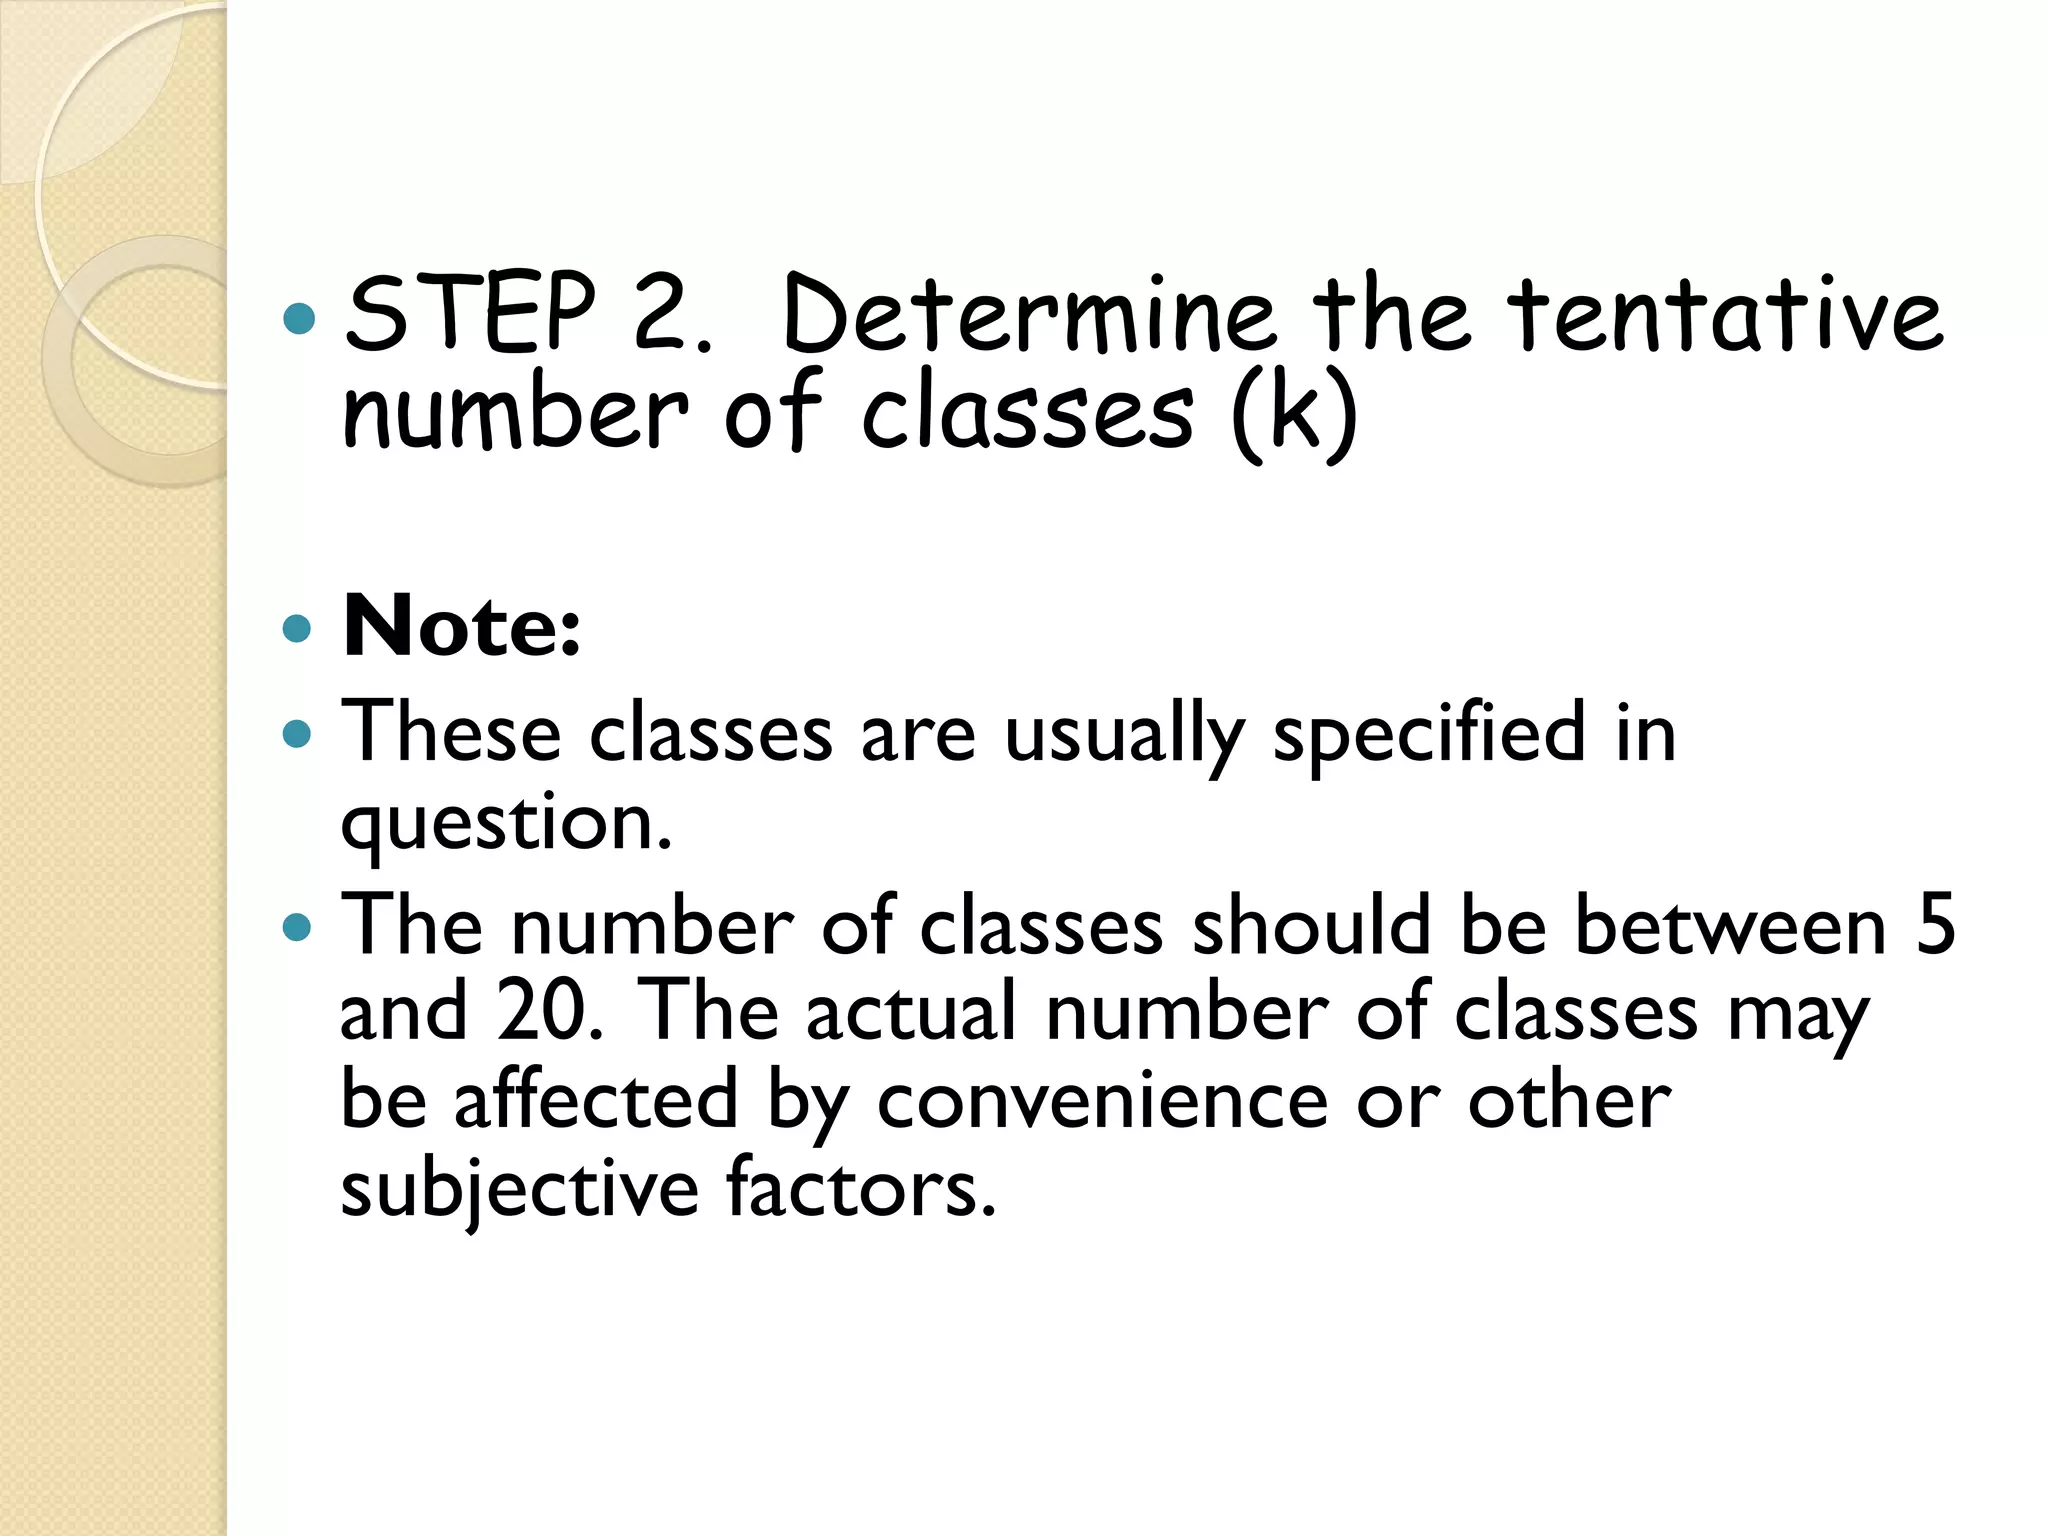
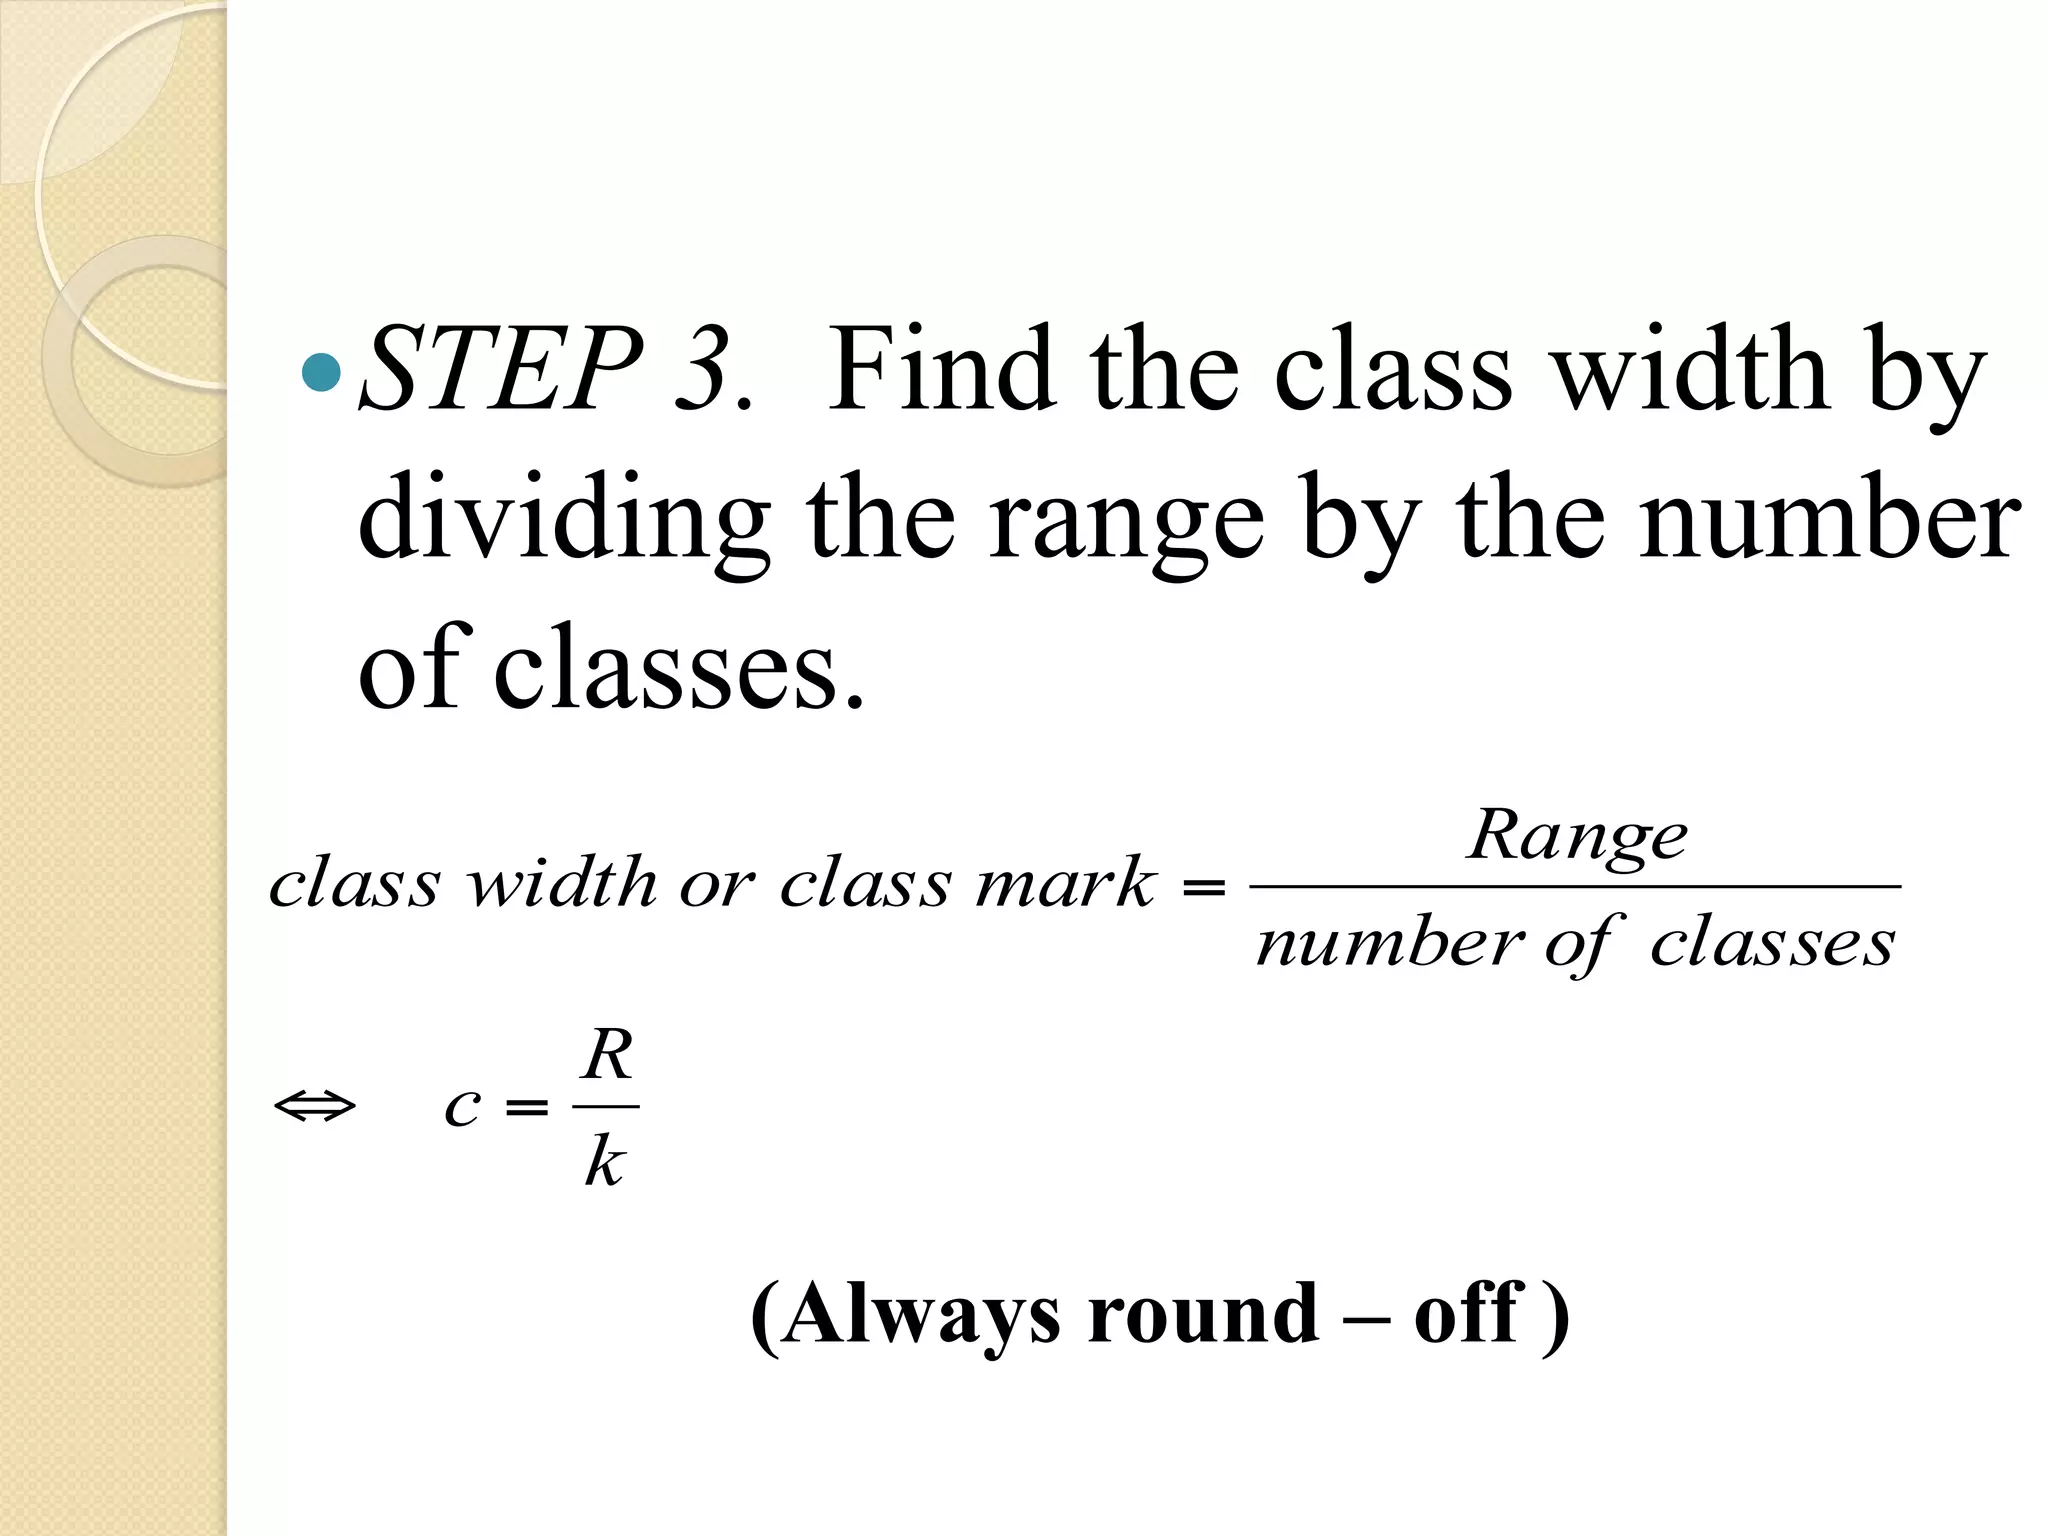
Frequency Distribution
—  A representation,
                   in a tabular format,
 which displays the number of
 observations within a given interval. The
 intervals must be mutually exclusive (each
 score must belong to exactly one class)
 and exhaustive (Including every possible
 element).
Question

— Howdo we construct a
 frequency distribution
 table?
Let’s Try!!!
— Agesof 50 men randomly
 selected from a population
 who died in gunfire are given.
 Construct a frequency
 distribution table having 7
 classes.
19   18   30   40 41 33 73 25
23   25   21    33 65 17 20 76
47   69   20    31 18 24 35 24
17   36   65    70 22 25 65 16
24   29   42    37 26 46 27 63
21   27   23    25 71 37 75 25
27   23
Determine the range.
R = Highest Value – Lowest
                Value
   R = 76 – 16 = 60
—    Find the class width (c).

                    Range               R
 class width =                     ⇔ c=
               number of classes        k

          60
      c =    = 8.57 = 9
          7
Write the classes starting with lowest
                  score.
     Classes       Tally Marks   Freq.

     70   –   78
     61   –   69
     52   –   60
     43   –   51
     34   –   42
     25   –   33
     16   –   24
Classes          Class                Tally Marks       Freq.   x
               boundaries


 70   –   78   69.5   –   78.5   /////                    5     74
 61   –   69   60.5   –   69.5   /////                    5     65
 52   –   60   51.5   –   60.5                            0     56
 43   –   51   42.5   –   51.5   //                       2     47
 34   –   42   33.5   –   42.5   /////-//                7      38
 25   –   33   24.5   –   33.5   /////-/////-////        14     29
 16   –   24   15.5   –   24.5   /////-/////-/////-//    17     20
General Process of
   Constructing a Frequency
            Table
— STEP   1: Determine the
               range.
 Range (R)= Highest Value – Lowest
                      Value
Example in data: 29,55,65,23,45,86,44
             Find Range
—  STEP
      2. Determine the tentative
 number of classes (k)

—  Note:
—  These classes   are usually specified in
    question.
—  The number of classes should be between 5
    and 20. The actual number of classes may
    be affected by convenience or other
    subjective factors.
— STEP 3.  Find the class width by
  dividing the range by the number
  of classes.
                                Range
class width or class mark =
                            number of classes
       R
⇔   c=
       k

             (Always round – off )
— STEP 4. Determine the
 frequency for each class by
 referring to the tally columns
 and present the results in a table.
When constructing frequency
tables, the following guidelines
should be followed.
—  The classes must be mutually
    exclusive. That is, each score
    must belong to exactly one
    class.
—  Include all classes, even if the
    frequency might be zero.
— Allclasses should have the
   same width, although it is
   sometimes impossible to avoid
   open – ended intervals such as
   “65 years or older”.
— The number of classes should
   be between 5 and 20.
Using Table:
— What is the lower class limit of
   the highest class? Upper class
   limit of the lowest class?
— Find the class mark of the class
   43 – 51.
— What is the frequency of the
   class 16 – 24?
SLOPE
SLOPE

Slope is a measure of
 steepness
Types of Slope

                      Zero

           Negative
Positive                     Undefined
                                or
                             No Slope
If given 2 points on
a line, you may find
the slope using the
formula m = y2 – y1
             x2 – x1
Find the slope of the
       line through the
   points (3,7) and (5, 19).
           x1 y1    x2 y2

m = 19 – 7   m = 12     m=6
    5–3          2
Find the slope
(3, 4) and (-6, -2)
If given an equation
  of a line, there are
   2 ways to find the
slope and y-intercept.
One method is to
write the equation in
slope-intercept form,
which is y = mx + b.
       slope
           y-intercept
Find the slope and
  y-intercept of the
following equations.
    y = 3x + ½
      slope= 3
   y-intercept = ½
3x + 5y = 10
First, solve the equation for y.
      3x + 5y = 10
      5y = -3x + 10
      y = -3/5 x + 2
 m= -3/5             b=2
Another method to
  find the slope if given
   an equation of a line
 is to write the equation
in the form Ax + By = C.

m = -A/B,      b = C/B
Find the slope and
  y-intercept of the
following equations.
     A    B     C
     8x + 11y = 7

m= -8/11    b = 7/11
-6x = 2y + 14
First, rewrite the equation in
    the form Ax + By = C.

     -6x - 2y = 14
m= 6/-2           b = 14/-2
m= -3              b = -7
If given the graph
    of a line, find the
  slope by using the
 “triangle” method to
find the rise over run.
rise = 4

           m= rise
               run
run = 5    m= 4/5
Feedback form
      MET’s Institute of Management, Bhujbal Knowledge City, Adgaon, Nashik
                                         
1. Name of the student:
2 . Graduation in:
3. Please tick whether you had learnt statistics in your
    graduation
     level: Yes  No

4. Please grade yourself according to you in which category
you lie in the knowledge of mathematics and statistics

1.Poor 2. Not good          3.Average           4.Good
       5.Excellent
5. Whether Induction on basics of Mathematics
   and Statistics was fruitful
     for you ? Yes / No
     If Yes then please state why?

6.  Do you need any change in the current
    teaching methodology adopted for statistics?

 7. Any suggestions related to the subject
statistics:
The
End
Frequency distribution

Frequency distribution

  • 1.
  • 2.
    Frequency Distribution —  Arepresentation, in a tabular format, which displays the number of observations within a given interval. The intervals must be mutually exclusive (each score must belong to exactly one class) and exhaustive (Including every possible element).
  • 3.
    Question — Howdo we constructa frequency distribution table?
  • 4.
    Let’s Try!!! — Agesof 50men randomly selected from a population who died in gunfire are given. Construct a frequency distribution table having 7 classes.
  • 5.
    19 18 30 40 41 33 73 25 23 25 21 33 65 17 20 76 47 69 20 31 18 24 35 24 17 36 65 70 22 25 65 16 24 29 42 37 26 46 27 63 21 27 23 25 71 37 75 25 27 23
  • 6.
    Determine the range. R= Highest Value – Lowest Value R = 76 – 16 = 60
  • 7.
    —  Find the class width (c). Range R class width = ⇔ c= number of classes k 60 c = = 8.57 = 9 7
  • 8.
    Write the classesstarting with lowest score. Classes Tally Marks Freq. 70 – 78 61 – 69 52 – 60 43 – 51 34 – 42 25 – 33 16 – 24
  • 9.
    Classes Class Tally Marks Freq. x boundaries 70 – 78 69.5 – 78.5 ///// 5 74 61 – 69 60.5 – 69.5 ///// 5 65 52 – 60 51.5 – 60.5 0 56 43 – 51 42.5 – 51.5 // 2 47 34 – 42 33.5 – 42.5 /////-// 7 38 25 – 33 24.5 – 33.5 /////-/////-//// 14 29 16 – 24 15.5 – 24.5 /////-/////-/////-// 17 20
  • 10.
    General Process of Constructing a Frequency Table — STEP 1: Determine the range. Range (R)= Highest Value – Lowest Value Example in data: 29,55,65,23,45,86,44 Find Range
  • 11.
    —  STEP 2. Determine the tentative number of classes (k) —  Note: —  These classes are usually specified in question. —  The number of classes should be between 5 and 20. The actual number of classes may be affected by convenience or other subjective factors.
  • 12.
    — STEP 3. Find the class width by dividing the range by the number of classes. Range class width or class mark = number of classes R ⇔ c= k (Always round – off )
  • 13.
    — STEP 4. Determinethe frequency for each class by referring to the tally columns and present the results in a table.
  • 14.
    When constructing frequency tables,the following guidelines should be followed. —  The classes must be mutually exclusive. That is, each score must belong to exactly one class. —  Include all classes, even if the frequency might be zero.
  • 15.
    — Allclasses should havethe same width, although it is sometimes impossible to avoid open – ended intervals such as “65 years or older”. — The number of classes should be between 5 and 20.
  • 16.
    Using Table: — What isthe lower class limit of the highest class? Upper class limit of the lowest class? — Find the class mark of the class 43 – 51. — What is the frequency of the class 16 – 24?
  • 17.
  • 18.
    SLOPE Slope is ameasure of steepness
  • 19.
    Types of Slope Zero Negative Positive Undefined or No Slope
  • 20.
    If given 2points on a line, you may find the slope using the formula m = y2 – y1 x2 – x1
  • 21.
    Find the slopeof the line through the points (3,7) and (5, 19). x1 y1 x2 y2 m = 19 – 7 m = 12 m=6 5–3 2
  • 22.
    Find the slope (3,4) and (-6, -2)
  • 23.
    If given anequation of a line, there are 2 ways to find the slope and y-intercept.
  • 24.
    One method isto write the equation in slope-intercept form, which is y = mx + b. slope y-intercept
  • 25.
    Find the slopeand y-intercept of the following equations. y = 3x + ½ slope= 3 y-intercept = ½
  • 26.
    3x + 5y= 10 First, solve the equation for y. 3x + 5y = 10 5y = -3x + 10 y = -3/5 x + 2 m= -3/5 b=2
  • 27.
    Another method to find the slope if given an equation of a line is to write the equation in the form Ax + By = C. m = -A/B, b = C/B
  • 28.
    Find the slopeand y-intercept of the following equations. A B C 8x + 11y = 7 m= -8/11 b = 7/11
  • 29.
    -6x = 2y+ 14 First, rewrite the equation in the form Ax + By = C. -6x - 2y = 14 m= 6/-2 b = 14/-2 m= -3 b = -7
  • 30.
    If given thegraph of a line, find the slope by using the “triangle” method to find the rise over run.
  • 31.
    rise = 4 m= rise run run = 5 m= 4/5
  • 32.
    Feedback form MET’s Institute of Management, Bhujbal Knowledge City, Adgaon, Nashik   1. Name of the student: 2 . Graduation in: 3. Please tick whether you had learnt statistics in your graduation level: Yes No 4. Please grade yourself according to you in which category you lie in the knowledge of mathematics and statistics 1.Poor 2. Not good 3.Average 4.Good 5.Excellent
  • 33.
    5. Whether Induction onbasics of Mathematics and Statistics was fruitful for you ? Yes / No If Yes then please state why? 6.  Do you need any change in the current teaching methodology adopted for statistics? 7. Any suggestions related to the subject statistics:
  • 34.