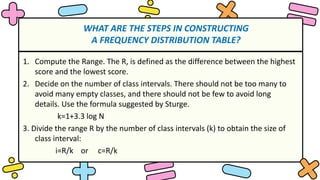
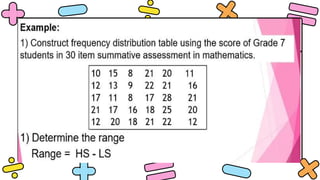
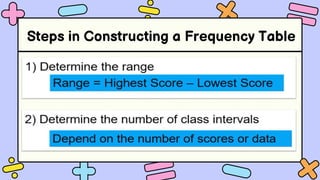
The steps to construct a frequency distribution table are:
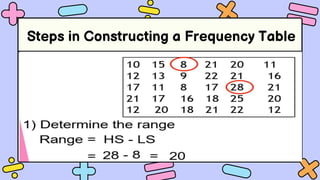
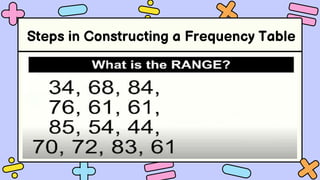
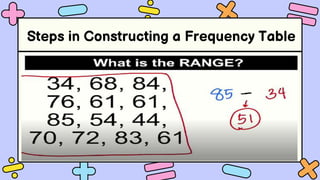
1. Determine the range of data and number of class intervals using Sturge's formula.
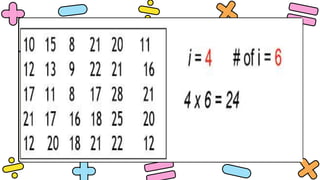
2. Calculate the class interval size by dividing the range by the number of intervals.
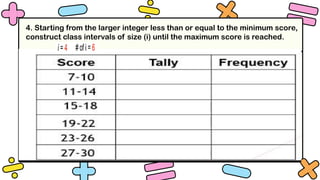
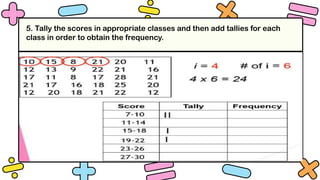
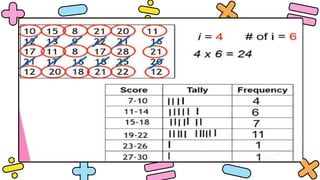
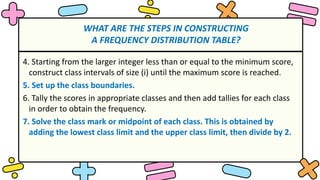
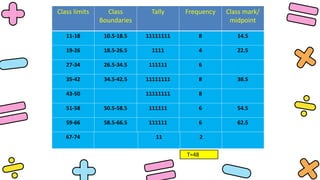
3. Establish the class boundaries and tally frequencies within each class.
4. Calculate the class mark or midpoint of each class.
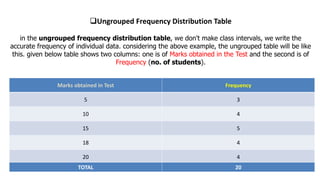
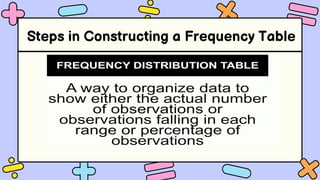
The key steps are to determine the number of class intervals, calculate the class interval size, tally frequencies within classes, and compute class marks. This process organizes a data set into a table to visualize frequency distributions.


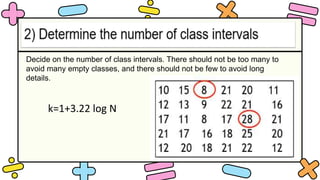
![k=(1+3.22 log N)
=[1+3.22(1.47712125]
=1+4. 87450014
k=5.874 or 6
N= NO. OF DATA
N=30](https://image.slidesharecdn.com/toupload-stepsinconstructingafrequencydistributiontable-copy-230624015205-bc82a1fc/85/Steps-in-Constructing-a-Frequency-Distribution-Table-pptx-13-320.jpg)


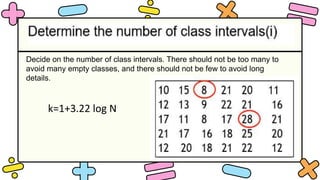
![k=(1+3.22 log N)
=[1+3.22(1.47712125]
=1+4.75633044
k=5.756 or 6
N= NO. OF DATA
N=30](https://image.slidesharecdn.com/toupload-stepsinconstructingafrequencydistributiontable-copy-230624015205-bc82a1fc/85/Steps-in-Constructing-a-Frequency-Distribution-Table-pptx-18-320.jpg)

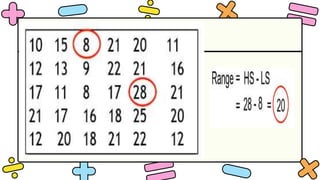
![Step 1:
Range = 28-8= 20
Step 2
k=(1+3.22 log N)
=[1+3.22(1.47712125]
=1+4.75633044
k=5.756 or 6
Step 3:
i = Range / k
= 20 / 6
= 3.33 or 4](https://image.slidesharecdn.com/toupload-stepsinconstructingafrequencydistributiontable-copy-230624015205-bc82a1fc/85/Steps-in-Constructing-a-Frequency-Distribution-Table-pptx-20-320.jpg)