Downloaded 184 times
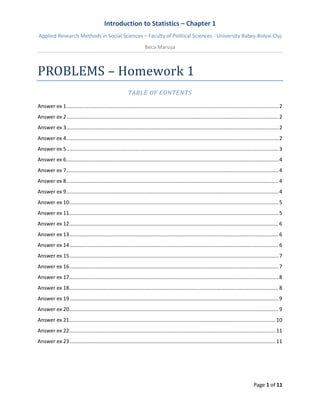

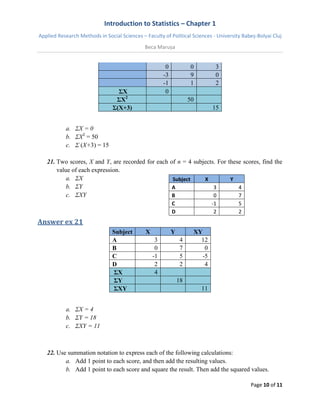
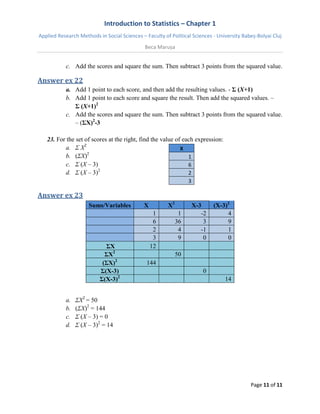

This document appears to be a chapter from a textbook on statistics that includes sample problems and answers. It provides the table of contents for homework problems 1-23 from Chapter 1 on introduction to statistics. The problems cover topics like identifying independent and dependent variables, distinguishing between experimental and non-experimental research studies, different types of variables, and computing statistical expressions. The document serves as a reference for students to review examples and solutions to common introductory statistics problems.


![Norms[1]](https://cdn.slidesharecdn.com/ss_thumbnails/norms1-110821093015-phpapp01-thumbnail.jpg?width=640&height=640&fit=bounds)