Downloaded 106 times


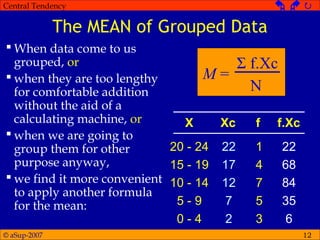
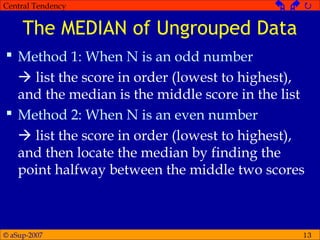
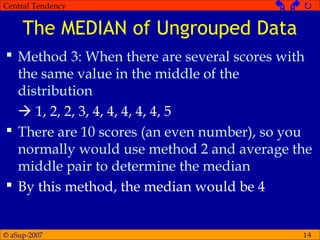
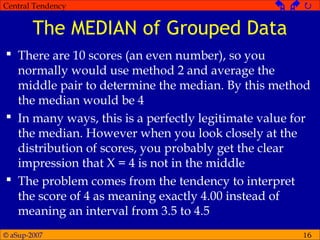
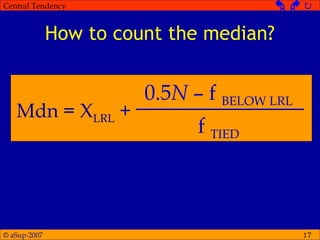


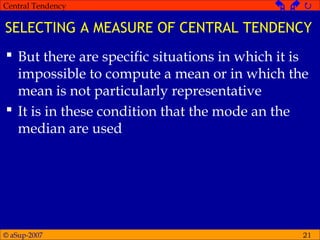
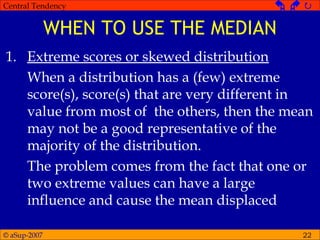


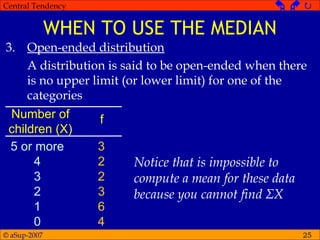

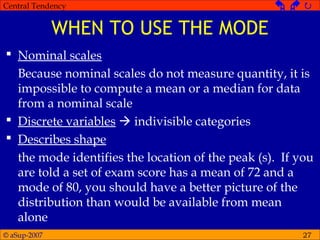


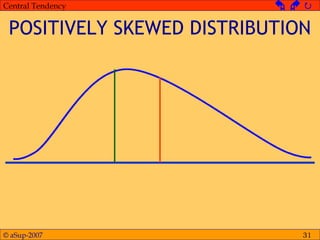
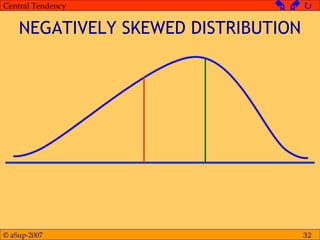

This document discusses different measures of central tendency including the mean, median, and mode. It provides definitions and examples of how to calculate each measure. The mean is the average and is calculated by adding all values and dividing by the total number. The median is the middle value when values are arranged from lowest to highest. The mode is the most frequent value. The appropriate measure depends on the type of data and distribution. The mean is generally preferred but the median is better for skewed or open-ended distributions.


