Downloaded 726 times
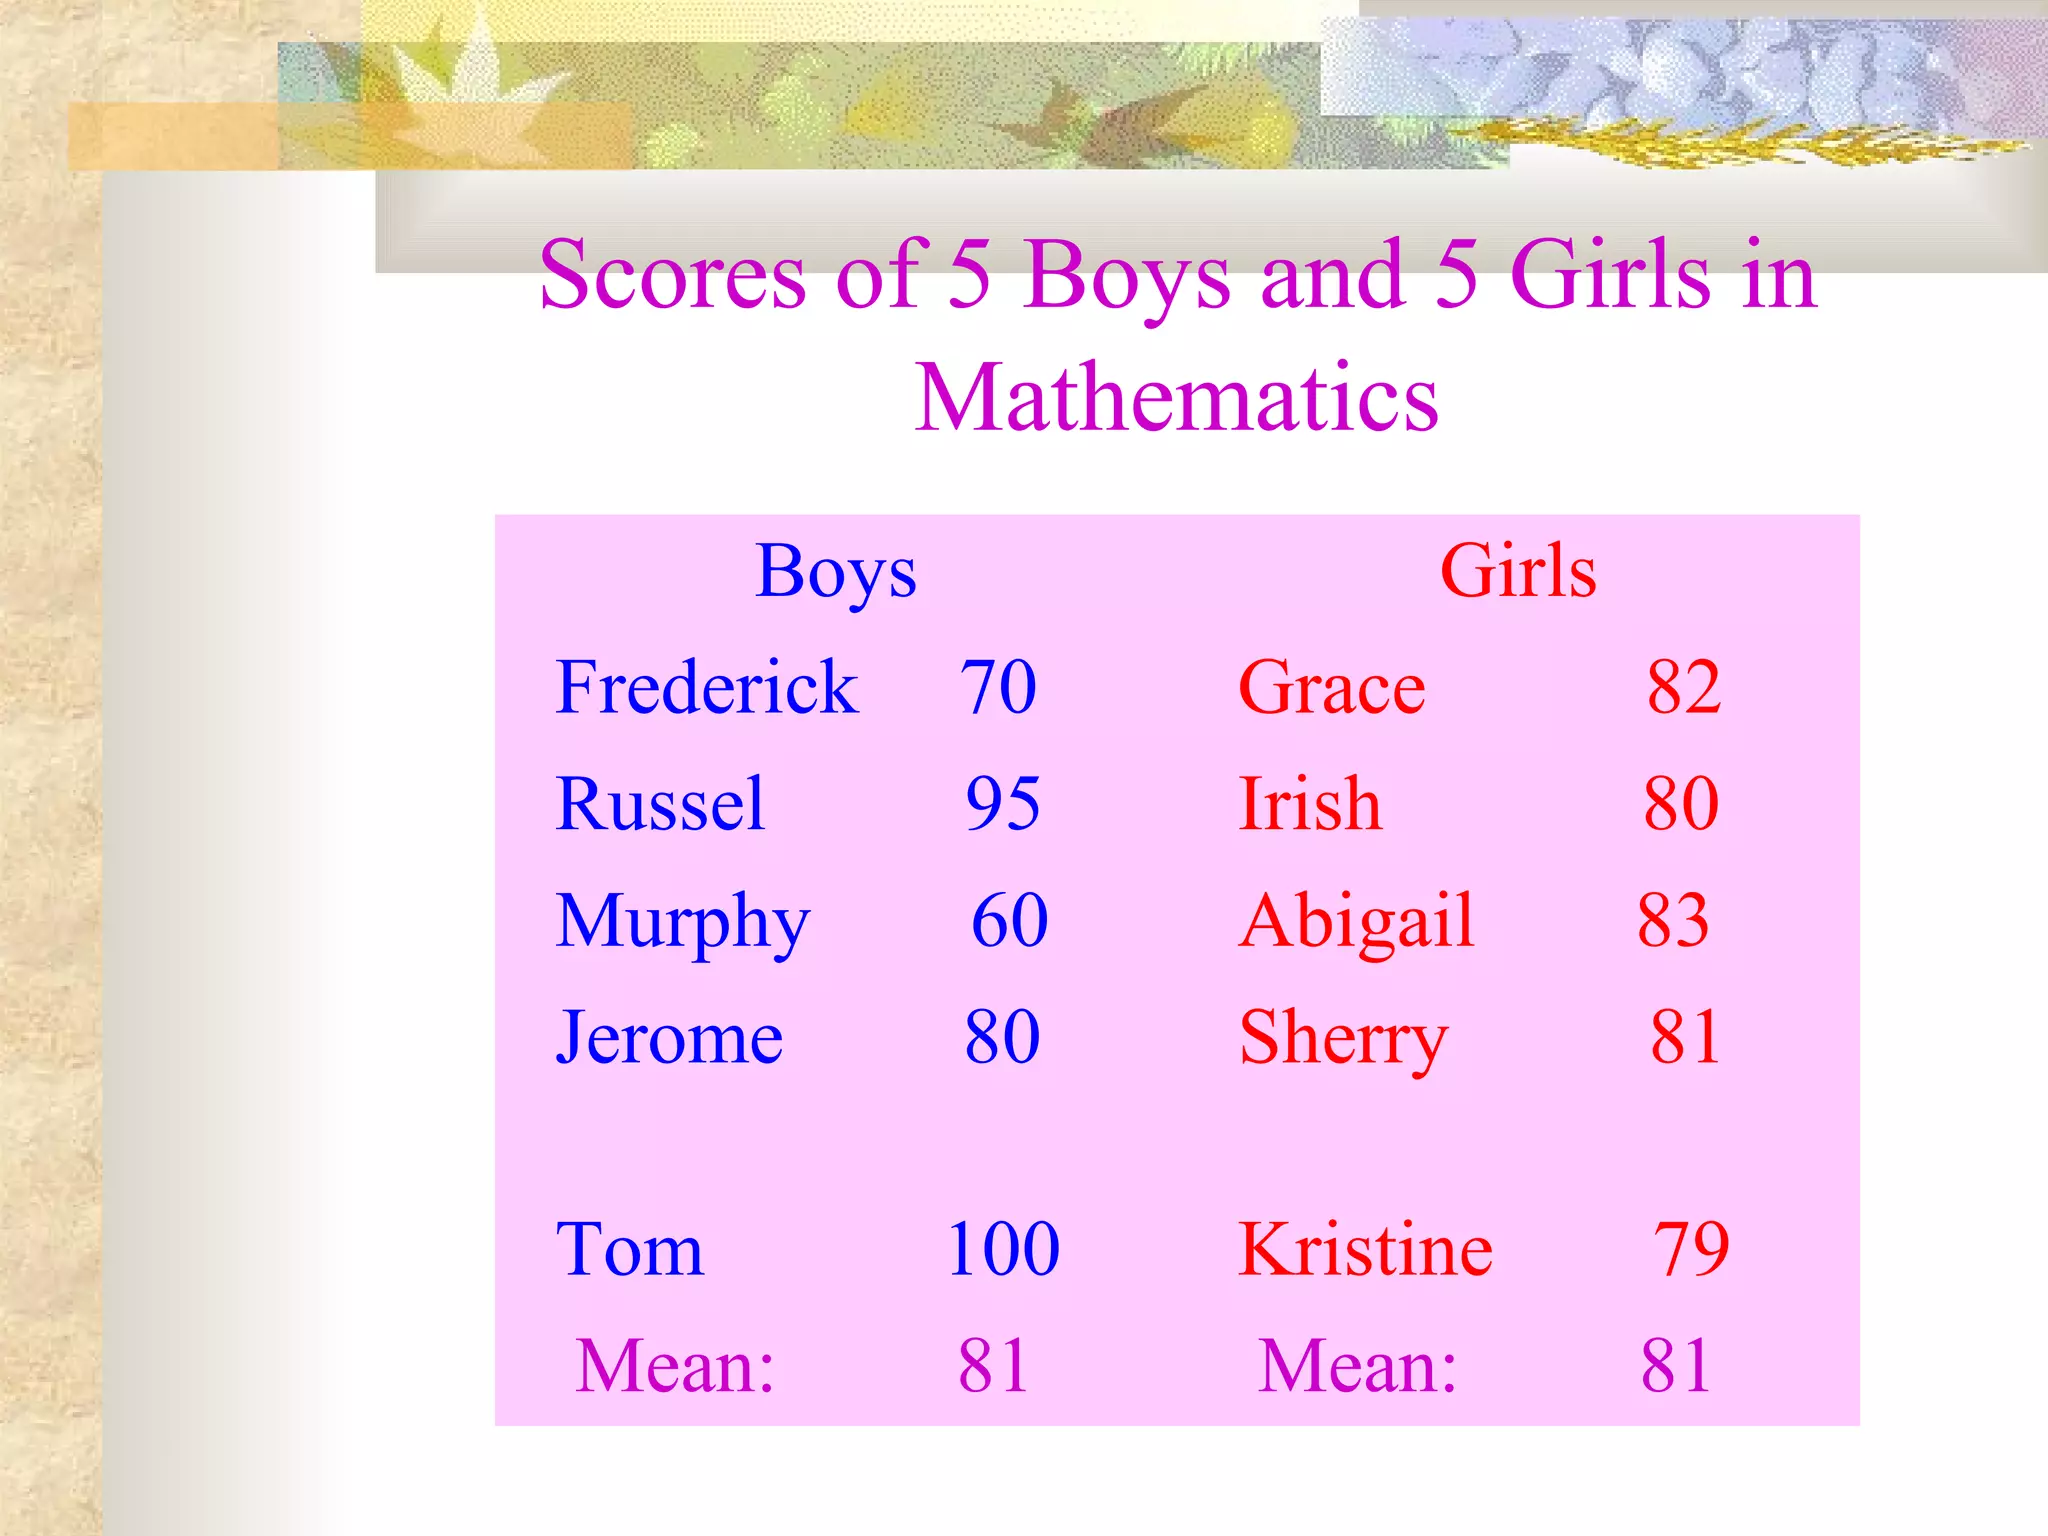
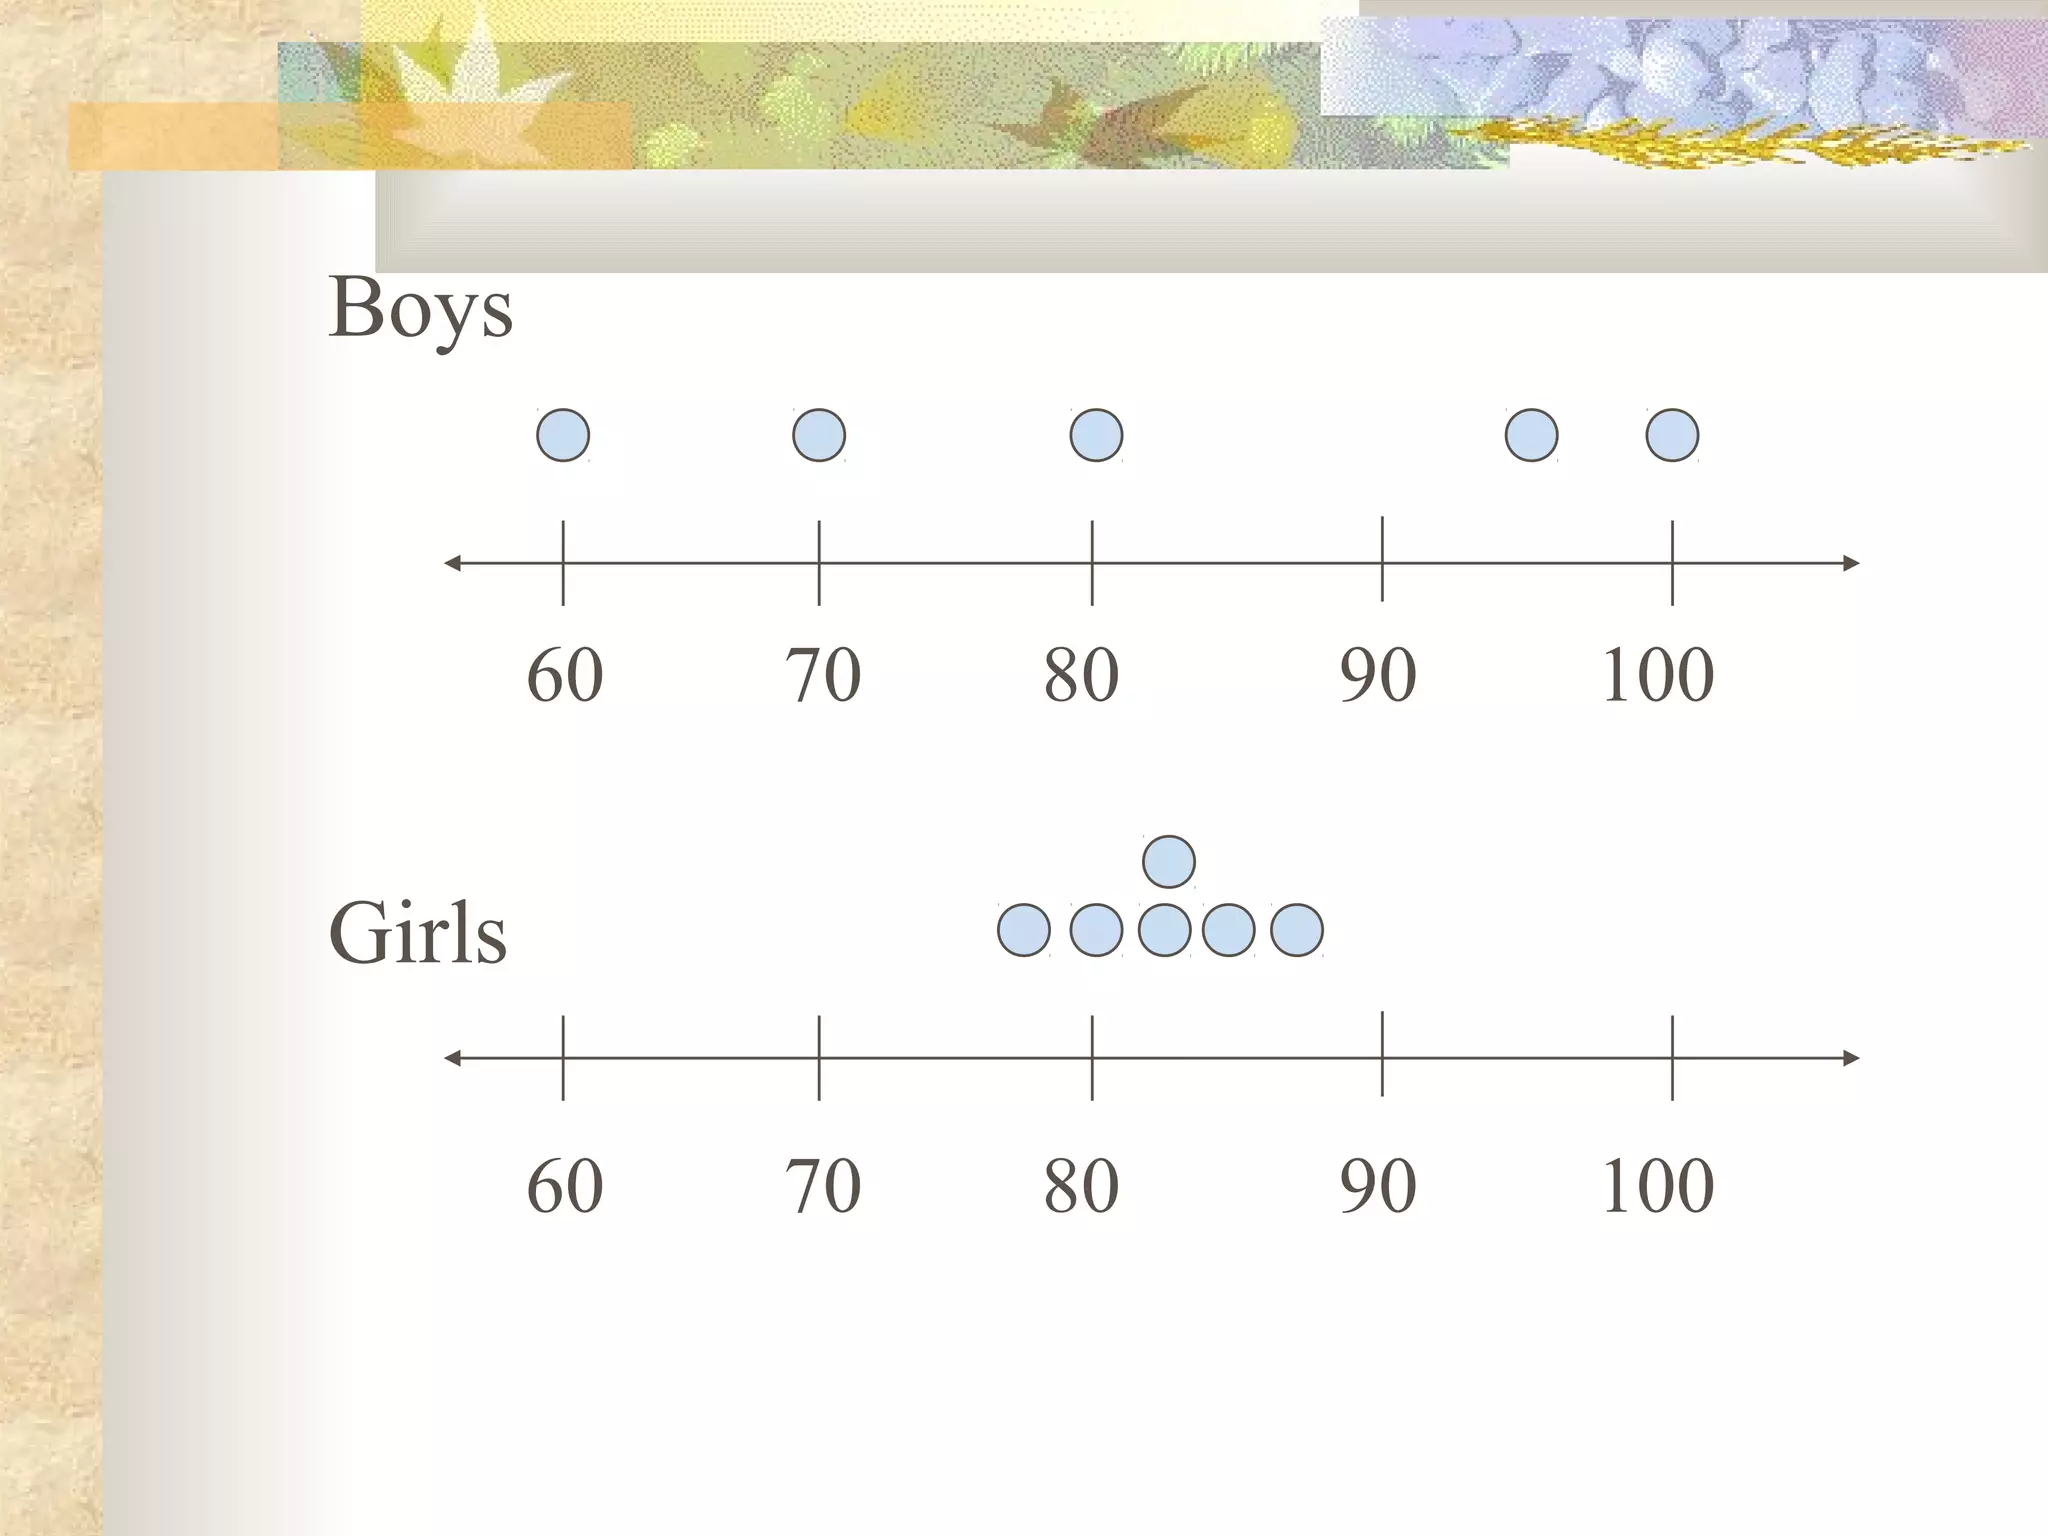
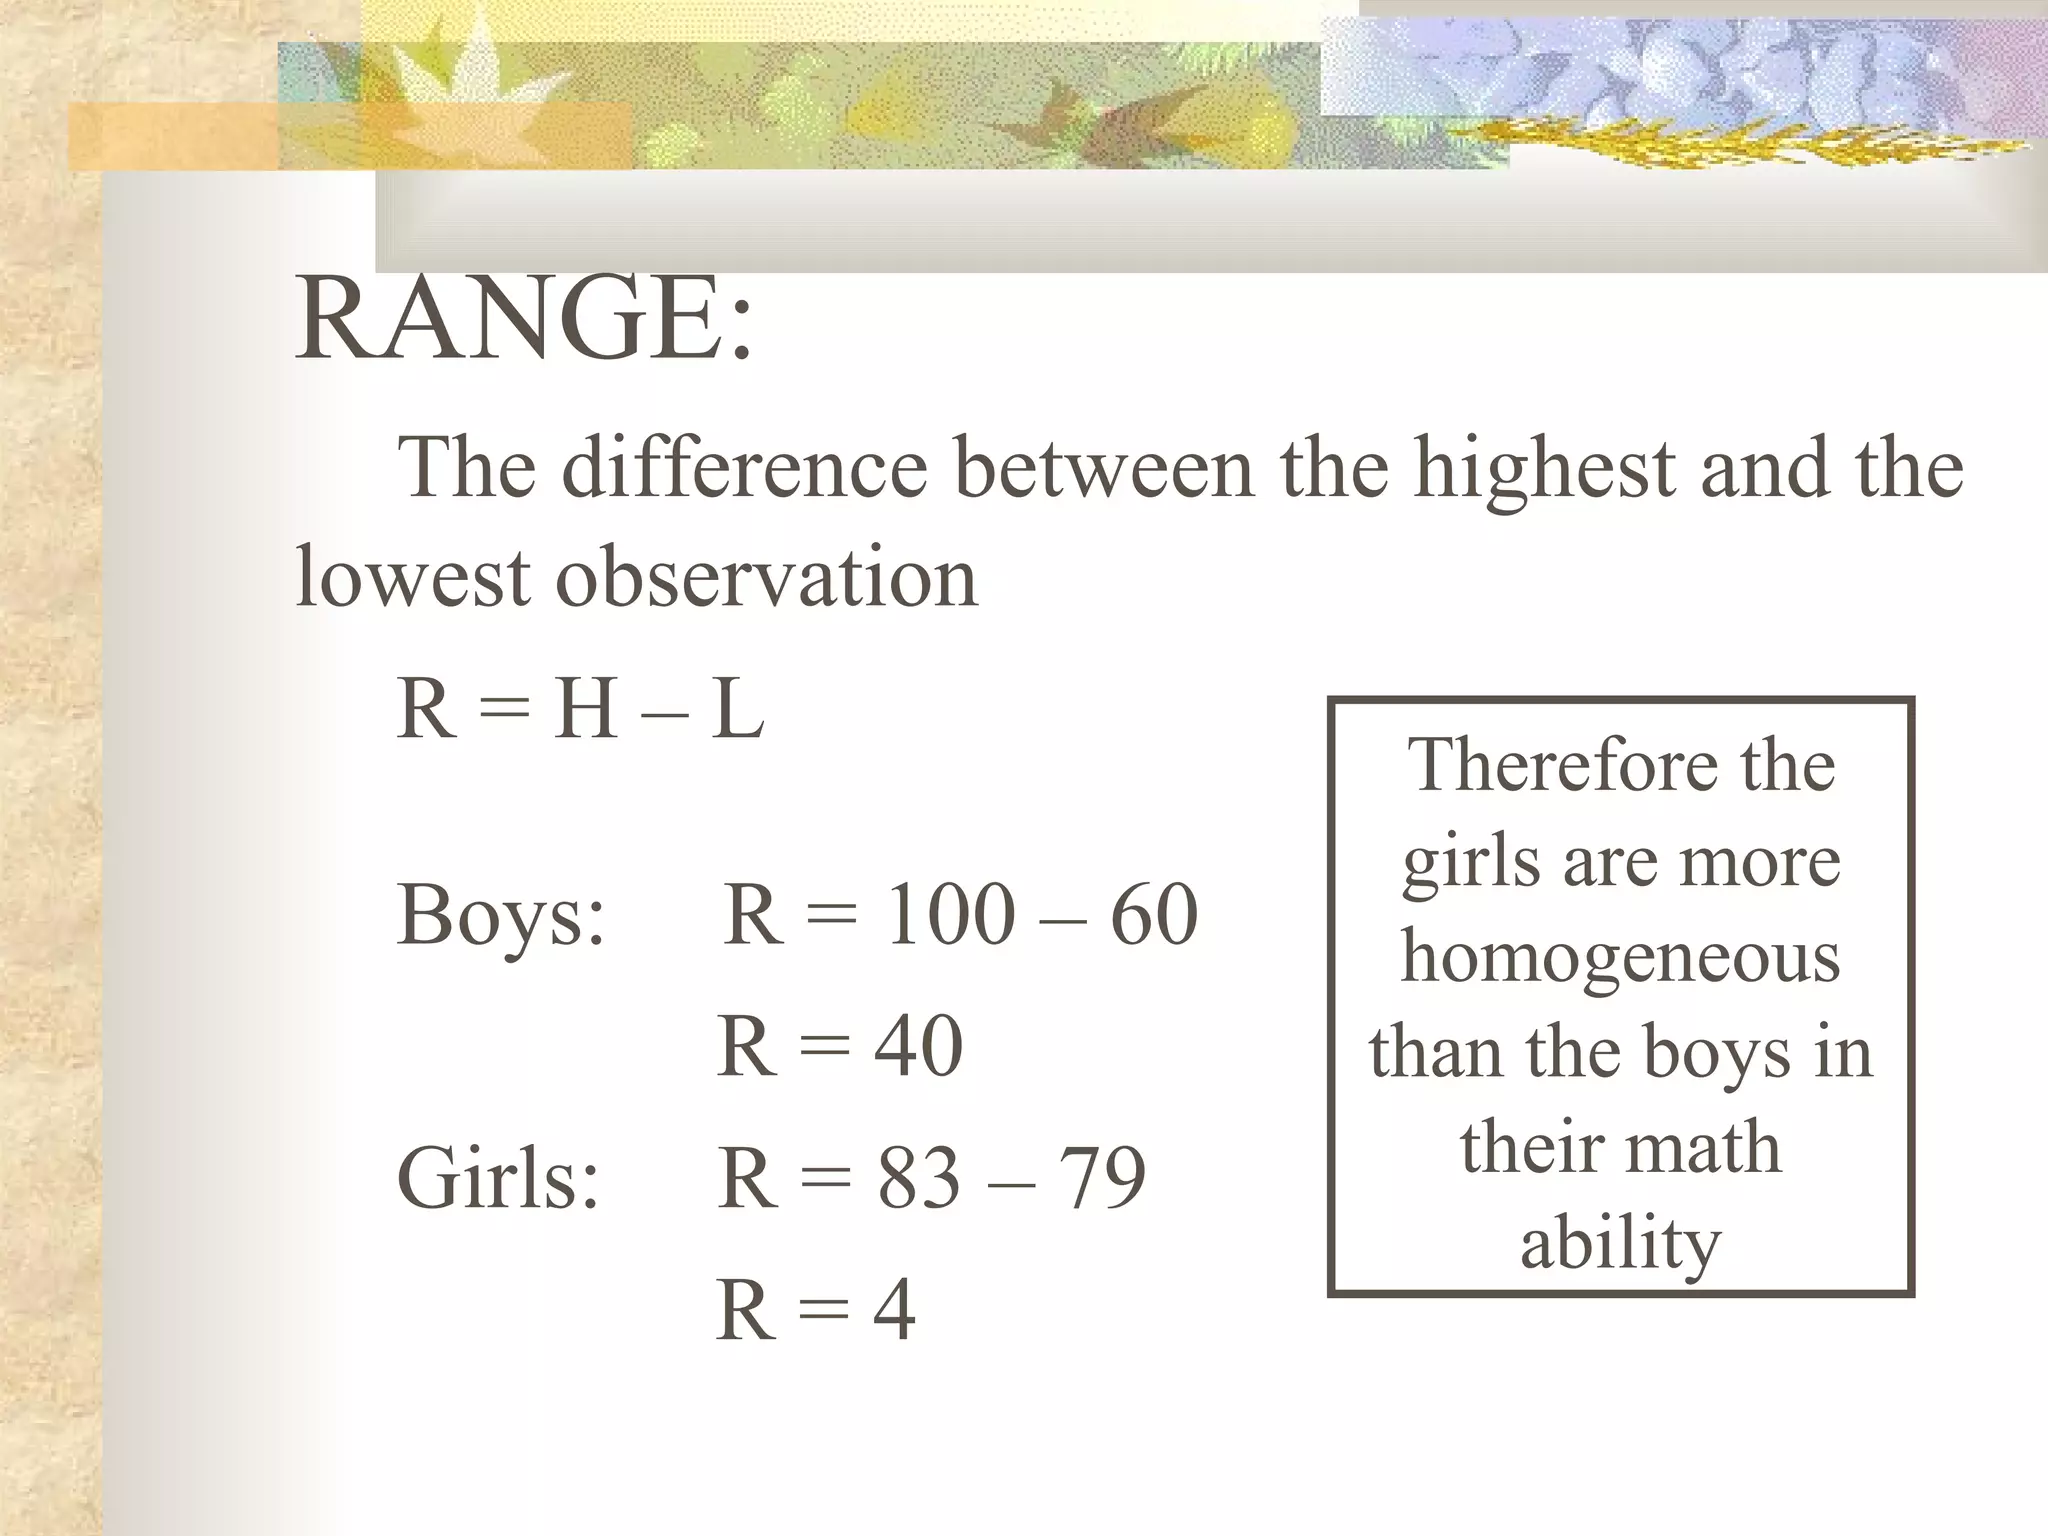
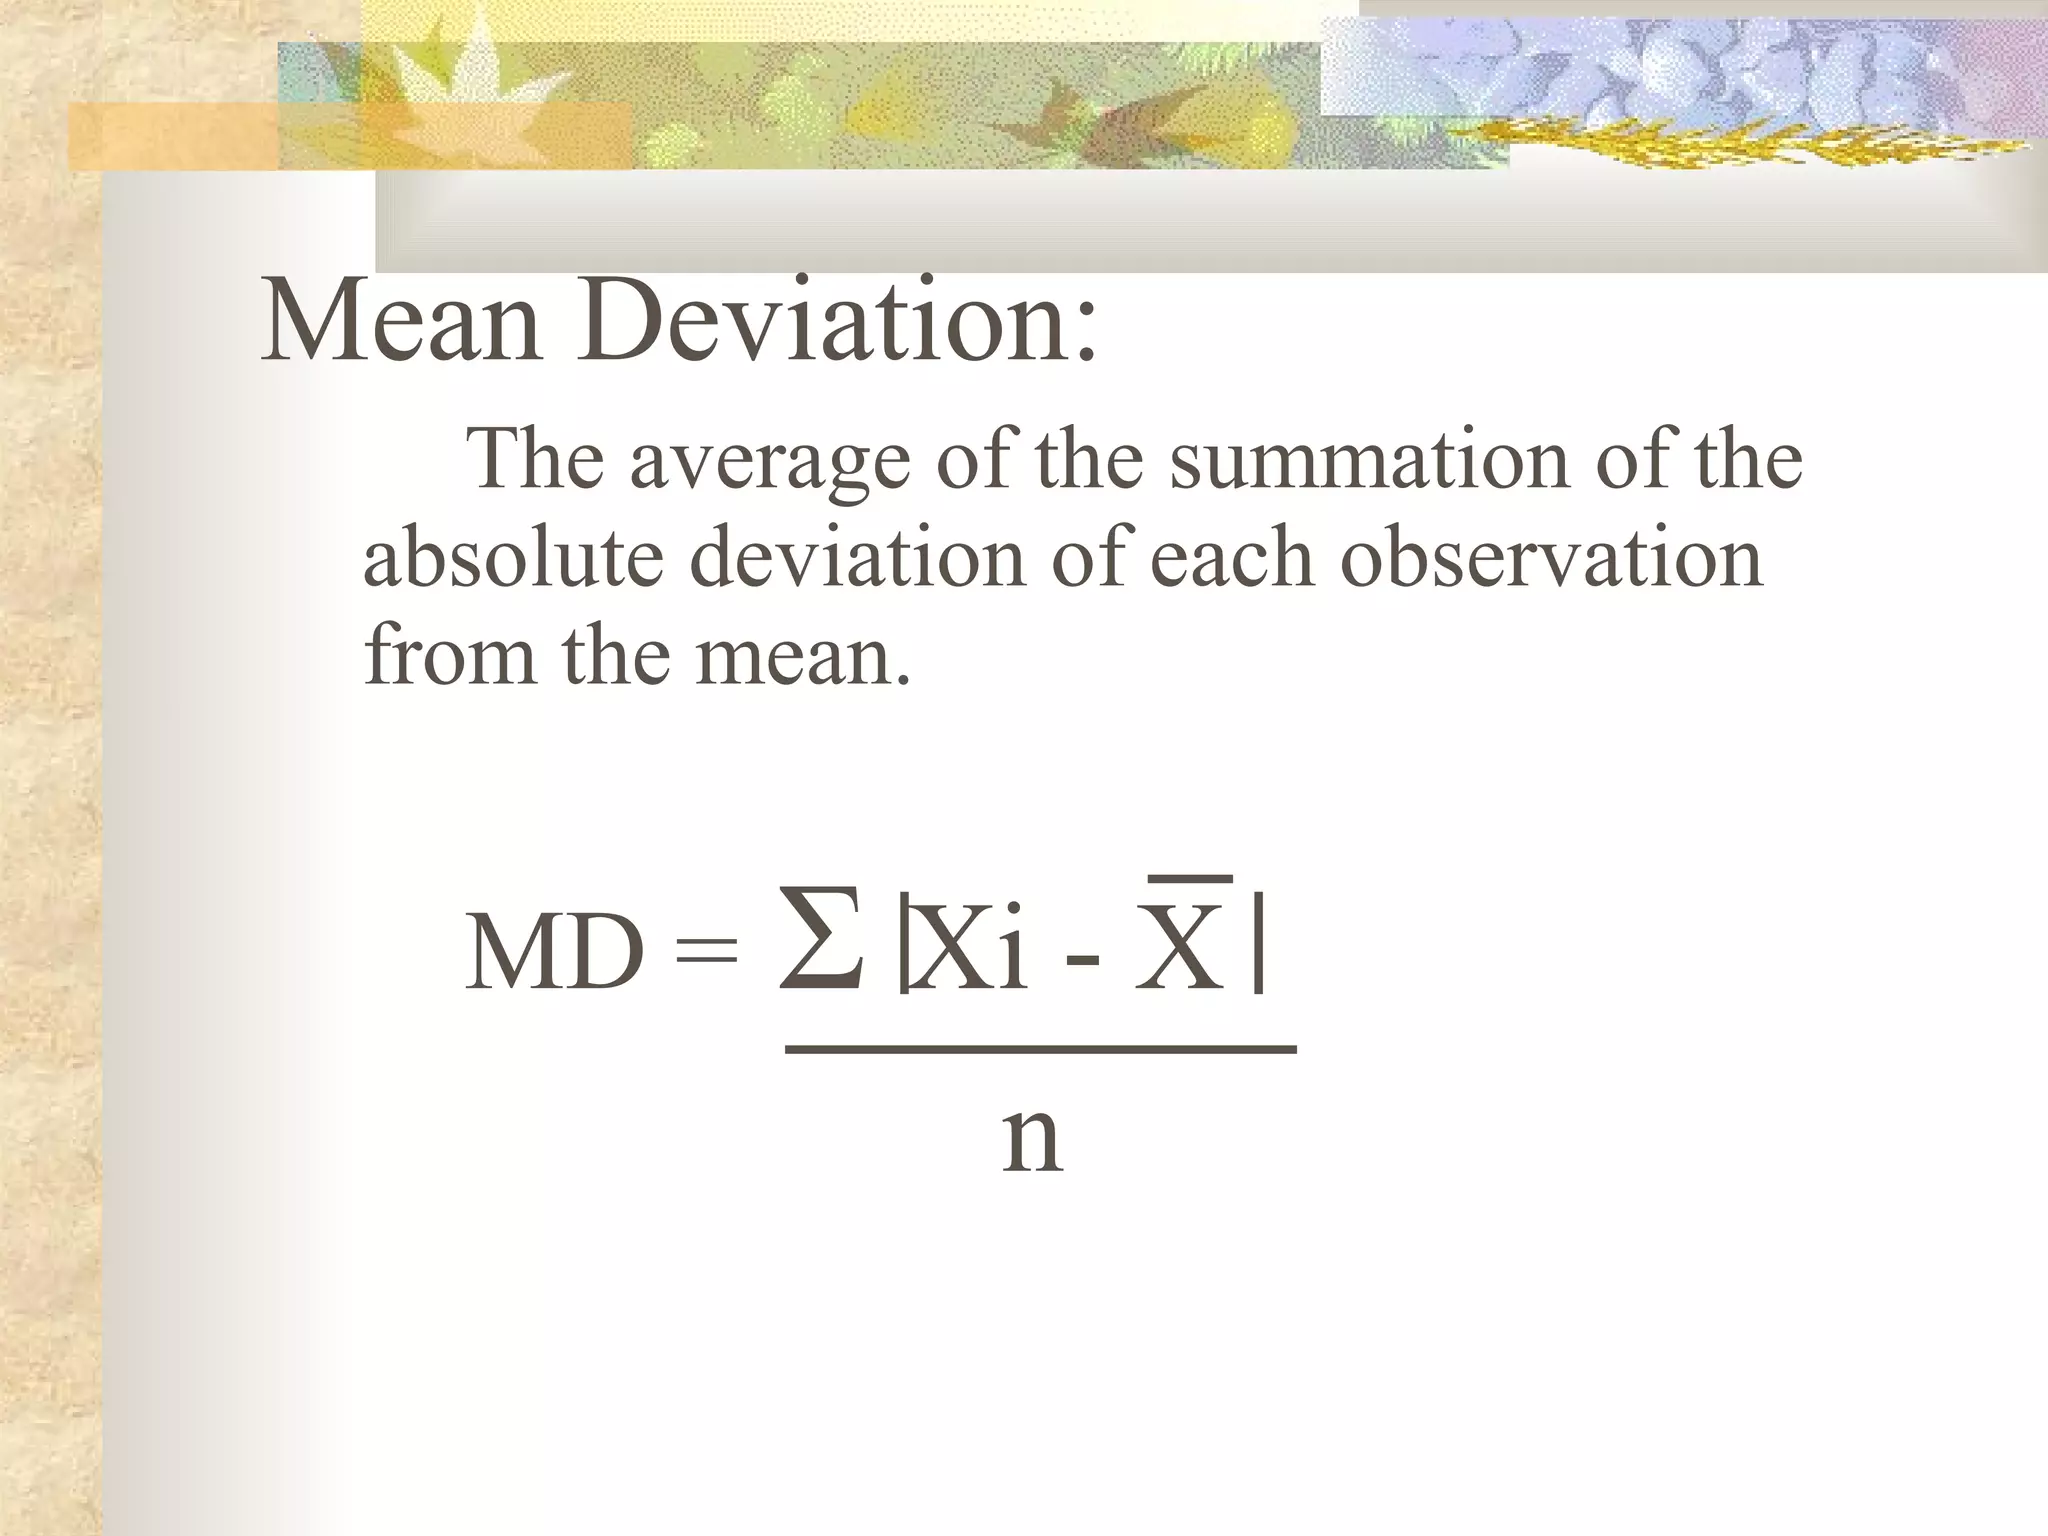
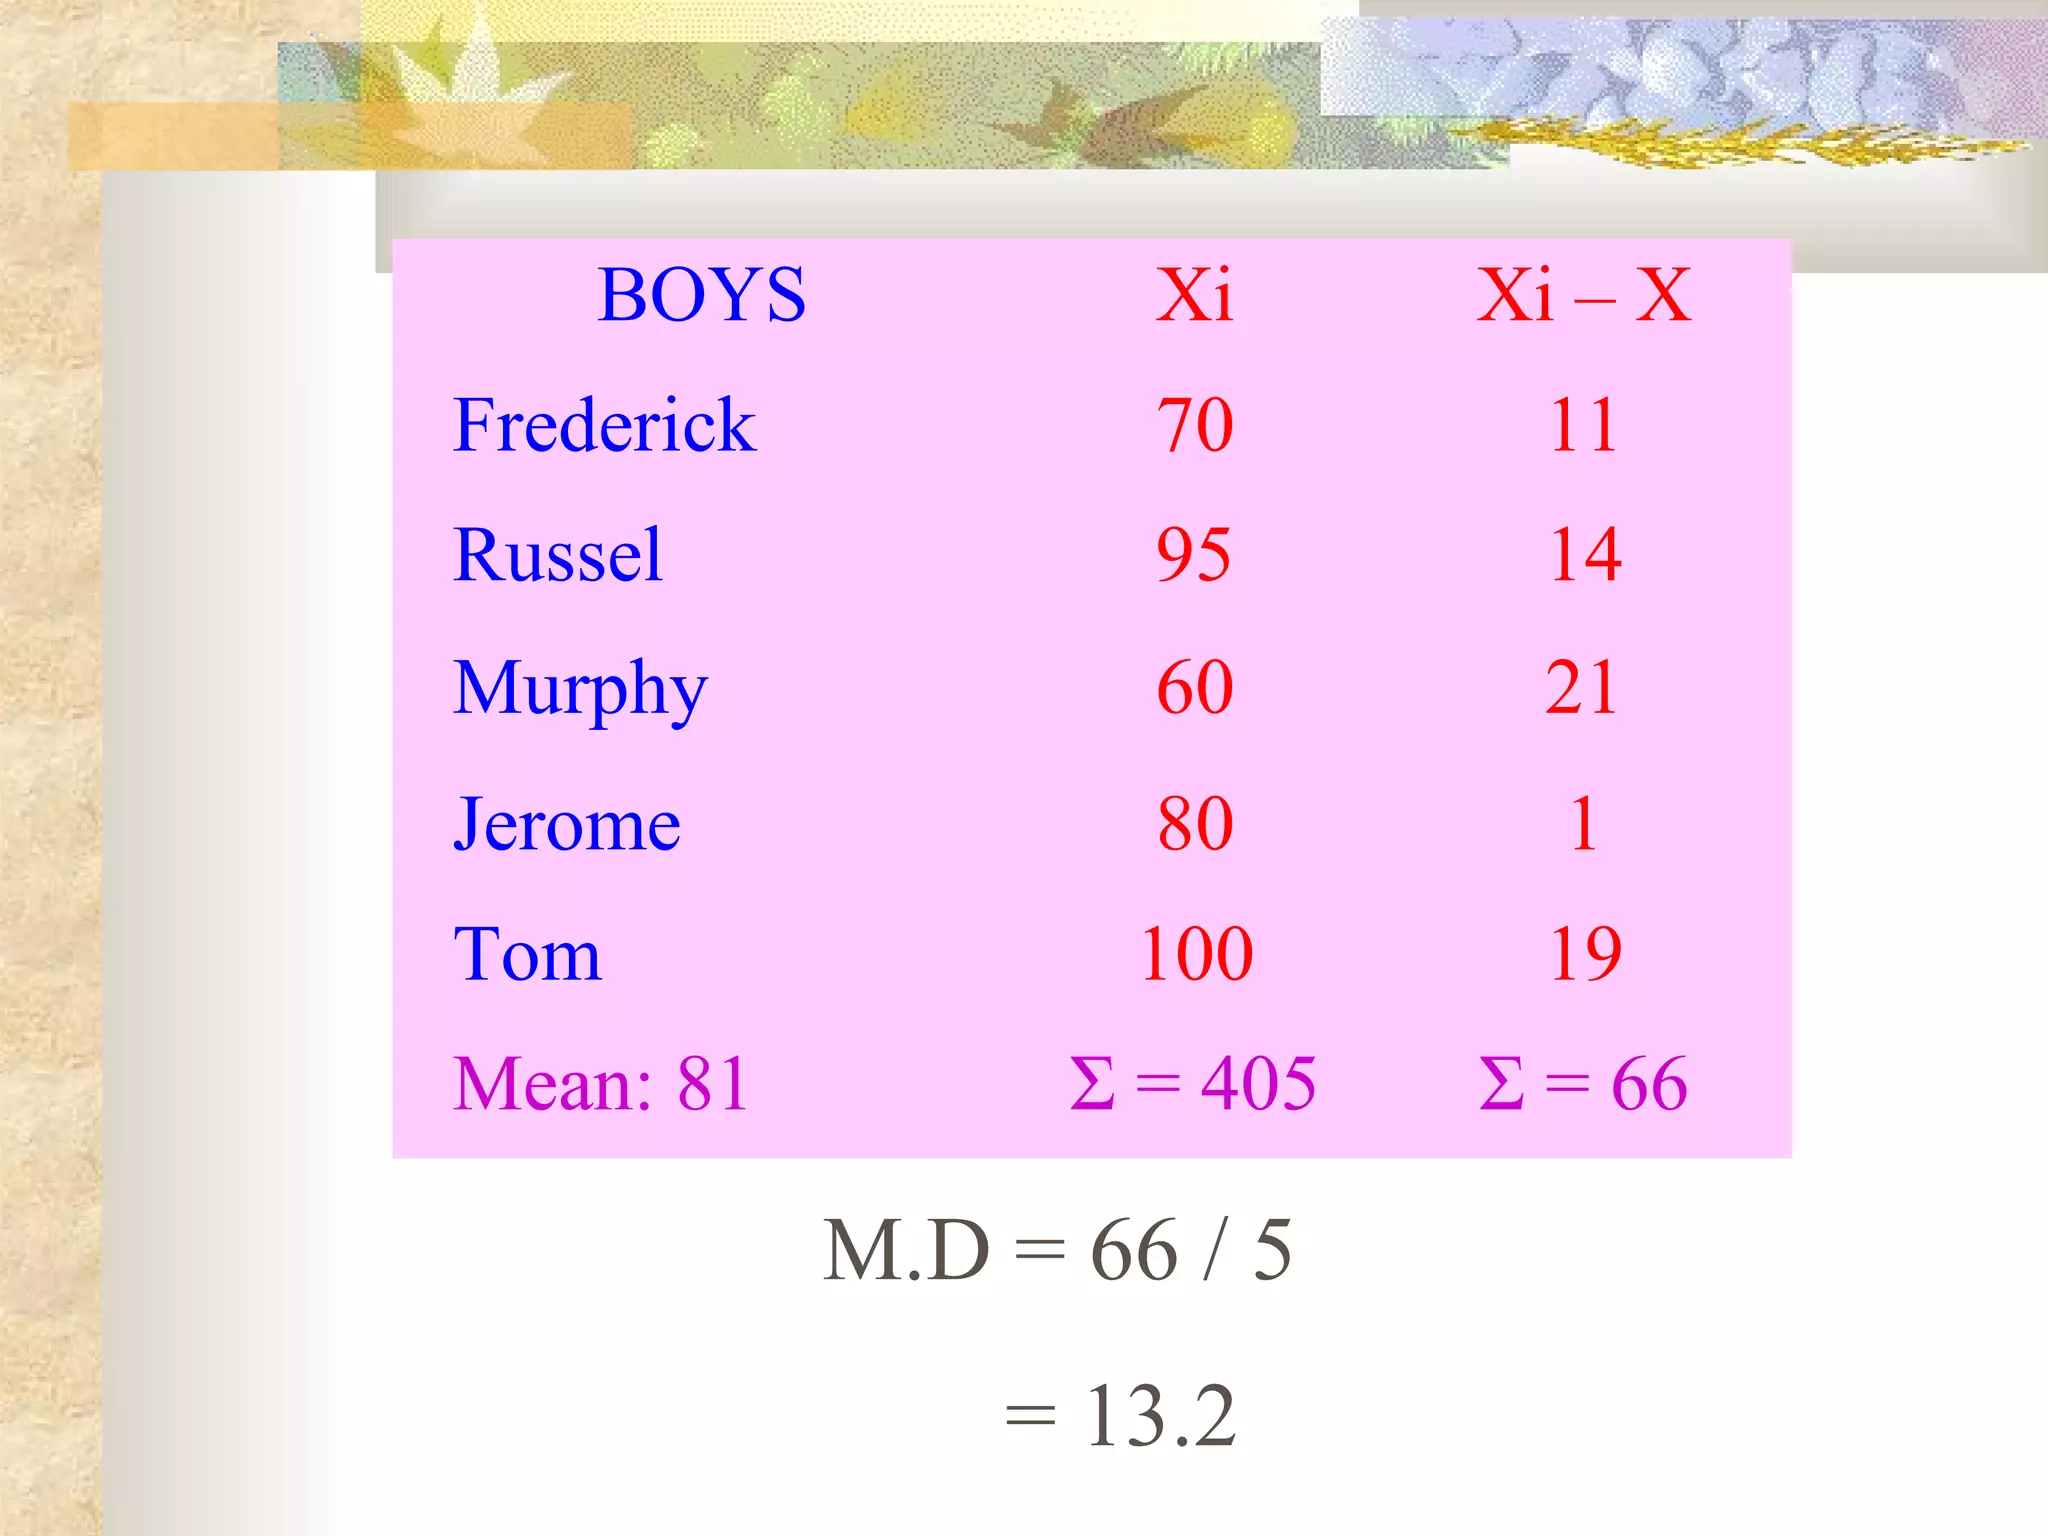
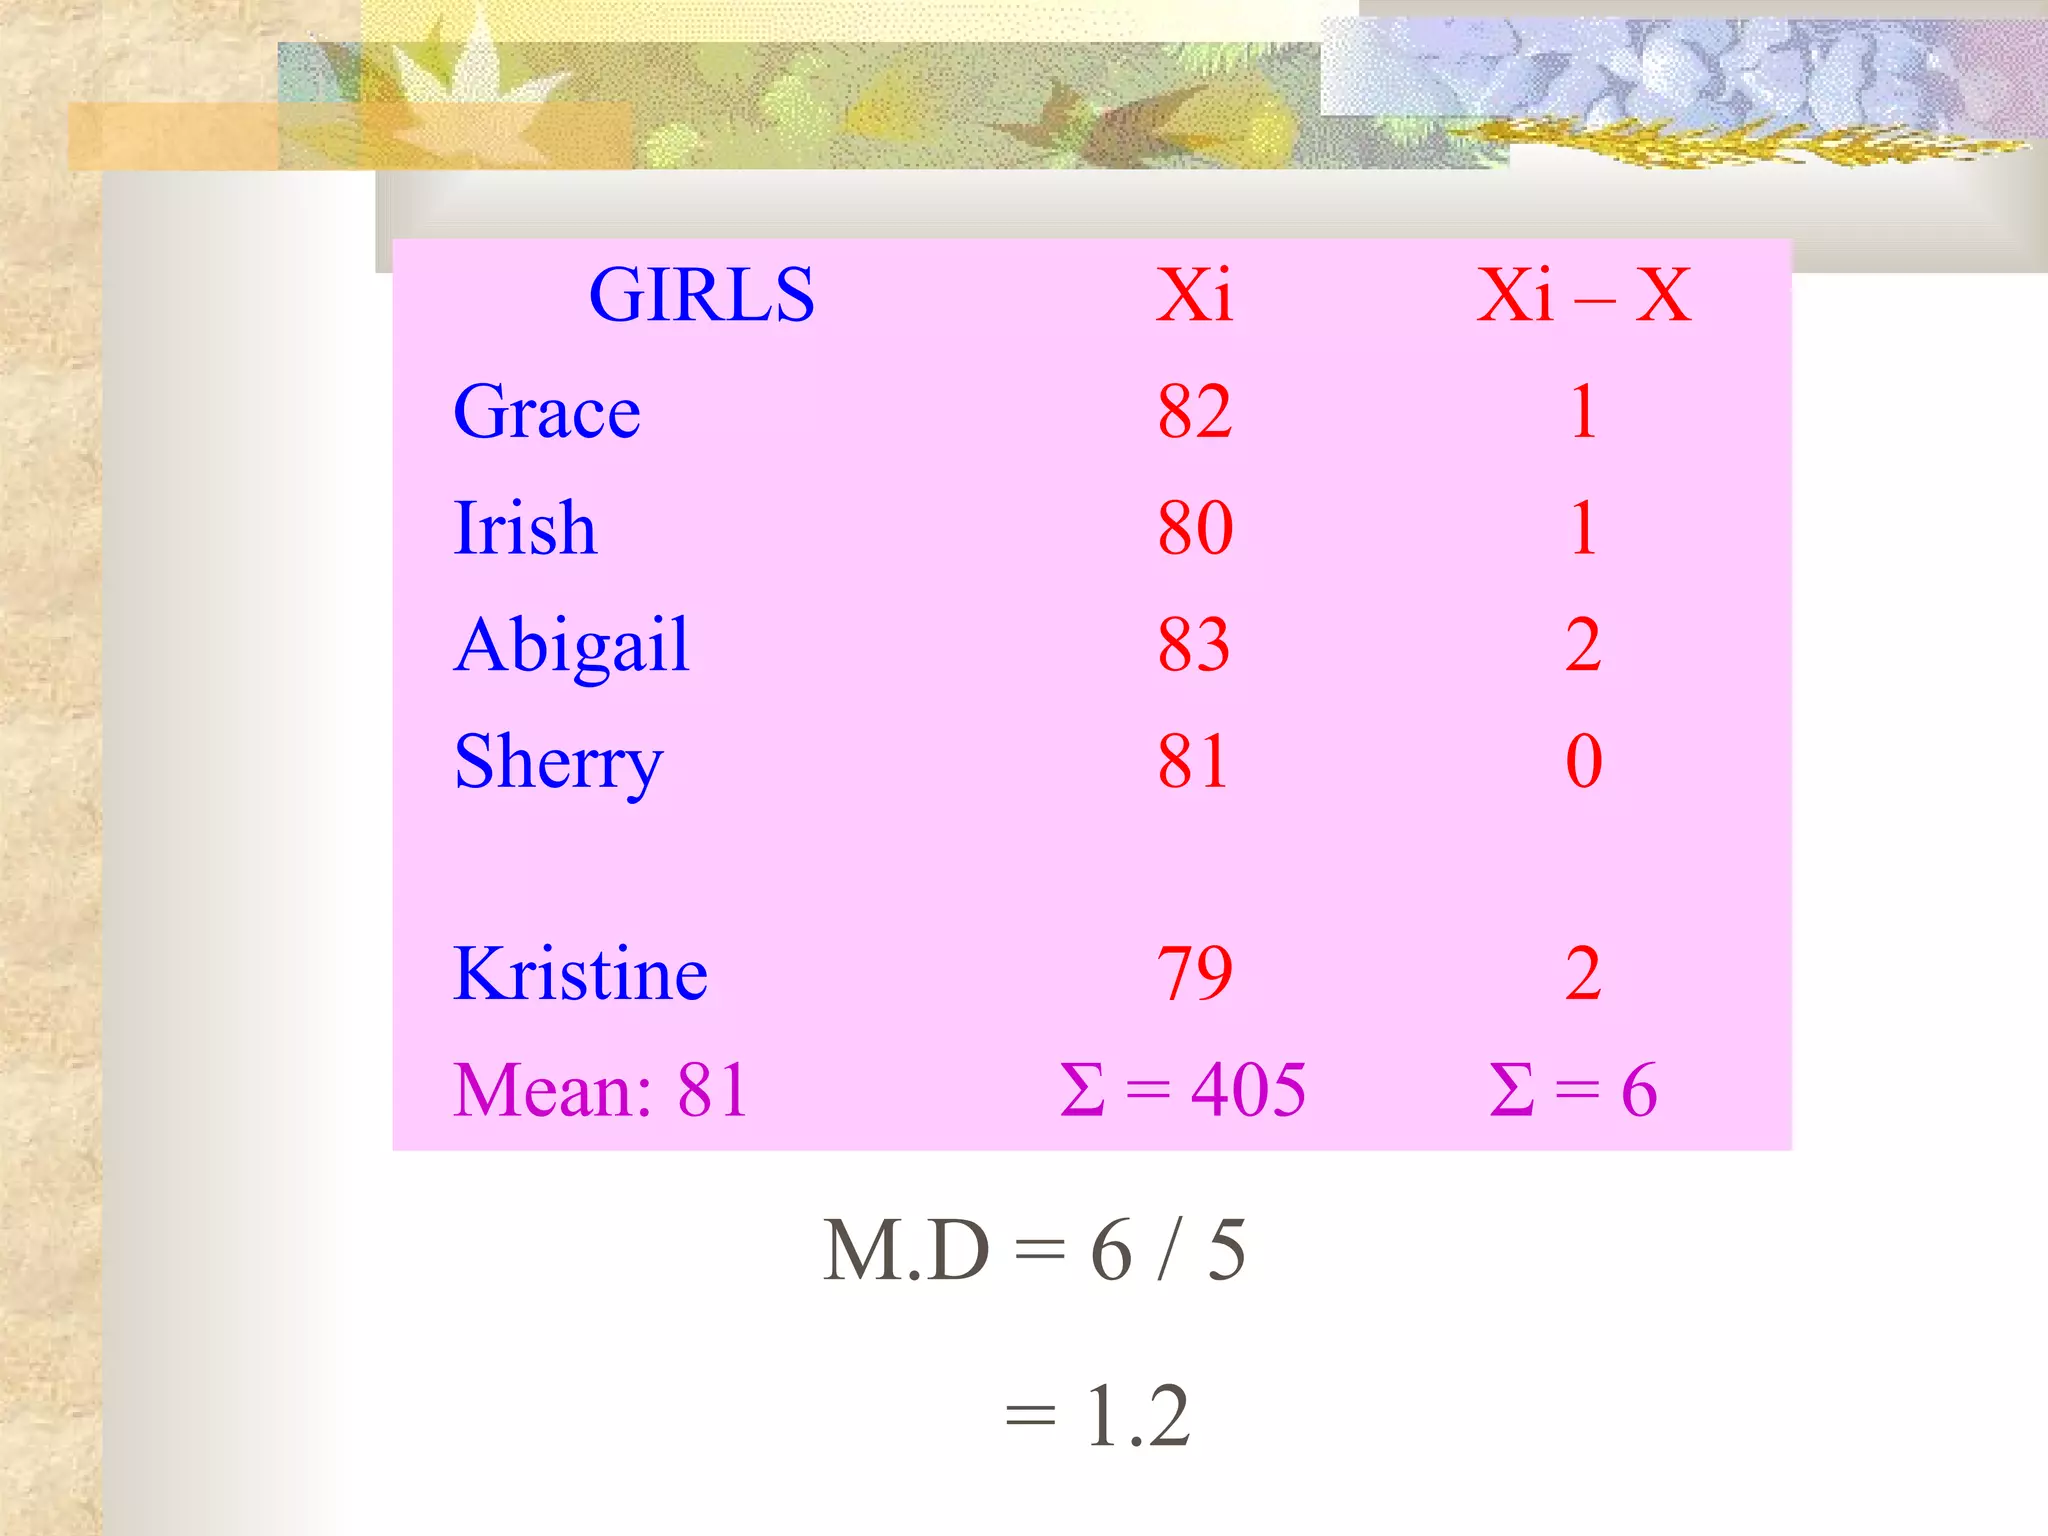
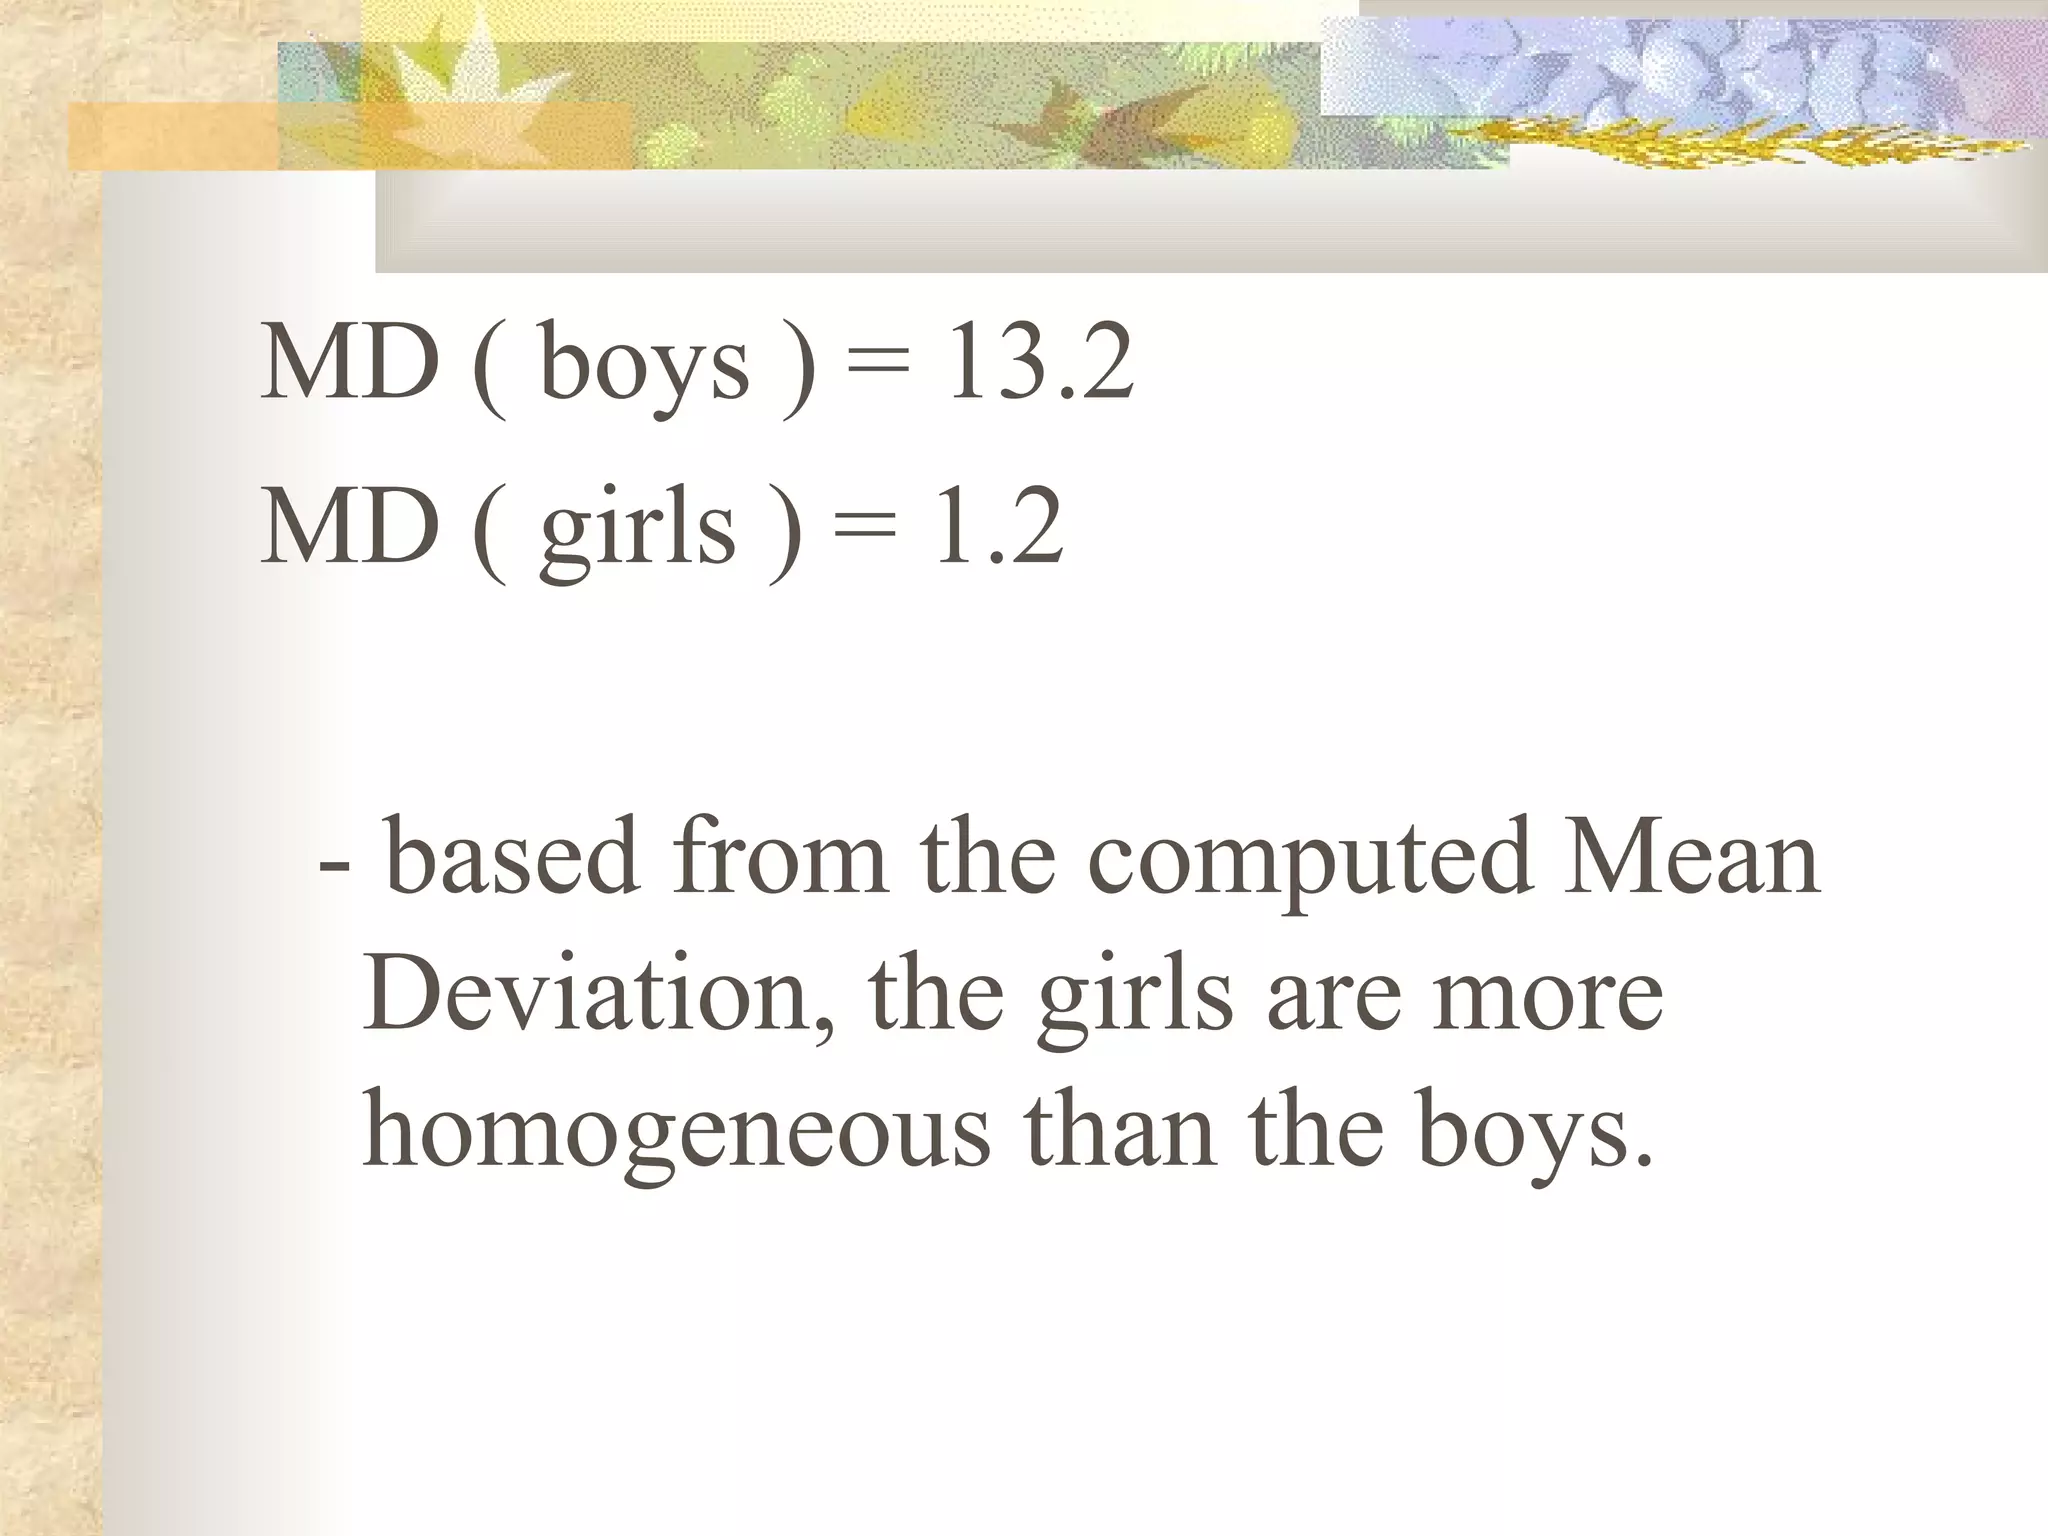
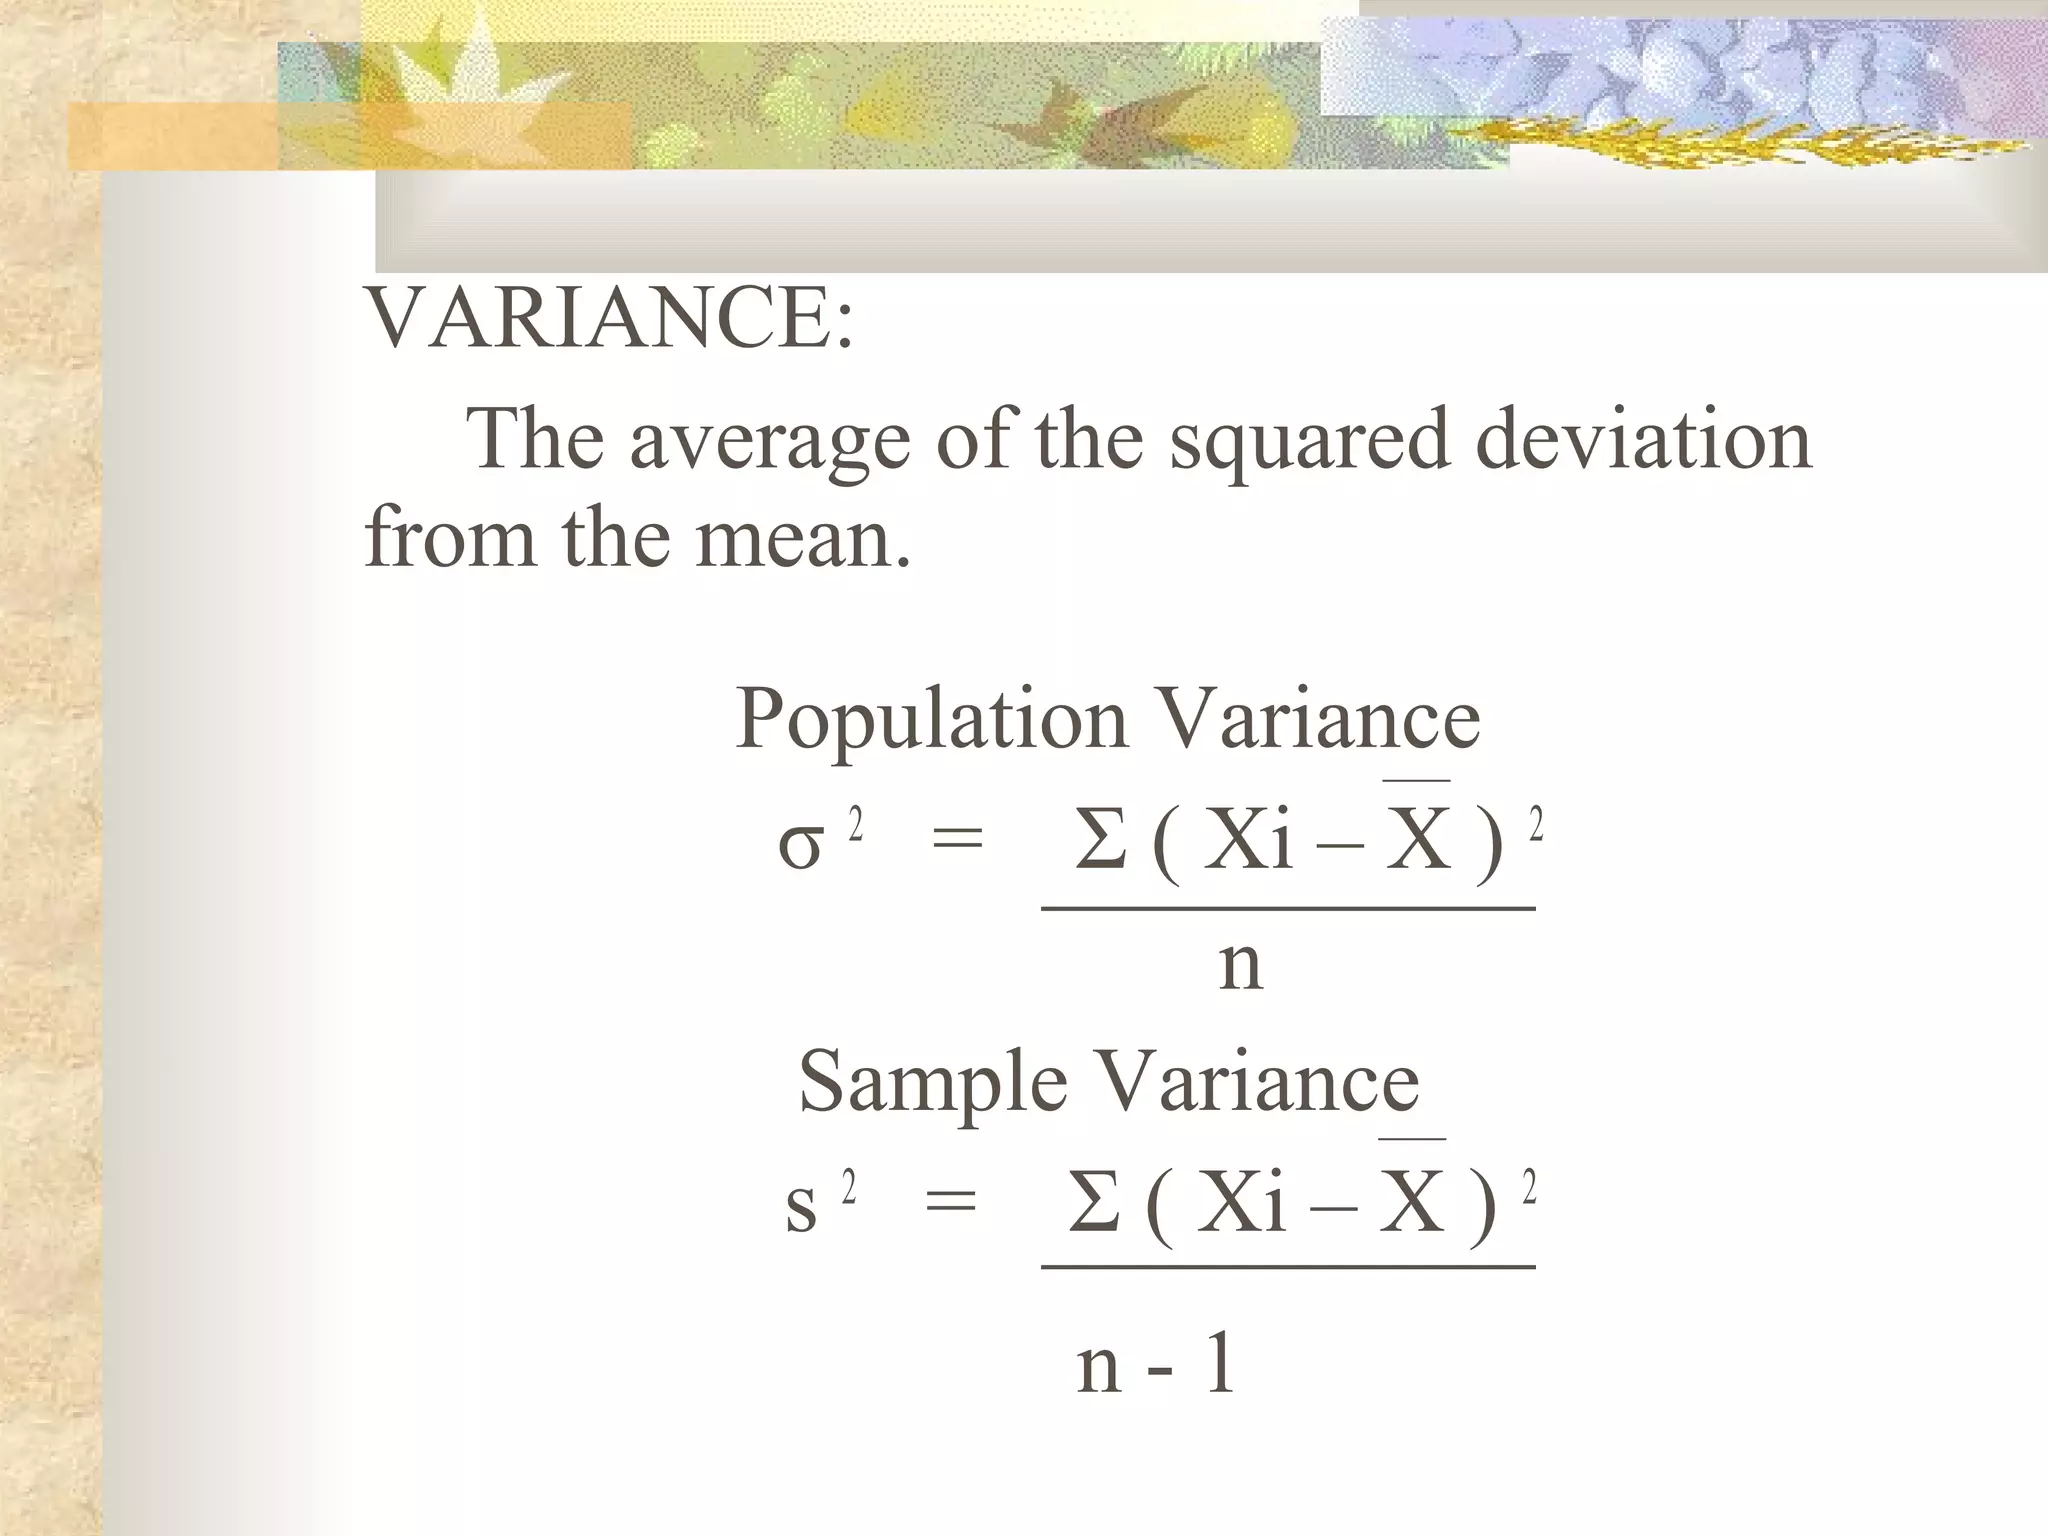
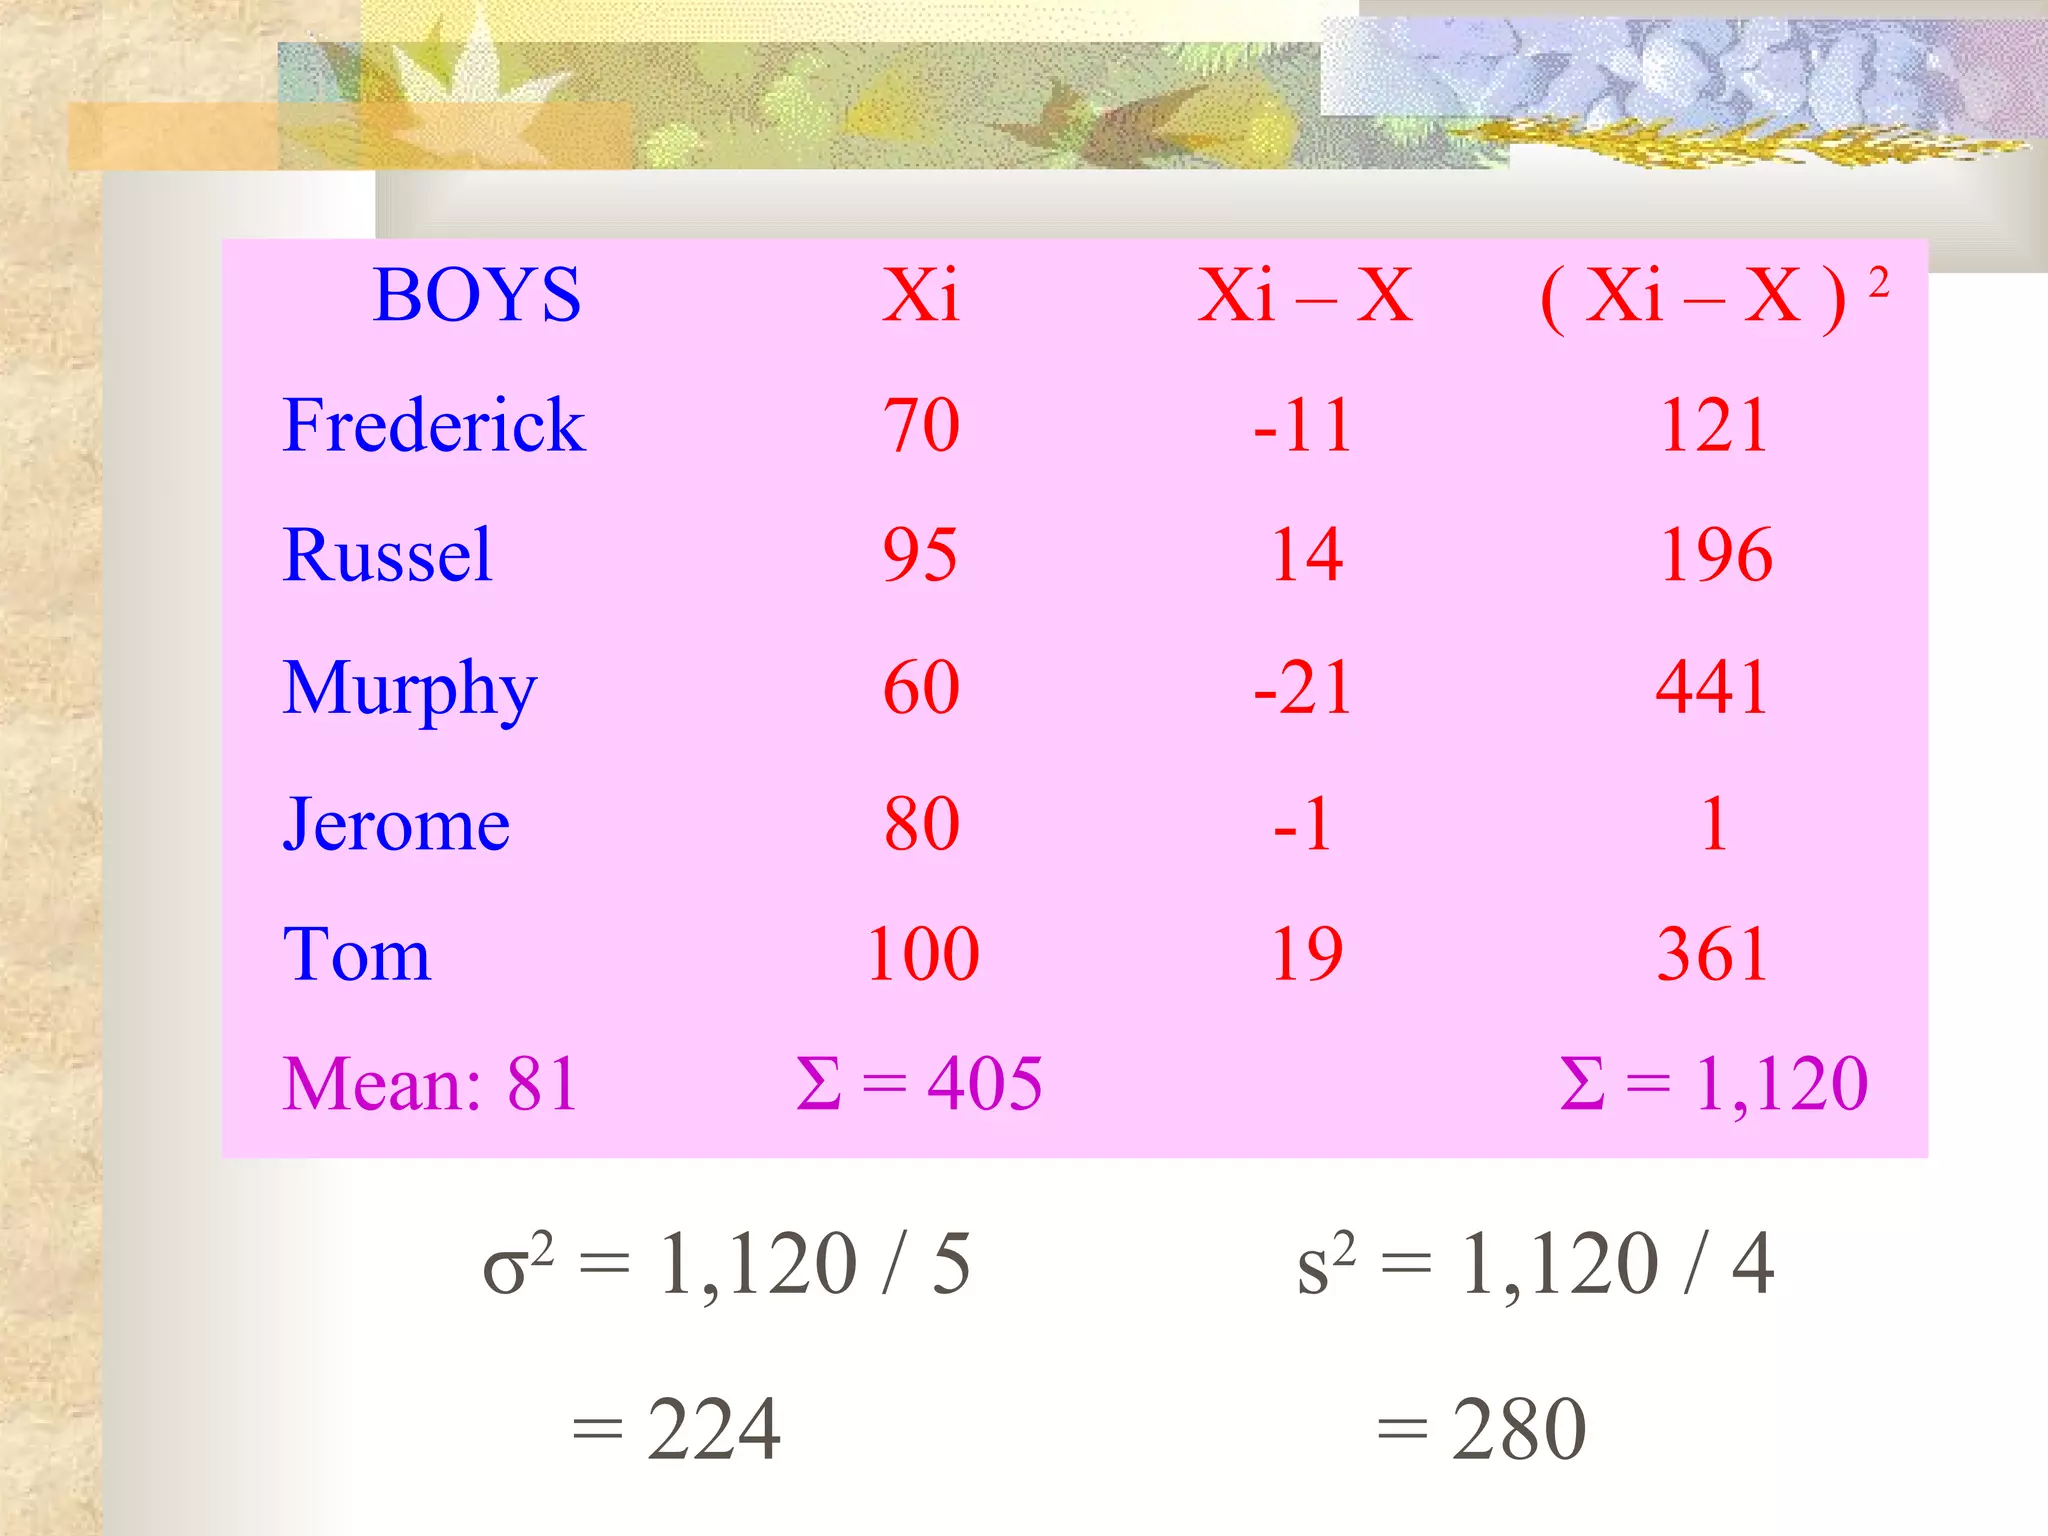
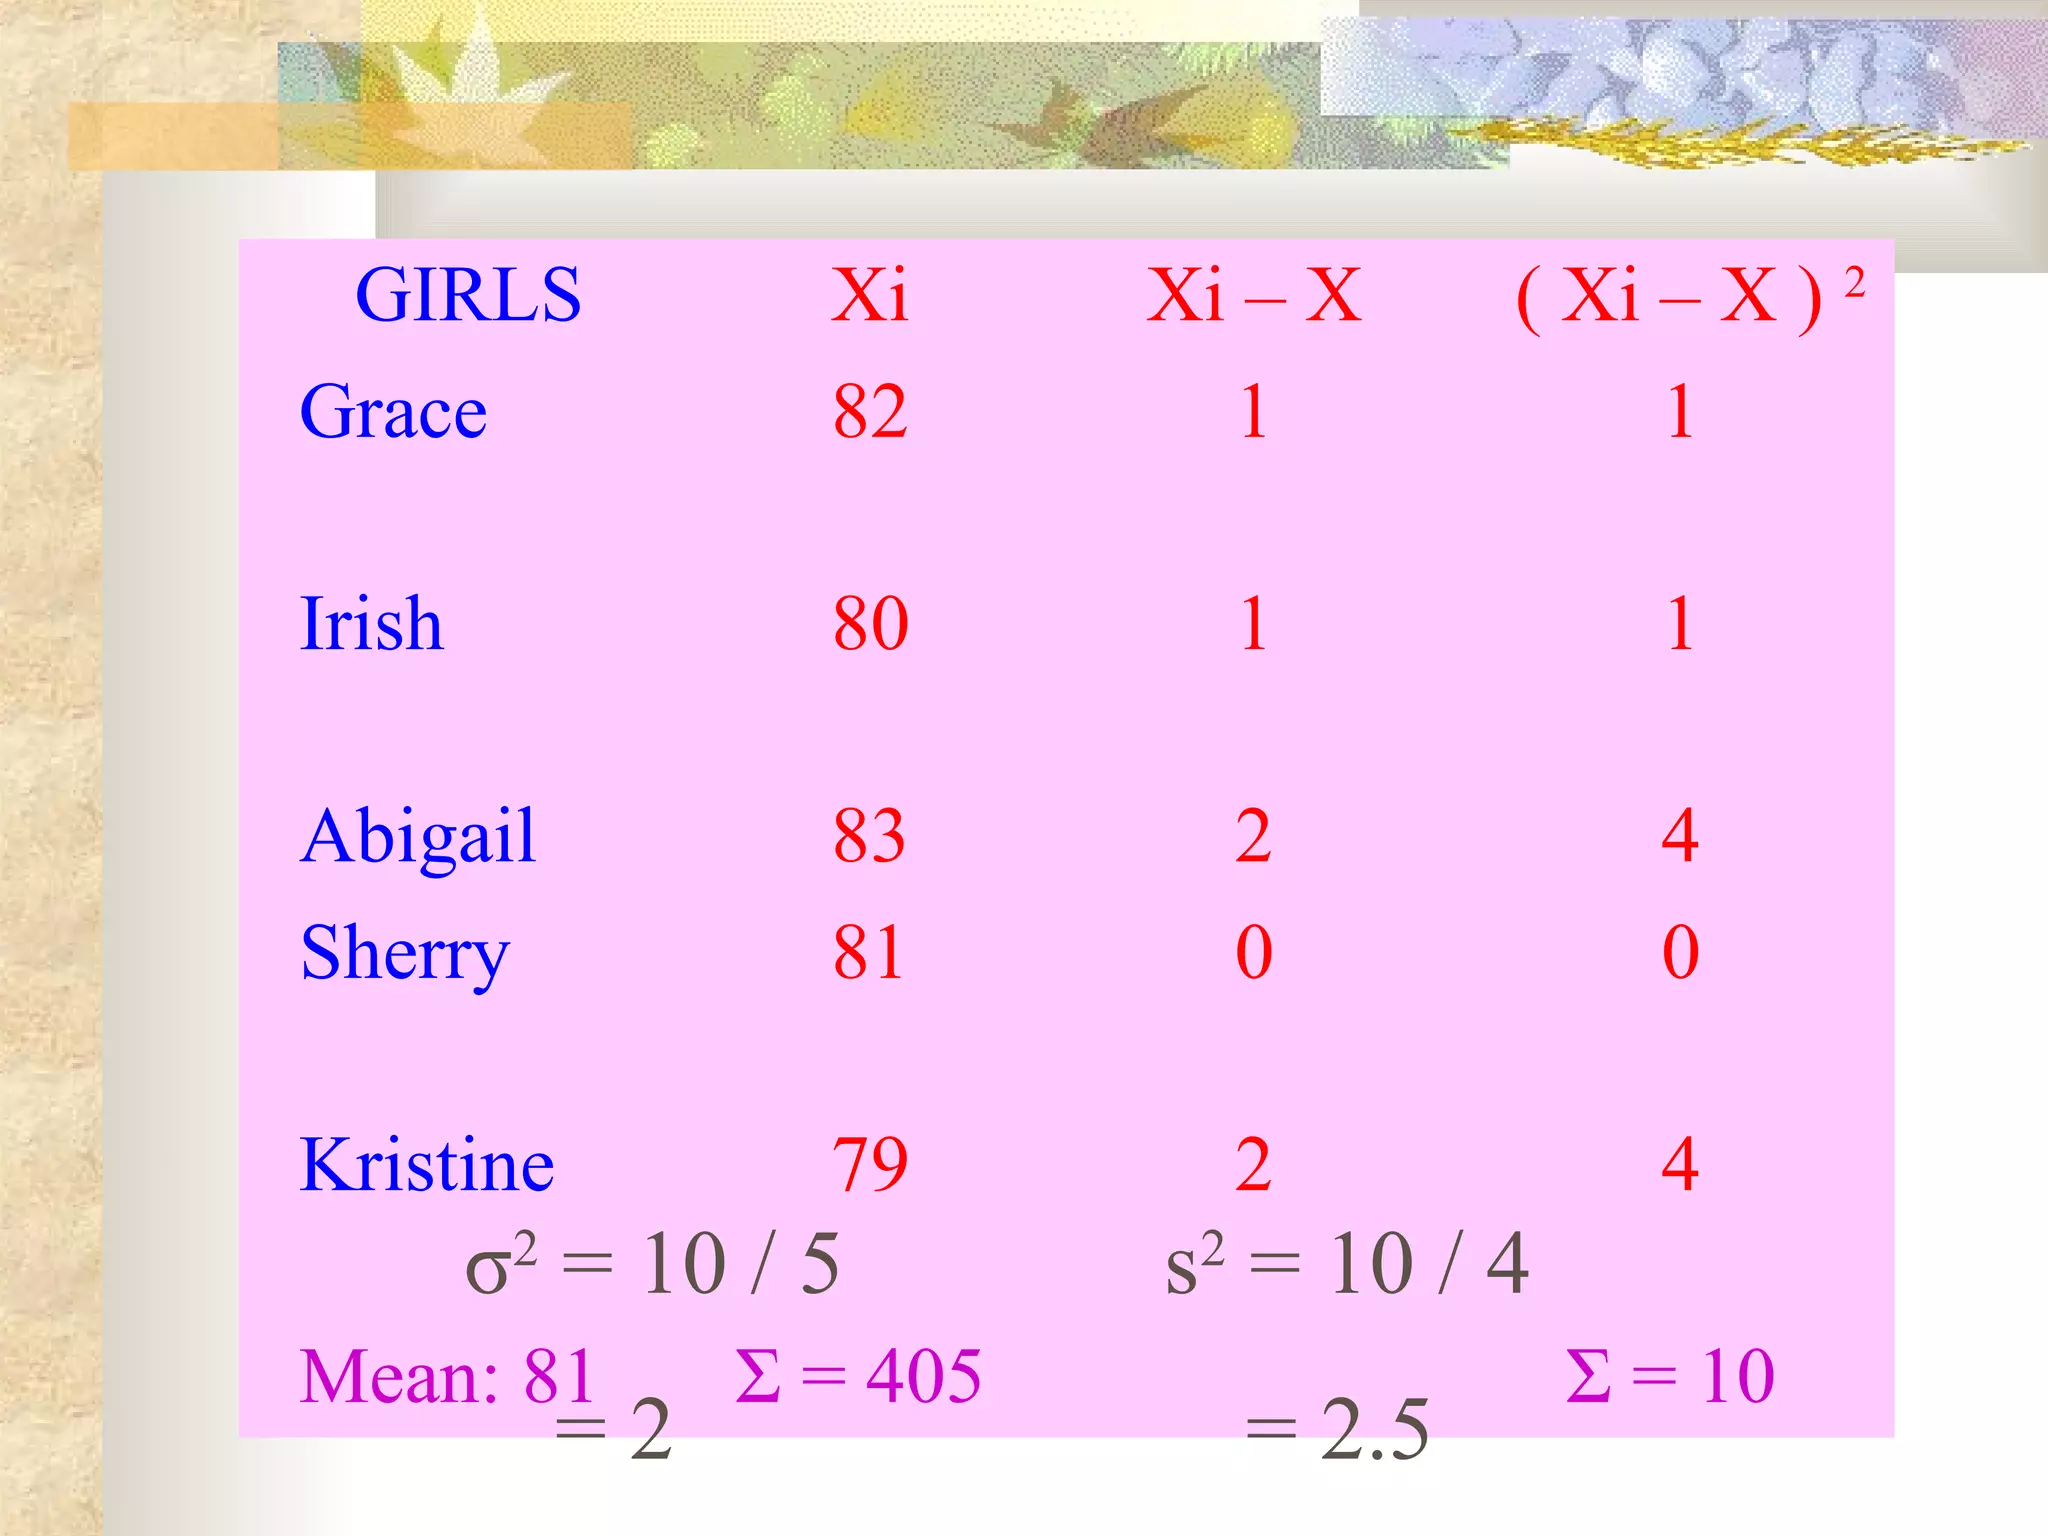
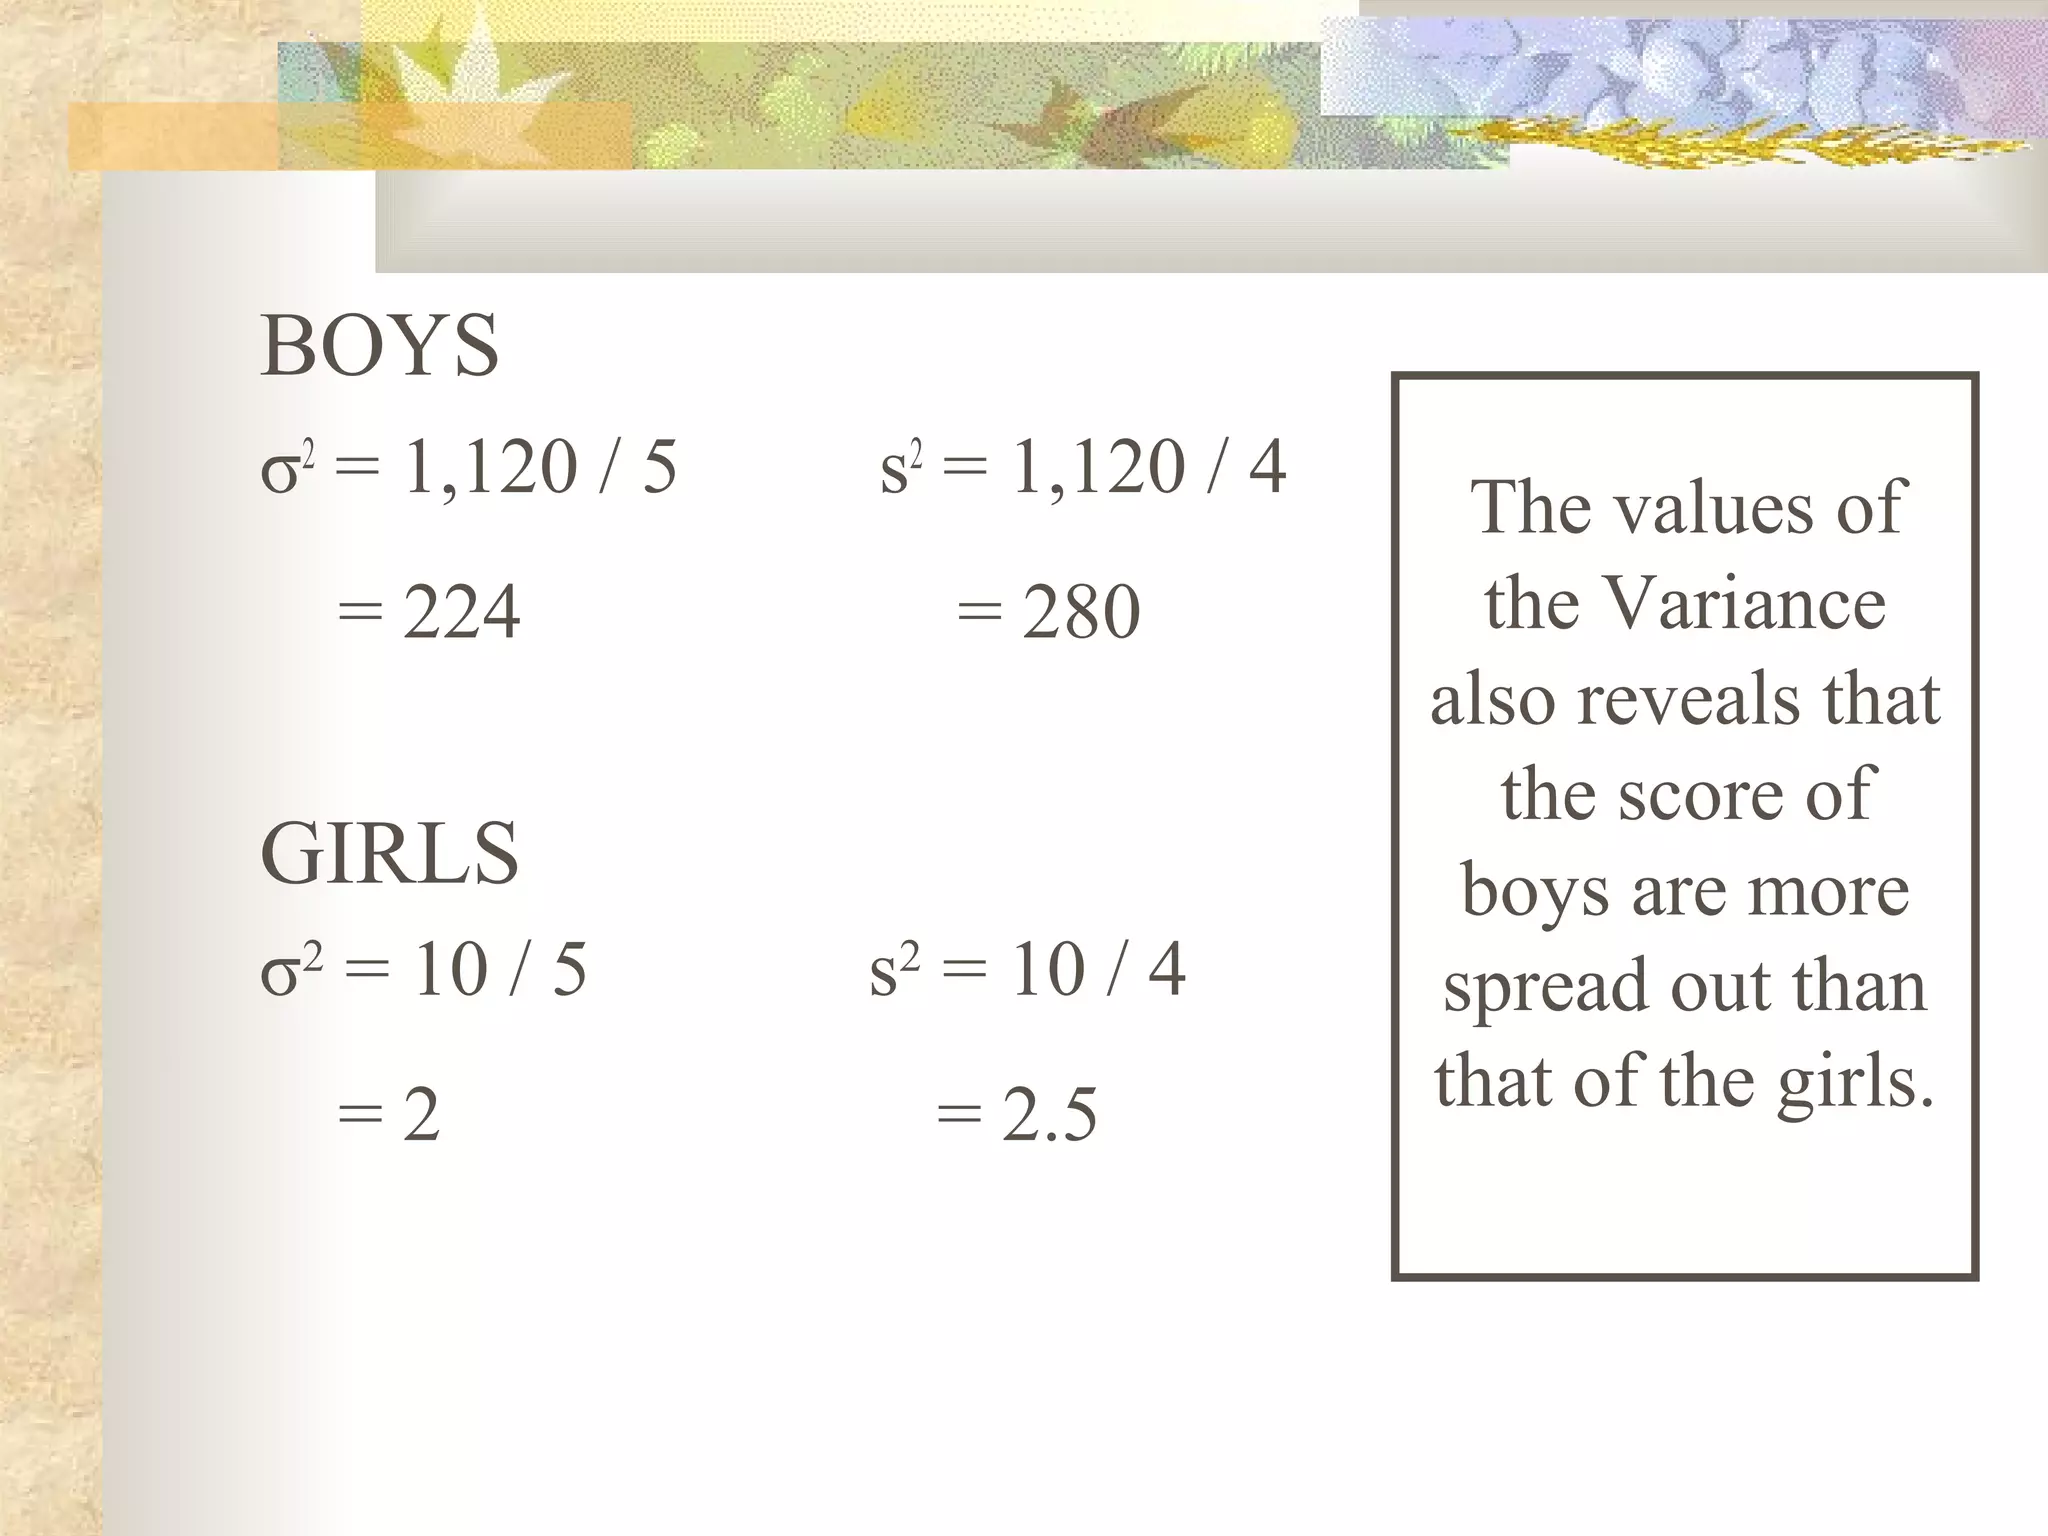
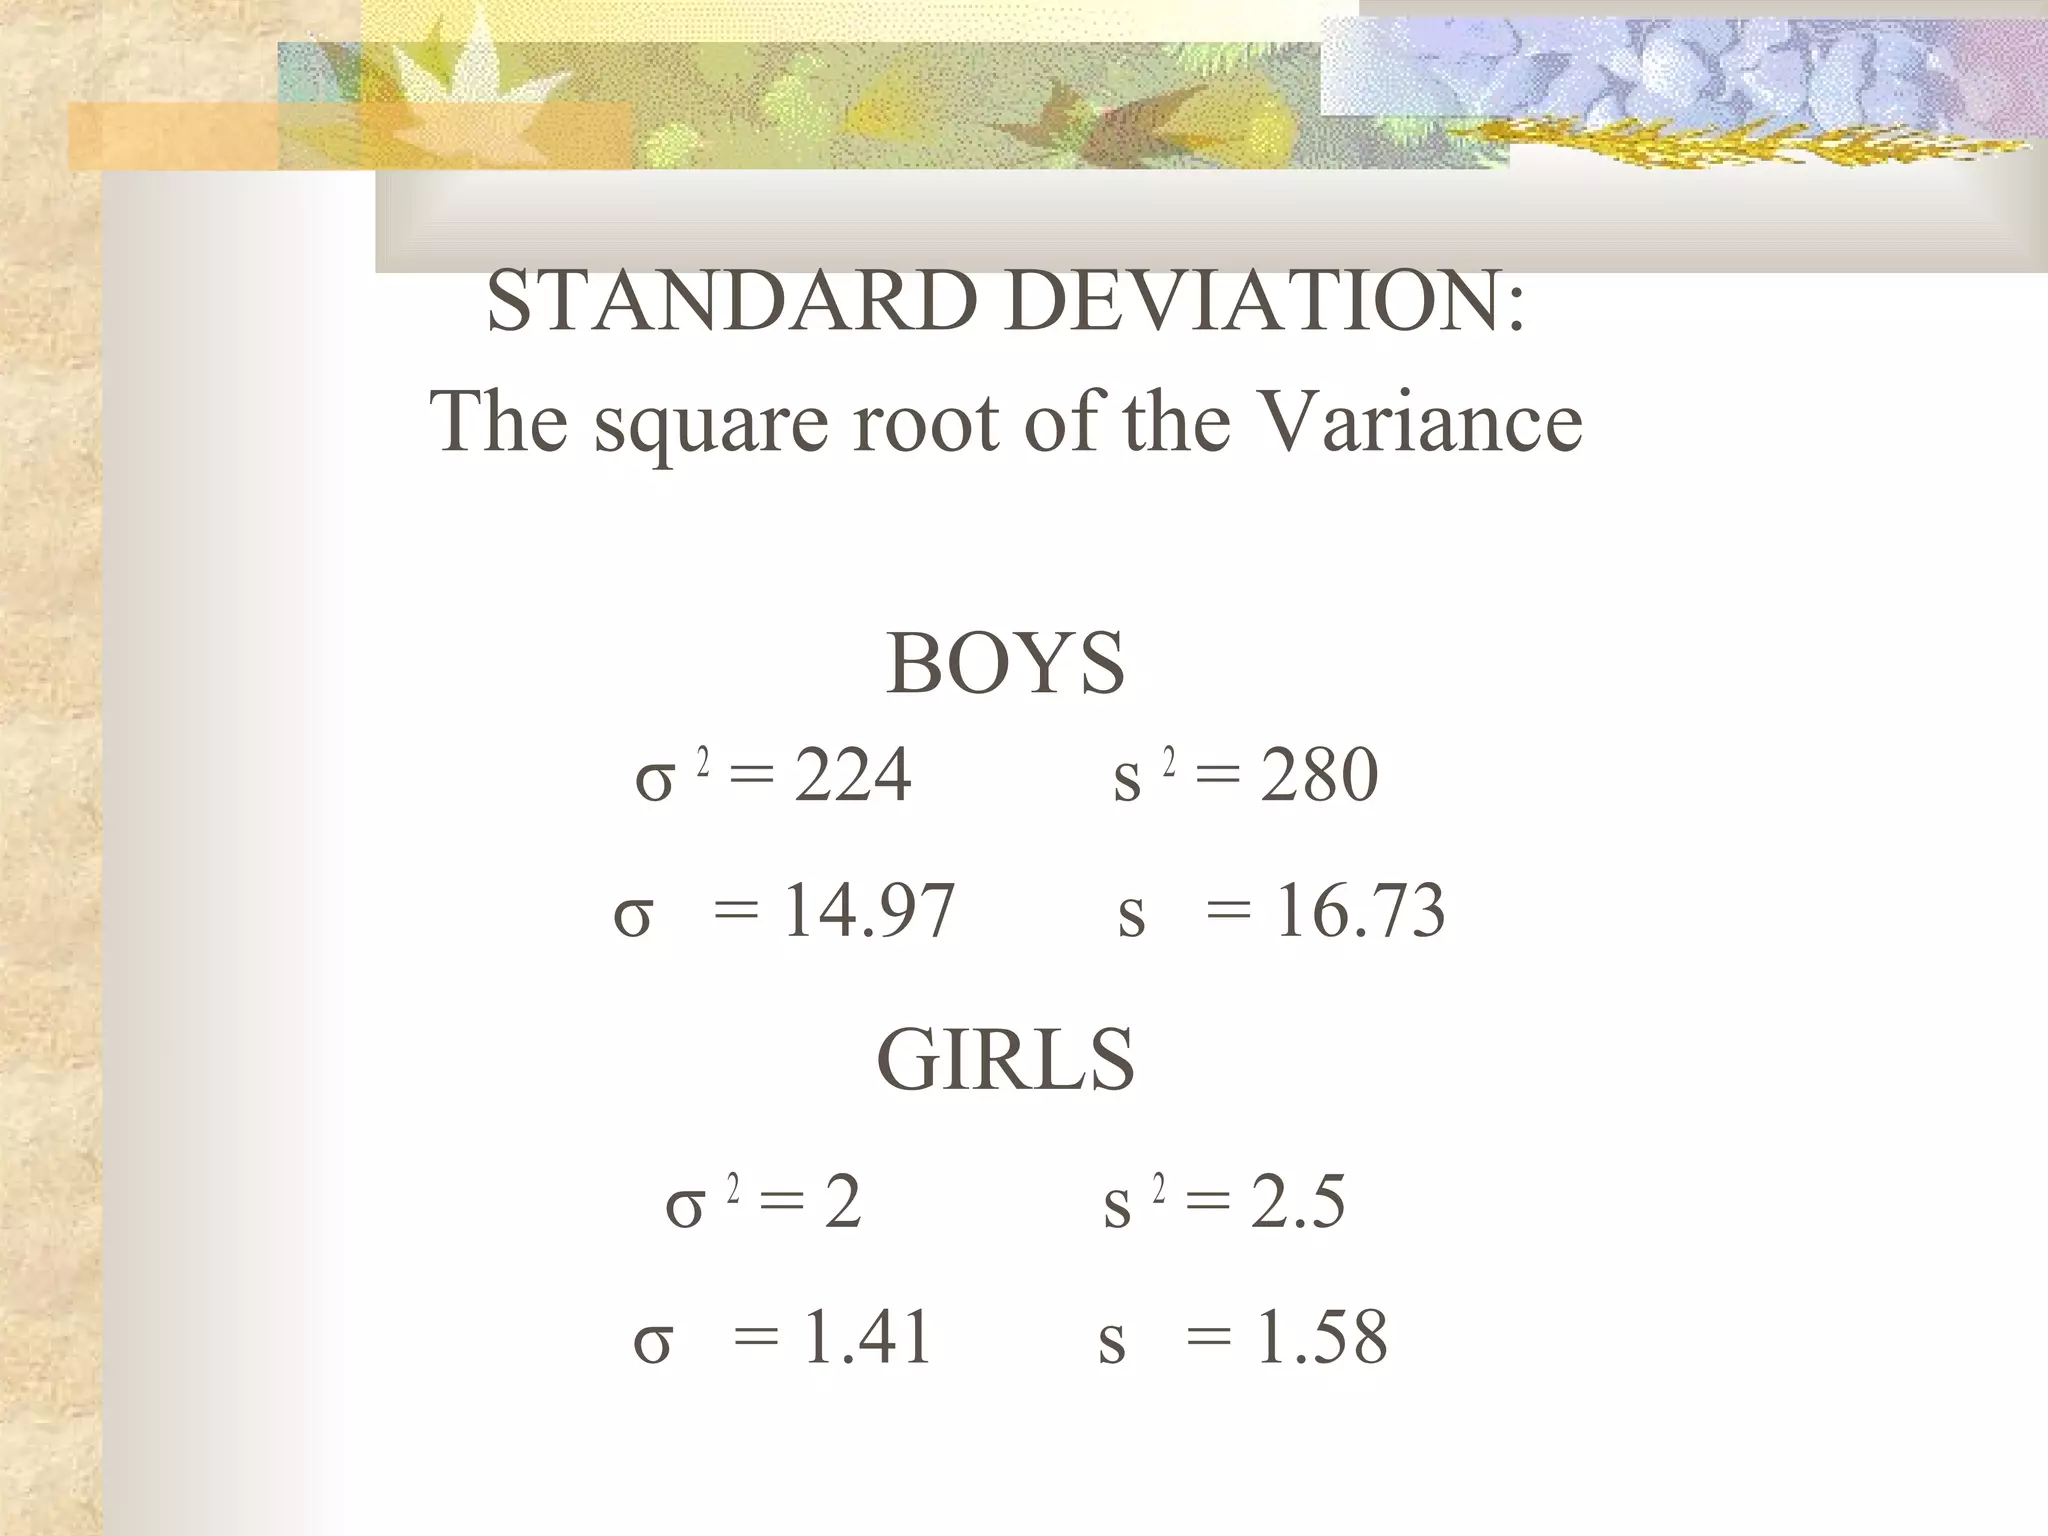


The document outlines objectives for students to learn about measures of variability, including range, mean deviation, variance, and standard deviation. It provides examples of calculating each measure for two data sets of boys' and girls' math scores. The results show the girls' data is more homogeneous, as the measures of variability are lower for the girls' data than the boys' data.