SlideShare a Scribd company logo
University of Santo Tomas Junior High School
GRADE 8 MATHEMATICS
First Quarter
S.Y. 2015 – 2016
“DO NO HARM.” Notes # 9
CN: ________
NAME: ________________________________________________________________________________________ DATE: SEPTEMBER 02, 2015
SECTION:_________________________________________________________________ TEACHER:__________________________________________
HANDOUT: Frequency Distribution Table
Frequency Distribution – It is a collection of observations produced by sorting them into classes and
showing their frequency (or numbers) of occurrences in each class
A. Ungrouped Frequency Distribution – It results when observations are sorted into
_______________________________________________________________.
B. Grouped Frequency Distribution – It results when observations are sorted into
_______________________________________________________________.
Steps in Constructing a Grouped Frequency Distribution Table:
1. Find the range. Formula: R = _________________________
2. Decide on the number of classes. A ____________ is a grouping or category. Statisticians said that
the ideal number of classes is between 5 and 20.
3. Determine the class size or class width (i). ____________________________ is the size of each class.
*Note: Class widths are always rounded up.
Formula: i = ________________________________
desired number of classes
4. Determine the classes.
5. Tally the observations.
6. Determine the frequency.
Challenge yourself! 
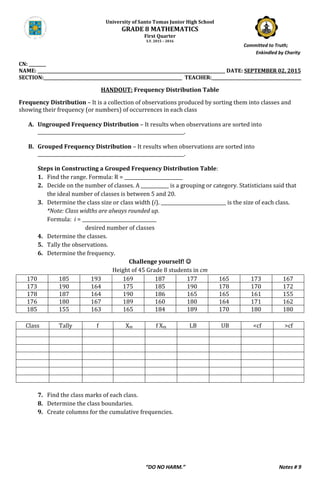
Height of 45 Grade 8 students in cm
170 185 193 169 187 177 165 173 167
173 190 164 175 185 190 178 170 172
178 187 164 190 186 165 165 161 155
176 180 167 189 160 180 164 171 162
185 155 163 165 184 189 170 180 180
Class Tally f Xm f Xm LB UB <cf >cf
7. Find the class marks of each class.
8. Determine the class boundaries.
9. Create columns for the cumulative frequencies.
Committed to Truth;
……Enkindled by Charity
University of Santo Tomas Junior High School
GRADE 8 MATHEMATICS
First Quarter
S.Y. 2015 – 2016
“DO NO HARM.” Notes # 9
Important Terms:
Range – the difference between the highest and lowest score in a set of data.
Frequency – the number of observations belonging to a class interval.
Class Intervals or Class Limits – refers to a grouping defined by a lower limit and an upper
limit. The lower limit of a class is the smallest data value that can be included in the class, and the
upper limit is the largest data value that can be included in the class.
For example:
In the class 19 – 21: lower limit = ________ upper limit = ________
In the class 45 – 47: lower limit = ________ upper limit = ________
Class Boundaries – These are often described as the true limits because these are more
precise expressions of class limits. The lower boundary of a class is 0.5 less than its lower limit,
and the upper boundary is 0.5 more than its upper limit.
For example:
In the class 19 – 21: lower boundary = ________ upper boundary = ________
In the class 45 – 47: lower boundary = ________ upper boundary = ________
Class Mark – It is the midpoint or the middle value in a class. It is obtained by finding the
average of the lower limit and the upper limit.
Class Size or Class Width – refers to the difference between the upper class boundary and the
lower class boundary of a class interval.
Cumulative Frequency – shows how many scores fall below or above a certain level
Assignment for September 03, 2015
Construct a frequency distribution table for the following set of data.
29 27 28 27 34 29 27 27 28
25 23 35 25 29 33 23 27 33
27 22 40 27 21 29 22 25 29
25 21 20 21 23 25 30 20 28
30 29 28 30 27 27 27 19 30

More Related Content

What's hot

Lesson 1 05 measuring central tendency
Lesson 1 05 measuring central tendencyLesson 1 05 measuring central tendency
Lesson 1 05 measuring central tendencyPerla Pelicano Corpez
 
Math10 q2 mod3of8_theorems on chords, arcs, central angles and inscribed angl...
Math10 q2 mod3of8_theorems on chords, arcs, central angles and inscribed angl...Math10 q2 mod3of8_theorems on chords, arcs, central angles and inscribed angl...
Math10 q2 mod3of8_theorems on chords, arcs, central angles and inscribed angl...FahadOdin
 
CABT SHS Statistics & Probability - Estimation of Parameters (intro)
CABT SHS Statistics & Probability -  Estimation of Parameters (intro)CABT SHS Statistics & Probability -  Estimation of Parameters (intro)
CABT SHS Statistics & Probability - Estimation of Parameters (intro)Gilbert Joseph Abueg
 
PERCENTILE : MEASURES OF POSITION FOR GROUPED DATA
PERCENTILE : MEASURES OF POSITION FOR GROUPED DATA PERCENTILE : MEASURES OF POSITION FOR GROUPED DATA
PERCENTILE : MEASURES OF POSITION FOR GROUPED DATA Chuckry Maunes
 
Lesson 5 data presentation
Lesson 5 data presentationLesson 5 data presentation
Lesson 5 data presentationMaris Ganace
 
Lesson 6 measures of central tendency
Lesson 6 measures of central tendencyLesson 6 measures of central tendency
Lesson 6 measures of central tendencyMaris Ganace
 
Lesson plan about statistics math 7
Lesson plan about statistics math 7Lesson plan about statistics math 7
Lesson plan about statistics math 7Jaybie09
 
Part 2 MATH INTERVENTION MATERIALS FOR LEAST MASTERED SKILLS IN MATHEMATICS ...
Part 2  MATH INTERVENTION MATERIALS FOR LEAST MASTERED SKILLS IN MATHEMATICS ...Part 2  MATH INTERVENTION MATERIALS FOR LEAST MASTERED SKILLS IN MATHEMATICS ...
Part 2 MATH INTERVENTION MATERIALS FOR LEAST MASTERED SKILLS IN MATHEMATICS ...SINAG-TALA E/S
 
Measures of Central Tendency: Ungrouped and Grouped
Measures of Central Tendency: Ungrouped and GroupedMeasures of Central Tendency: Ungrouped and Grouped
Measures of Central Tendency: Ungrouped and GroupedMaryGraceRecaaAgusti
 
Measures of Central Tendency
Measures of Central TendencyMeasures of Central Tendency
Measures of Central TendencyRegina Cruz
 
Measures of central tendency
Measures of central tendencyMeasures of central tendency
Measures of central tendencytttorek
 
Detailed Lesson Plan on Measures of Variability of Grouped and Ungrouped Data
Detailed Lesson Plan on Measures of Variability of Grouped and Ungrouped DataDetailed Lesson Plan on Measures of Variability of Grouped and Ungrouped Data
Detailed Lesson Plan on Measures of Variability of Grouped and Ungrouped DataJunila Tejada
 
learning competency 4a. writes expressions with rational exponents as radicals
learning competency 4a. writes expressions with rational exponents as radicalslearning competency 4a. writes expressions with rational exponents as radicals
learning competency 4a. writes expressions with rational exponents as radicalsrina valencia
 
Math 10 Curriculum Guide
Math 10 Curriculum GuideMath 10 Curriculum Guide
Math 10 Curriculum Guideleybrigs
 

What's hot (20)

Lesson 1 05 measuring central tendency
Lesson 1 05 measuring central tendencyLesson 1 05 measuring central tendency
Lesson 1 05 measuring central tendency
 
Math10 q2 mod3of8_theorems on chords, arcs, central angles and inscribed angl...
Math10 q2 mod3of8_theorems on chords, arcs, central angles and inscribed angl...Math10 q2 mod3of8_theorems on chords, arcs, central angles and inscribed angl...
Math10 q2 mod3of8_theorems on chords, arcs, central angles and inscribed angl...
 
CABT SHS Statistics & Probability - Estimation of Parameters (intro)
CABT SHS Statistics & Probability -  Estimation of Parameters (intro)CABT SHS Statistics & Probability -  Estimation of Parameters (intro)
CABT SHS Statistics & Probability - Estimation of Parameters (intro)
 
Statistics and probability lesson5
Statistics and probability lesson5Statistics and probability lesson5
Statistics and probability lesson5
 
PERCENTILE : MEASURES OF POSITION FOR GROUPED DATA
PERCENTILE : MEASURES OF POSITION FOR GROUPED DATA PERCENTILE : MEASURES OF POSITION FOR GROUPED DATA
PERCENTILE : MEASURES OF POSITION FOR GROUPED DATA
 
Lesson 5 data presentation
Lesson 5 data presentationLesson 5 data presentation
Lesson 5 data presentation
 
Lesson 6 measures of central tendency
Lesson 6 measures of central tendencyLesson 6 measures of central tendency
Lesson 6 measures of central tendency
 
Geometric Mean
Geometric MeanGeometric Mean
Geometric Mean
 
Lesson plan about statistics math 7
Lesson plan about statistics math 7Lesson plan about statistics math 7
Lesson plan about statistics math 7
 
MEASURES OF POSITION
MEASURES OF POSITIONMEASURES OF POSITION
MEASURES OF POSITION
 
Part 2 MATH INTERVENTION MATERIALS FOR LEAST MASTERED SKILLS IN MATHEMATICS ...
Part 2  MATH INTERVENTION MATERIALS FOR LEAST MASTERED SKILLS IN MATHEMATICS ...Part 2  MATH INTERVENTION MATERIALS FOR LEAST MASTERED SKILLS IN MATHEMATICS ...
Part 2 MATH INTERVENTION MATERIALS FOR LEAST MASTERED SKILLS IN MATHEMATICS ...
 
Measures of Central Tendency: Ungrouped and Grouped
Measures of Central Tendency: Ungrouped and GroupedMeasures of Central Tendency: Ungrouped and Grouped
Measures of Central Tendency: Ungrouped and Grouped
 
Measures of Central Tendency
Measures of Central TendencyMeasures of Central Tendency
Measures of Central Tendency
 
ppt week 1 quarter 4.pptx
ppt week 1 quarter 4.pptxppt week 1 quarter 4.pptx
ppt week 1 quarter 4.pptx
 
Measures of central tendency
Measures of central tendencyMeasures of central tendency
Measures of central tendency
 
Detailed Lesson Plan on Measures of Variability of Grouped and Ungrouped Data
Detailed Lesson Plan on Measures of Variability of Grouped and Ungrouped DataDetailed Lesson Plan on Measures of Variability of Grouped and Ungrouped Data
Detailed Lesson Plan on Measures of Variability of Grouped and Ungrouped Data
 
learning competency 4a. writes expressions with rational exponents as radicals
learning competency 4a. writes expressions with rational exponents as radicalslearning competency 4a. writes expressions with rational exponents as radicals
learning competency 4a. writes expressions with rational exponents as radicals
 
Math 10 Curriculum Guide
Math 10 Curriculum GuideMath 10 Curriculum Guide
Math 10 Curriculum Guide
 
Measures of variability grouped data
Measures of variability grouped dataMeasures of variability grouped data
Measures of variability grouped data
 
Table of specification
Table of specificationTable of specification
Table of specification
 

Similar to Frequency Distribution Table Handout

1) Chapter#02 Presentation of Data.ppt
1) Chapter#02 Presentation of Data.ppt1) Chapter#02 Presentation of Data.ppt
1) Chapter#02 Presentation of Data.pptMuntazirMehdi43
 
Utilization of Data: Introduction to Statistics
Utilization of Data: Introduction to StatisticsUtilization of Data: Introduction to Statistics
Utilization of Data: Introduction to StatisticsChristine Mejino
 
Graphical presentation of data
Graphical presentation of dataGraphical presentation of data
Graphical presentation of dataprince irfan
 
Statistics
StatisticsStatistics
Statisticspikuoec
 
Unit 12 lesson 5 measures of variability
Unit 12 lesson 5 measures of variabilityUnit 12 lesson 5 measures of variability
Unit 12 lesson 5 measures of variabilitymlabuski
 
ORGANISATION OF DATA.pptx
ORGANISATION OF DATA.pptxORGANISATION OF DATA.pptx
ORGANISATION OF DATA.pptxajesh ps
 
Tabulation of Data, Frequency Distribution, Contingency table
Tabulation of Data, Frequency Distribution, Contingency tableTabulation of Data, Frequency Distribution, Contingency table
Tabulation of Data, Frequency Distribution, Contingency tableJagdish Powar
 
Mathematics 7 Frequency Distribution Table.pptx
Mathematics 7 Frequency Distribution Table.pptxMathematics 7 Frequency Distribution Table.pptx
Mathematics 7 Frequency Distribution Table.pptxJeraldelEncepto
 
Basic statistics for marketing management
Basic statistics for marketing managementBasic statistics for marketing management
Basic statistics for marketing managementmukeremm25
 
CHAPTER 3: FREQUENCY DISTRIBUTION ..pptx
CHAPTER 3: FREQUENCY DISTRIBUTION ..pptxCHAPTER 3: FREQUENCY DISTRIBUTION ..pptx
CHAPTER 3: FREQUENCY DISTRIBUTION ..pptxBeverlyAmoraSerada
 
Stastistics
StastisticsStastistics
StastisticsRivan001
 
Utilization-of-assessment-data-assessmentinLearning1.pptx
Utilization-of-assessment-data-assessmentinLearning1.pptxUtilization-of-assessment-data-assessmentinLearning1.pptx
Utilization-of-assessment-data-assessmentinLearning1.pptxEdeleneGetes
 
Steps in Constructing a Frequency Distribution Table.pptx
Steps in Constructing a Frequency Distribution Table.pptxSteps in Constructing a Frequency Distribution Table.pptx
Steps in Constructing a Frequency Distribution Table.pptxPinakaShunga1
 
MCA_UNIT-3_Computer Oriented Numerical Statistical Methods
MCA_UNIT-3_Computer Oriented Numerical Statistical MethodsMCA_UNIT-3_Computer Oriented Numerical Statistical Methods
MCA_UNIT-3_Computer Oriented Numerical Statistical MethodsRai University
 

Similar to Frequency Distribution Table Handout (20)

Jes al1 report
Jes al1 reportJes al1 report
Jes al1 report
 
Elementary Statistics
Elementary Statistics Elementary Statistics
Elementary Statistics
 
1) Chapter#02 Presentation of Data.ppt
1) Chapter#02 Presentation of Data.ppt1) Chapter#02 Presentation of Data.ppt
1) Chapter#02 Presentation of Data.ppt
 
Utilization of Data: Introduction to Statistics
Utilization of Data: Introduction to StatisticsUtilization of Data: Introduction to Statistics
Utilization of Data: Introduction to Statistics
 
Lecture 03.
Lecture 03.Lecture 03.
Lecture 03.
 
Graphical presentation of data
Graphical presentation of dataGraphical presentation of data
Graphical presentation of data
 
Statistics
StatisticsStatistics
Statistics
 
Unit 12 lesson 5 measures of variability
Unit 12 lesson 5 measures of variabilityUnit 12 lesson 5 measures of variability
Unit 12 lesson 5 measures of variability
 
ORGANISATION OF DATA.pptx
ORGANISATION OF DATA.pptxORGANISATION OF DATA.pptx
ORGANISATION OF DATA.pptx
 
Tabulation of Data, Frequency Distribution, Contingency table
Tabulation of Data, Frequency Distribution, Contingency tableTabulation of Data, Frequency Distribution, Contingency table
Tabulation of Data, Frequency Distribution, Contingency table
 
Mathematics 7 Frequency Distribution Table.pptx
Mathematics 7 Frequency Distribution Table.pptxMathematics 7 Frequency Distribution Table.pptx
Mathematics 7 Frequency Distribution Table.pptx
 
Basic statistics for marketing management
Basic statistics for marketing managementBasic statistics for marketing management
Basic statistics for marketing management
 
CHAPTER 3: FREQUENCY DISTRIBUTION ..pptx
CHAPTER 3: FREQUENCY DISTRIBUTION ..pptxCHAPTER 3: FREQUENCY DISTRIBUTION ..pptx
CHAPTER 3: FREQUENCY DISTRIBUTION ..pptx
 
Stastistics
StastisticsStastistics
Stastistics
 
Utilization-of-assessment-data-assessmentinLearning1.pptx
Utilization-of-assessment-data-assessmentinLearning1.pptxUtilization-of-assessment-data-assessmentinLearning1.pptx
Utilization-of-assessment-data-assessmentinLearning1.pptx
 
Steps in Constructing a Frequency Distribution Table.pptx
Steps in Constructing a Frequency Distribution Table.pptxSteps in Constructing a Frequency Distribution Table.pptx
Steps in Constructing a Frequency Distribution Table.pptx
 
Statistics(Basic)
Statistics(Basic)Statistics(Basic)
Statistics(Basic)
 
MCA_UNIT-3_Computer Oriented Numerical Statistical Methods
MCA_UNIT-3_Computer Oriented Numerical Statistical MethodsMCA_UNIT-3_Computer Oriented Numerical Statistical Methods
MCA_UNIT-3_Computer Oriented Numerical Statistical Methods
 
Assessment compiled
Assessment compiledAssessment compiled
Assessment compiled
 
Statistics Homework Help
Statistics Homework HelpStatistics Homework Help
Statistics Homework Help
 

More from sheisirenebkm

Worksheet on Ractangular Coordinate System
Worksheet on Ractangular Coordinate SystemWorksheet on Ractangular Coordinate System
Worksheet on Ractangular Coordinate Systemsheisirenebkm
 
Worksheet on the Applications of Rational Algebraic Expressions
Worksheet on the Applications of Rational Algebraic ExpressionsWorksheet on the Applications of Rational Algebraic Expressions
Worksheet on the Applications of Rational Algebraic Expressionssheisirenebkm
 
Worksheet on Simplifying Rational Algebraic Expressions
Worksheet on Simplifying Rational Algebraic ExpressionsWorksheet on Simplifying Rational Algebraic Expressions
Worksheet on Simplifying Rational Algebraic Expressionssheisirenebkm
 
Worksheet on Operations on Rational Algebraic Expressions
Worksheet on Operations on Rational Algebraic ExpressionsWorksheet on Operations on Rational Algebraic Expressions
Worksheet on Operations on Rational Algebraic Expressionssheisirenebkm
 
Worksheet on Factoring Techniques in Algebra
Worksheet on Factoring Techniques in AlgebraWorksheet on Factoring Techniques in Algebra
Worksheet on Factoring Techniques in Algebrasheisirenebkm
 
Worksheet on Special Products
Worksheet on Special ProductsWorksheet on Special Products
Worksheet on Special Productssheisirenebkm
 
Worksheet on Special Products
Worksheet on Special Products Worksheet on Special Products
Worksheet on Special Products sheisirenebkm
 
Worksheet on Special Products
Worksheet on Special ProductsWorksheet on Special Products
Worksheet on Special Productssheisirenebkm
 
Functions and Relations
Functions and RelationsFunctions and Relations
Functions and Relationssheisirenebkm
 
Linear Equations in Two Variables
Linear Equations in Two VariablesLinear Equations in Two Variables
Linear Equations in Two Variablessheisirenebkm
 
Education Leaders' Empowerment Symposium
Education Leaders' Empowerment SymposiumEducation Leaders' Empowerment Symposium
Education Leaders' Empowerment Symposiumsheisirenebkm
 
Stem-and-Leaf Plot and Line Plot
Stem-and-Leaf Plot and Line PlotStem-and-Leaf Plot and Line Plot
Stem-and-Leaf Plot and Line Plotsheisirenebkm
 
Presentation of Data - How to Construct Graphs
Presentation of Data - How to Construct GraphsPresentation of Data - How to Construct Graphs
Presentation of Data - How to Construct Graphssheisirenebkm
 
Measures of Central Tendency and Variability for Grouped Data
Measures of Central Tendency and Variability for Grouped DataMeasures of Central Tendency and Variability for Grouped Data
Measures of Central Tendency and Variability for Grouped Datasheisirenebkm
 
Introduction to Statistics - Basic Statistical Terms
Introduction to Statistics - Basic Statistical TermsIntroduction to Statistics - Basic Statistical Terms
Introduction to Statistics - Basic Statistical Termssheisirenebkm
 
Differentiating Instruction
Differentiating InstructionDifferentiating Instruction
Differentiating Instructionsheisirenebkm
 
Reviewer for Mathematics Part 2
Reviewer for Mathematics Part 2Reviewer for Mathematics Part 2
Reviewer for Mathematics Part 2sheisirenebkm
 
Reviewer for Mathematics Part 1
Reviewer for Mathematics Part 1Reviewer for Mathematics Part 1
Reviewer for Mathematics Part 1sheisirenebkm
 
Conditional Statements | If-then Statements
Conditional Statements | If-then StatementsConditional Statements | If-then Statements
Conditional Statements | If-then Statementssheisirenebkm
 

More from sheisirenebkm (20)

Worksheet on Ractangular Coordinate System
Worksheet on Ractangular Coordinate SystemWorksheet on Ractangular Coordinate System
Worksheet on Ractangular Coordinate System
 
Worksheet on the Applications of Rational Algebraic Expressions
Worksheet on the Applications of Rational Algebraic ExpressionsWorksheet on the Applications of Rational Algebraic Expressions
Worksheet on the Applications of Rational Algebraic Expressions
 
Worksheet on Simplifying Rational Algebraic Expressions
Worksheet on Simplifying Rational Algebraic ExpressionsWorksheet on Simplifying Rational Algebraic Expressions
Worksheet on Simplifying Rational Algebraic Expressions
 
Worksheet on Operations on Rational Algebraic Expressions
Worksheet on Operations on Rational Algebraic ExpressionsWorksheet on Operations on Rational Algebraic Expressions
Worksheet on Operations on Rational Algebraic Expressions
 
Worksheet on Factoring Techniques in Algebra
Worksheet on Factoring Techniques in AlgebraWorksheet on Factoring Techniques in Algebra
Worksheet on Factoring Techniques in Algebra
 
Worksheet on Special Products
Worksheet on Special ProductsWorksheet on Special Products
Worksheet on Special Products
 
Worksheet on Special Products
Worksheet on Special Products Worksheet on Special Products
Worksheet on Special Products
 
Worksheet on Special Products
Worksheet on Special ProductsWorksheet on Special Products
Worksheet on Special Products
 
Functions and Relations
Functions and RelationsFunctions and Relations
Functions and Relations
 
Equations of a Line
Equations of a LineEquations of a Line
Equations of a Line
 
Linear Equations in Two Variables
Linear Equations in Two VariablesLinear Equations in Two Variables
Linear Equations in Two Variables
 
Education Leaders' Empowerment Symposium
Education Leaders' Empowerment SymposiumEducation Leaders' Empowerment Symposium
Education Leaders' Empowerment Symposium
 
Stem-and-Leaf Plot and Line Plot
Stem-and-Leaf Plot and Line PlotStem-and-Leaf Plot and Line Plot
Stem-and-Leaf Plot and Line Plot
 
Presentation of Data - How to Construct Graphs
Presentation of Data - How to Construct GraphsPresentation of Data - How to Construct Graphs
Presentation of Data - How to Construct Graphs
 
Measures of Central Tendency and Variability for Grouped Data
Measures of Central Tendency and Variability for Grouped DataMeasures of Central Tendency and Variability for Grouped Data
Measures of Central Tendency and Variability for Grouped Data
 
Introduction to Statistics - Basic Statistical Terms
Introduction to Statistics - Basic Statistical TermsIntroduction to Statistics - Basic Statistical Terms
Introduction to Statistics - Basic Statistical Terms
 
Differentiating Instruction
Differentiating InstructionDifferentiating Instruction
Differentiating Instruction
 
Reviewer for Mathematics Part 2
Reviewer for Mathematics Part 2Reviewer for Mathematics Part 2
Reviewer for Mathematics Part 2
 
Reviewer for Mathematics Part 1
Reviewer for Mathematics Part 1Reviewer for Mathematics Part 1
Reviewer for Mathematics Part 1
 
Conditional Statements | If-then Statements
Conditional Statements | If-then StatementsConditional Statements | If-then Statements
Conditional Statements | If-then Statements
 

Recently uploaded

Phrasal Verbs.XXXXXXXXXXXXXXXXXXXXXXXXXX
Phrasal Verbs.XXXXXXXXXXXXXXXXXXXXXXXXXXPhrasal Verbs.XXXXXXXXXXXXXXXXXXXXXXXXXX
Phrasal Verbs.XXXXXXXXXXXXXXXXXXXXXXXXXXMIRIAMSALINAS13
 
aaaaaaaaaaaaaaaaaaaaaaaaaaaaaaaaaaaaaaaaaaaaaaaaaaaaaaa
aaaaaaaaaaaaaaaaaaaaaaaaaaaaaaaaaaaaaaaaaaaaaaaaaaaaaaaaaaaaaaaaaaaaaaaaaaaaaaaaaaaaaaaaaaaaaaaaaaaaaaaaaaaaaa
aaaaaaaaaaaaaaaaaaaaaaaaaaaaaaaaaaaaaaaaaaaaaaaaaaaaaaasiemaillard
 
Additional Benefits for Employee Website.pdf
Additional Benefits for Employee Website.pdfAdditional Benefits for Employee Website.pdf
Additional Benefits for Employee Website.pdfjoachimlavalley1
 
Matatag-Curriculum and the 21st Century Skills Presentation.pptx
Matatag-Curriculum and the 21st Century Skills Presentation.pptxMatatag-Curriculum and the 21st Century Skills Presentation.pptx
Matatag-Curriculum and the 21st Century Skills Presentation.pptxJenilouCasareno
 
Accounting and finance exit exam 2016 E.C.pdf
Accounting and finance exit exam 2016 E.C.pdfAccounting and finance exit exam 2016 E.C.pdf
Accounting and finance exit exam 2016 E.C.pdfYibeltalNibretu
 
Benefits and Challenges of Using Open Educational Resources
Benefits and Challenges of Using Open Educational ResourcesBenefits and Challenges of Using Open Educational Resources
Benefits and Challenges of Using Open Educational Resourcesdimpy50
 
Gyanartha SciBizTech Quiz slideshare.pptx
Gyanartha SciBizTech Quiz slideshare.pptxGyanartha SciBizTech Quiz slideshare.pptx
Gyanartha SciBizTech Quiz slideshare.pptxShibin Azad
 
Basic_QTL_Marker-assisted_Selection_Sourabh.ppt
Basic_QTL_Marker-assisted_Selection_Sourabh.pptBasic_QTL_Marker-assisted_Selection_Sourabh.ppt
Basic_QTL_Marker-assisted_Selection_Sourabh.pptSourabh Kumar
 
Advances in production technology of Grapes.pdf
Advances in production technology of Grapes.pdfAdvances in production technology of Grapes.pdf
Advances in production technology of Grapes.pdfDr. M. Kumaresan Hort.
 
Sha'Carri Richardson Presentation 202345
Sha'Carri Richardson Presentation 202345Sha'Carri Richardson Presentation 202345
Sha'Carri Richardson Presentation 202345beazzy04
 
Fish and Chips - have they had their chips
Fish and Chips - have they had their chipsFish and Chips - have they had their chips
Fish and Chips - have they had their chipsGeoBlogs
 
Forest and Wildlife Resources Class 10 Free Study Material PDF
Forest and Wildlife Resources Class 10 Free Study Material PDFForest and Wildlife Resources Class 10 Free Study Material PDF
Forest and Wildlife Resources Class 10 Free Study Material PDFVivekanand Anglo Vedic Academy
 
Salient features of Environment protection Act 1986.pptx
Salient features of Environment protection Act 1986.pptxSalient features of Environment protection Act 1986.pptx
Salient features of Environment protection Act 1986.pptxakshayaramakrishnan21
 
Application of Matrices in real life. Presentation on application of matrices
Application of Matrices in real life. Presentation on application of matricesApplication of Matrices in real life. Presentation on application of matrices
Application of Matrices in real life. Presentation on application of matricesRased Khan
 
Home assignment II on Spectroscopy 2024 Answers.pdf
Home assignment II on Spectroscopy 2024 Answers.pdfHome assignment II on Spectroscopy 2024 Answers.pdf
Home assignment II on Spectroscopy 2024 Answers.pdfTamralipta Mahavidyalaya
 
NLC-2024-Orientation-for-RO-SDO (1).pptx
NLC-2024-Orientation-for-RO-SDO (1).pptxNLC-2024-Orientation-for-RO-SDO (1).pptx
NLC-2024-Orientation-for-RO-SDO (1).pptxssuserbdd3e8
 

Recently uploaded (20)

Mattingly "AI & Prompt Design: Limitations and Solutions with LLMs"
Mattingly "AI & Prompt Design: Limitations and Solutions with LLMs"Mattingly "AI & Prompt Design: Limitations and Solutions with LLMs"
Mattingly "AI & Prompt Design: Limitations and Solutions with LLMs"
 
Introduction to Quality Improvement Essentials
Introduction to Quality Improvement EssentialsIntroduction to Quality Improvement Essentials
Introduction to Quality Improvement Essentials
 
Phrasal Verbs.XXXXXXXXXXXXXXXXXXXXXXXXXX
Phrasal Verbs.XXXXXXXXXXXXXXXXXXXXXXXXXXPhrasal Verbs.XXXXXXXXXXXXXXXXXXXXXXXXXX
Phrasal Verbs.XXXXXXXXXXXXXXXXXXXXXXXXXX
 
aaaaaaaaaaaaaaaaaaaaaaaaaaaaaaaaaaaaaaaaaaaaaaaaaaaaaaa
aaaaaaaaaaaaaaaaaaaaaaaaaaaaaaaaaaaaaaaaaaaaaaaaaaaaaaaaaaaaaaaaaaaaaaaaaaaaaaaaaaaaaaaaaaaaaaaaaaaaaaaaaaaaaa
aaaaaaaaaaaaaaaaaaaaaaaaaaaaaaaaaaaaaaaaaaaaaaaaaaaaaaa
 
Additional Benefits for Employee Website.pdf
Additional Benefits for Employee Website.pdfAdditional Benefits for Employee Website.pdf
Additional Benefits for Employee Website.pdf
 
Matatag-Curriculum and the 21st Century Skills Presentation.pptx
Matatag-Curriculum and the 21st Century Skills Presentation.pptxMatatag-Curriculum and the 21st Century Skills Presentation.pptx
Matatag-Curriculum and the 21st Century Skills Presentation.pptx
 
Accounting and finance exit exam 2016 E.C.pdf
Accounting and finance exit exam 2016 E.C.pdfAccounting and finance exit exam 2016 E.C.pdf
Accounting and finance exit exam 2016 E.C.pdf
 
Benefits and Challenges of Using Open Educational Resources
Benefits and Challenges of Using Open Educational ResourcesBenefits and Challenges of Using Open Educational Resources
Benefits and Challenges of Using Open Educational Resources
 
Gyanartha SciBizTech Quiz slideshare.pptx
Gyanartha SciBizTech Quiz slideshare.pptxGyanartha SciBizTech Quiz slideshare.pptx
Gyanartha SciBizTech Quiz slideshare.pptx
 
Basic_QTL_Marker-assisted_Selection_Sourabh.ppt
Basic_QTL_Marker-assisted_Selection_Sourabh.pptBasic_QTL_Marker-assisted_Selection_Sourabh.ppt
Basic_QTL_Marker-assisted_Selection_Sourabh.ppt
 
Advances in production technology of Grapes.pdf
Advances in production technology of Grapes.pdfAdvances in production technology of Grapes.pdf
Advances in production technology of Grapes.pdf
 
Sha'Carri Richardson Presentation 202345
Sha'Carri Richardson Presentation 202345Sha'Carri Richardson Presentation 202345
Sha'Carri Richardson Presentation 202345
 
Operations Management - Book1.p - Dr. Abdulfatah A. Salem
Operations Management - Book1.p  - Dr. Abdulfatah A. SalemOperations Management - Book1.p  - Dr. Abdulfatah A. Salem
Operations Management - Book1.p - Dr. Abdulfatah A. Salem
 
Fish and Chips - have they had their chips
Fish and Chips - have they had their chipsFish and Chips - have they had their chips
Fish and Chips - have they had their chips
 
Forest and Wildlife Resources Class 10 Free Study Material PDF
Forest and Wildlife Resources Class 10 Free Study Material PDFForest and Wildlife Resources Class 10 Free Study Material PDF
Forest and Wildlife Resources Class 10 Free Study Material PDF
 
Salient features of Environment protection Act 1986.pptx
Salient features of Environment protection Act 1986.pptxSalient features of Environment protection Act 1986.pptx
Salient features of Environment protection Act 1986.pptx
 
Application of Matrices in real life. Presentation on application of matrices
Application of Matrices in real life. Presentation on application of matricesApplication of Matrices in real life. Presentation on application of matrices
Application of Matrices in real life. Presentation on application of matrices
 
Home assignment II on Spectroscopy 2024 Answers.pdf
Home assignment II on Spectroscopy 2024 Answers.pdfHome assignment II on Spectroscopy 2024 Answers.pdf
Home assignment II on Spectroscopy 2024 Answers.pdf
 
B.ed spl. HI pdusu exam paper-2023-24.pdf
B.ed spl. HI pdusu exam paper-2023-24.pdfB.ed spl. HI pdusu exam paper-2023-24.pdf
B.ed spl. HI pdusu exam paper-2023-24.pdf
 
NLC-2024-Orientation-for-RO-SDO (1).pptx
NLC-2024-Orientation-for-RO-SDO (1).pptxNLC-2024-Orientation-for-RO-SDO (1).pptx
NLC-2024-Orientation-for-RO-SDO (1).pptx
 

Frequency Distribution Table Handout

  • 1. University of Santo Tomas Junior High School GRADE 8 MATHEMATICS First Quarter S.Y. 2015 – 2016 “DO NO HARM.” Notes # 9 CN: ________ NAME: ________________________________________________________________________________________ DATE: SEPTEMBER 02, 2015 SECTION:_________________________________________________________________ TEACHER:__________________________________________ HANDOUT: Frequency Distribution Table Frequency Distribution – It is a collection of observations produced by sorting them into classes and showing their frequency (or numbers) of occurrences in each class A. Ungrouped Frequency Distribution – It results when observations are sorted into _______________________________________________________________. B. Grouped Frequency Distribution – It results when observations are sorted into _______________________________________________________________. Steps in Constructing a Grouped Frequency Distribution Table: 1. Find the range. Formula: R = _________________________ 2. Decide on the number of classes. A ____________ is a grouping or category. Statisticians said that the ideal number of classes is between 5 and 20. 3. Determine the class size or class width (i). ____________________________ is the size of each class. *Note: Class widths are always rounded up. Formula: i = ________________________________ desired number of classes 4. Determine the classes. 5. Tally the observations. 6. Determine the frequency. Challenge yourself!  Height of 45 Grade 8 students in cm 170 185 193 169 187 177 165 173 167 173 190 164 175 185 190 178 170 172 178 187 164 190 186 165 165 161 155 176 180 167 189 160 180 164 171 162 185 155 163 165 184 189 170 180 180 Class Tally f Xm f Xm LB UB <cf >cf 7. Find the class marks of each class. 8. Determine the class boundaries. 9. Create columns for the cumulative frequencies. Committed to Truth; ……Enkindled by Charity
  • 2. University of Santo Tomas Junior High School GRADE 8 MATHEMATICS First Quarter S.Y. 2015 – 2016 “DO NO HARM.” Notes # 9 Important Terms: Range – the difference between the highest and lowest score in a set of data. Frequency – the number of observations belonging to a class interval. Class Intervals or Class Limits – refers to a grouping defined by a lower limit and an upper limit. The lower limit of a class is the smallest data value that can be included in the class, and the upper limit is the largest data value that can be included in the class. For example: In the class 19 – 21: lower limit = ________ upper limit = ________ In the class 45 – 47: lower limit = ________ upper limit = ________ Class Boundaries – These are often described as the true limits because these are more precise expressions of class limits. The lower boundary of a class is 0.5 less than its lower limit, and the upper boundary is 0.5 more than its upper limit. For example: In the class 19 – 21: lower boundary = ________ upper boundary = ________ In the class 45 – 47: lower boundary = ________ upper boundary = ________ Class Mark – It is the midpoint or the middle value in a class. It is obtained by finding the average of the lower limit and the upper limit. Class Size or Class Width – refers to the difference between the upper class boundary and the lower class boundary of a class interval. Cumulative Frequency – shows how many scores fall below or above a certain level Assignment for September 03, 2015 Construct a frequency distribution table for the following set of data. 29 27 28 27 34 29 27 27 28 25 23 35 25 29 33 23 27 33 27 22 40 27 21 29 22 25 29 25 21 20 21 23 25 30 20 28 30 29 28 30 27 27 27 19 30